Pay versus Performance
Pay versus Performance Table
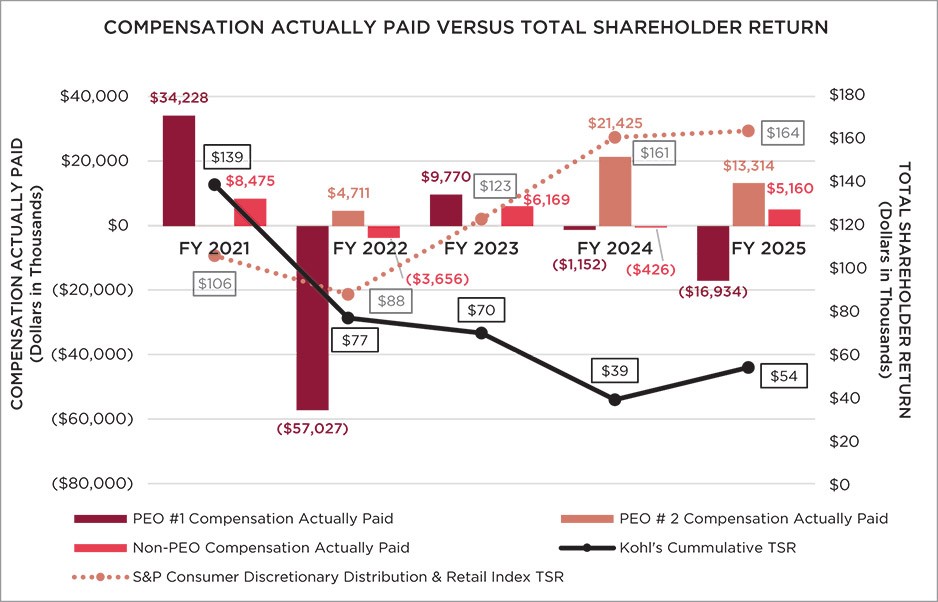
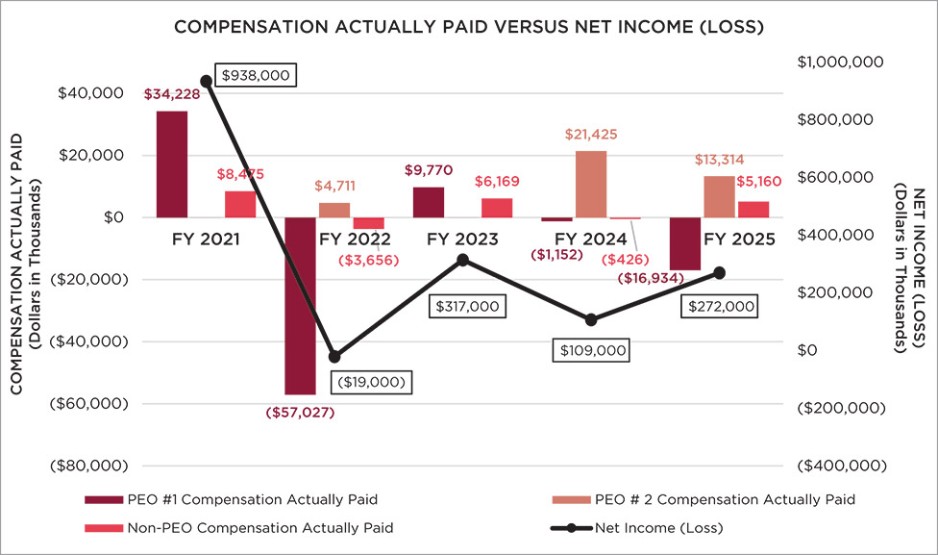
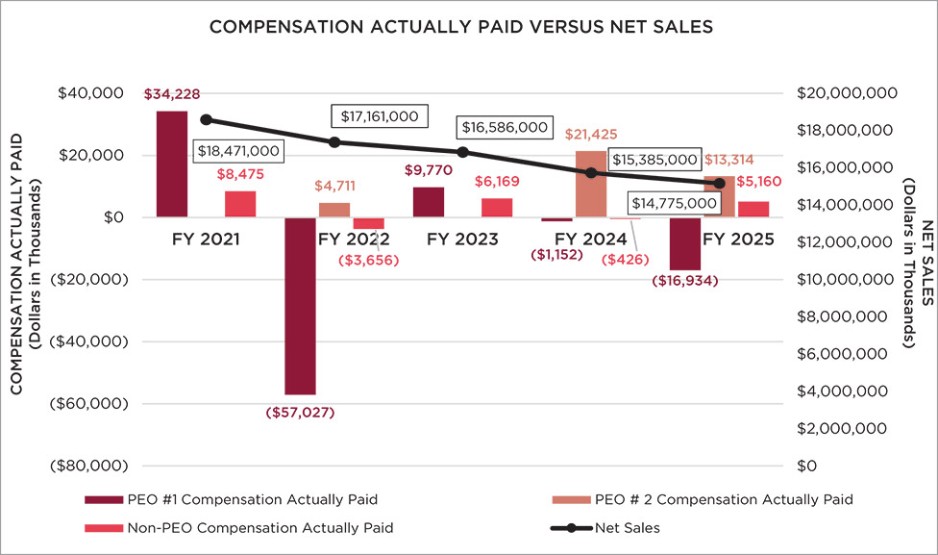
The following table sets forth additional compensation information of our Principal Executive Officer (PEO) and our non-PEO Named Executive Officers (NEOs), along with Total Shareholder Return (TSR), Net Income (Loss), and Net Sales performance results for our Fiscal 2025, 2024, 2023, 2022, and 2021:
| ||||||||||||||||||||
Value of Initial Fixed $100 | ||||||||||||||||||||
Average | Investment | |||||||||||||||||||
Summary | Average | Based on: | ||||||||||||||||||
Summary | Summary | Compensation | Compensation | Compensation | Peer Group | |||||||||||||||
Compensation | Compensation | Compensation | Actually Paid to | Table Total for | Actually Paid to | Total | Total | Net | ||||||||||||
Table Total for | Table Total for | Actually Paid to | Second | Non-PEO | Non-PEO | Shareholder | Shareholder | Income | Net | |||||||||||
First PEO | Second PEO | First PEO (2)(3) | PEO (2) (3) |
| NEOs | NEOs (2) (3) | Return (4) | Return (5) | (Loss) (6) | Sales (6) (7) | ||||||||||
Year (1) | | ($) | | ($) | | ($) | | ($) | | ($) | | ($) | | ($) | | ($) | | ($) | | ($) |
2025 | 9,582,736 | 9,044,466 | (16,934,429) | (8) | 13,314,442 | (8) | 5,059,032 | 5,160,493 | (8) | 53.59 | 164.12 | 272 | 14,775 | |||||||
2024 |
| 11,036,800 |
| 20,907,736 |
| (1,152,491) | (9) | 21,424,896 | (9) | 3,147,860 |
| (426,140) | (9) | 38.90 |
| 161.20 |
| 109 | 15,385 | |
2023 |
| 8,962,889 |
| N/A |
| 9,769,583 | (10) | N/A | 5,883,271 |
| 6,169,062 | (10) | 70.25 |
| 123.16 |
| 317 |
| 16,586 | |
2022 |
| 9,034,094 |
| 4,427,865 |
| (57,026,989) | (11) | 4,710,588 | (11) | 3,420,060 |
| (3,655,769) | (11) | 76.90 |
| 87.69 |
| (19) |
| 17,161 |
2021 |
| 12,924,834 |
| N/A |
| 34,227,502 | (12) | N/A |
| 4,016,239 |
| 8,475,219 | (12) | 139.02 |
| 105.90 |
| 938 |
| 18,471 |
| (1) | Named Executive Officers included in the above table reflect the following: |
Year | PEO #1 | PEO #2 | Non-PEOs | |||
2025 | Mr. Buchanan | Mr. Bender | Ms. Timm, Mr. Hand, Mr. Jones, and Ms. Raymond | |||
2024 | Mr. Kingsbury | Mr. Buchanan | Ms. Timm, Mr. Hand, Mr. Jones, and Ms. Mc Feeney | |||
2023 | Mr. Kingsbury | N/A | Ms. Timm, Mr. Hand, Mr. Jones, Ms. Kent, and Mr. Alves | |||
2022 | Ms. Gass | Mr. Kingsbury | Ms. Timm, Mr. Chini, Ms. Mc Feeney, Ms. Raymond, Mr. Gaffney, and Mr. Revelle | |||
2021 | Ms. Gass | N/A | Ms. Timm, Mr. Howe, Mr. Revelle, and Mr. Gaffney |
| (2) | Fair value or change in fair value, as applicable, of equity awards in the “Compensation Actually Paid” columns was determined by reference to (a) for Restricted Stock Awards and Restricted Stock Units, closing stock price on applicable year-end date(s) or, in the case of vesting dates, the stock price at which the award vested; and (b) for Performance Share Units, the fair value calculated by a Monte Carlo simulation model as of the applicable year-end date(s) multiplied by the probability of achievement as of each such date. |
| (3) | For the portion of “Compensation Actually Paid” that is based on year-end stock prices, the following per share prices were used: |
2025 | 2024 | 2023 | 2022 | 2021 | |||||||
$17.47 | $13.21 | $26.40 | $31.49 | $60.16 |
| (4) | Cumulative TSR is calculated by dividing the sum of the cumulative amount of dividends for the applicable measurement period (assuming dividend reinvestment) and the difference between the Company’s share price at the end and the beginning of the measurement period by the Company’s share price at the beginning of the measurement period. Cumulative TSR for each fiscal year assumes an investment of $100 at the beginning of the applicable measurement period. |
| (5) | Peer Group TSR reflects the Company’s 2025 peer group, which is the S&P 500 Consumer Discretionary Distribution & Retail Index, as reflected in our 2025 Annual Report on Form the 10-K, pursuant to Item 201(e) of Regulation S-K. The chart assumes an investment of $100 on January 30, 2021 and reinvestment of dividends. The calculations exclude trading commissions and taxes. |
| (6) | Dollars in Millions. |
| (7) | Net Sales is the financial performance measure that the Company believes to be the most important measure (that is not otherwise required to be disclosed in the table) it used in the most recent fiscal year to determine compensation. |
| (8) | For Fiscal 2025, “Compensation Actually Paid to First PEO,” “Compensation Actually Paid to Second PEO,” and the “Average Compensation Actually Paid to Non-PEO NEOs” reflects the following adjustments from total compensation reported in the Summary Compensation Table: |
| | | Average | |||
First PEO | Second PEO | Non-PEO NEOs | ||||
Adjustments to Determine 2025 "Compensation Actually Paid” | ($) | ($) | ($) | |||
Total Reported in 2025 Summary Compensation Table (SCT) |
| 9,582,736 |
| 9,044,466 |
| 5,059,032 |
Less, Value of Stock Awards Reported in SCT |
| (9,000,005) |
| (3,775,003) |
| (2,024,998) |
Plus, Year-End Value of Awards Granted in Fiscal Year that Are Unvested and Outstanding |
|
| 7,925,828 |
| 1,779,643 | |
Plus, Change in Fair Value of Prior Year Awards that Are Outstanding and Unvested |
|
|
| 415,789 | ||
Plus, FMV of Awards Granted this Year and that Vested this Year |
|
|
| |||
Plus, Change in Fair Value (from Prior Year-End) of Prior Year Awards that Vested this Year |
|
| 119,151 |
| (68,973) | |
Less, Prior Year Fair Value of Prior Year Awards that Failed to Vest this Year |
| (17,517,160) |
|
| ||
Total Adjustments |
| (26,517,165) |
| 4,269,976 |
| 101,461 |
"Compensation Actually Paid" for Fiscal Year 2025 |
| (16,934,429) |
| 13,314,442 |
| 5,160,493 |
| (9) | For Fiscal 2024, “Compensation Actually Paid to First PEO,” “Compensation Actually Paid to Second PEO,” and the “Average Compensation Actually Paid to Non-PEO NEOs” reflects the following adjustments from total compensation reported in the Summary Compensation Table: |
| | | Average |
| |||
First PEO | Second PEO | Non-PEO NEOs |
| ||||
Adjustments to Determine 2024 "Compensation Actually Paid” | ($) | ($) | ($) |
| |||
Total Reported in 2024 Summary Compensation Table (SCT) |
| 11,036,800 |
| 20,907,736 |
| 3,147,860 | |
Less, Value of Stock Awards Reported in SCT |
| (9,099,987) |
| (17,000,000) |
| (2,024,997) | |
Plus, Year-End Value of Awards Granted in Fiscal Year that Are Unvested and Outstanding |
| 1,721,992 |
| 17,517,160 |
| 396,704 | |
Plus, Change in Fair Value of Prior Year Awards that Are Outstanding and Unvested |
| (4,811,296) |
|
| (1,758,077) | ||
Plus, FMV of Awards Granted this Year and that Vested this Year |
|
|
| ||||
Plus, Change in Fair Value (from Prior Year-End) of Prior Year Awards that Vested this Year |
|
|
| (187,631) | |||
Less, Prior Year Fair Value of Prior Year Awards that Failed to Vest this Year |
|
|
| ||||
Total Adjustments |
| (12,189,291) |
| 517,160 |
| (3,574,000) | |
"Compensation Actually Paid" for Fiscal Year 2024 |
| (1,152,491) |
| 21,424,896 |
| (426,140) |
| (10) | For Fiscal 2023, “Compensation Actually Paid to First PEO” and the “Average Compensation Actually Paid to Non-PEO NEOs” reflects the following adjustments from total compensation reported in the Summary Compensation Table: |
| | Average | ||
First PEO | Non-PEO NEOs | |||
Adjustments to Determine 2023 "Compensation Actually Paid” | ($) | ($) | ||
Total Reported in 2023 Summary Compensation Table (SCT) |
| 8,962,889 |
| 5,883,271 (a) |
Less, Value of Stock Awards Reported in SCT |
| (4,699,989) |
| (3,194,999) |
Plus, Year-End Value of Awards Granted in Fiscal Year that Are Unvested and Outstanding |
| 5,938,380 |
| 3,248,521 |
Plus, Change in Fair Value of Prior Year Awards that Are Outstanding and Unvested |
|
| (67,486) | |
Plus, FMV of Awards Granted this Year and that Vested this Year |
|
| 399,648 | |
Plus, Change in Fair Value (from Prior Year-End) of Prior Year Awards that Vested this Year |
| (431,697) |
| (99,893) |
Less, Prior Year Fair Value of Prior Year Awards that Failed to Vest this Year |
|
| ||
Total Adjustments |
| 806,694 |
| 285,791 |
"Compensation Actually Paid" for Fiscal Year 2023 |
| 9,769,583 |
| 6,169,062 |
| (11) | For Fiscal 2022, “Compensation Actually Paid to First PEO,” “Compensation Actually Paid to Second PEO,” and the “Average Compensation Actually Paid to Non-PEO NEOs” reflects the following adjustments from total compensation reported in the Summary Compensation Table: |
| | | Average |
| |||
First PEO | Second PEO | Non-PEO NEOs |
| ||||
Adjustments to Determine 2022 "Compensation Actually Paid” | ($) | ($) | ($) |
| |||
Total Reported in 2022 Summary Compensation Table (SCT) |
| 9,034,094 |
| 4,427,865 |
| 3,420,060 | |
Less, Value of Stock Awards Reported in SCT |
| (7,549,993) |
| (3,920,000) |
| (1,891,344) | |
Plus, Year-End Value of Awards Granted in Fiscal Year that Are Unvested and Outstanding |
|
| 4,226,216 |
| 972,774 | ||
Plus, Change in Fair Value of Prior Year Awards that Are Outstanding and Unvested |
|
|
| (2,905,529) | |||
Plus, FMV of Awards Granted this Year and that Vested this Year |
|
|
| 67,135 | |||
Plus, Change in Fair Value (from Prior Year-End) of Prior Year Awards that Vested this Year |
| 143,079 |
| (23,493) |
| (389,692) | (a) |
Less, Prior Year Fair Value of Prior Year Awards that Failed to Vest this Year |
| (58,654,169) |
|
| (2,929,173) | (a) | |
Total Adjustments |
| (66,061,083) |
| 282,723 |
| (7,075,829) | |
"Compensation Actually Paid" for Fiscal Year 2022 |
| (57,026,989) |
| 4,710,588 |
| (3,655,769) |
| (12) | For Fiscal 2021, “Compensation Actually Paid to First PEO” and the “Average Compensation Actually Paid to Non-PEO NEOs” reflects the following adjustments from total compensation reported in the Summary Compensation Table: |
| | Average | ||
First PEO | Non-PEO NEOs | |||
Adjustments to Determine 2021 "Compensation Actually Paid” | ($) | ($) | ||
Total Reported in 2021 Summary Compensation Table (SCT) |
| 12,924,834 |
| 4,016,239 |
Less, Value of Stock Awards Reported in SCT |
| (7,250,011) |
| (1,375,046) |
Plus, Year-End Value of Awards Granted in Fiscal Year that Are Unvested and Outstanding |
| 14,444,589 |
| 2,739,579 |
Plus, Change in Fair Value of Prior Year Awards that Are Outstanding and Unvested |
| 12,179,438 |
| 2,675,545 |
Plus, FMV of Awards Granted this Year and that Vested this Year |
|
| ||
Plus, Change in Fair Value (from Prior Year-End) of Prior Year Awards that Vested this Year |
| 1,928,652 |
| 418,902 |
Less, Prior Year Fair Value of Prior Year Awards that Failed to Vest this Year |
|
| ||
Total Adjustments |
| 21,302,668 |
| 4,458,980 |
"Compensation Actually Paid" for Fiscal Year 2021 |
| 34,227,502 |
| 8,475,219 |
| (1) | Named Executive Officers included in the above table reflect the following: |
Year | PEO #1 | PEO #2 | Non-PEOs | |||
2025 | Mr. Buchanan | Mr. Bender | Ms. Timm, Mr. Hand, Mr. Jones, and Ms. Raymond | |||
2024 | Mr. Kingsbury | Mr. Buchanan | Ms. Timm, Mr. Hand, Mr. Jones, and Ms. Mc Feeney | |||
2023 | Mr. Kingsbury | N/A | Ms. Timm, Mr. Hand, Mr. Jones, Ms. Kent, and Mr. Alves | |||
2022 | Ms. Gass | Mr. Kingsbury | Ms. Timm, Mr. Chini, Ms. Mc Feeney, Ms. Raymond, Mr. Gaffney, and Mr. Revelle | |||
2021 | Ms. Gass | N/A | Ms. Timm, Mr. Howe, Mr. Revelle, and Mr. Gaffney |
| (5) | Peer Group TSR reflects the Company’s 2025 peer group, which is the S&P 500 Consumer Discretionary Distribution & Retail Index, as reflected in our 2025 Annual Report on Form the 10-K, pursuant to Item 201(e) of Regulation S-K. The chart assumes an investment of $100 on January 30, 2021 and reinvestment of dividends. The calculations exclude trading commissions and taxes. |
| (8) | For Fiscal 2025, “Compensation Actually Paid to First PEO,” “Compensation Actually Paid to Second PEO,” and the “Average Compensation Actually Paid to Non-PEO NEOs” reflects the following adjustments from total compensation reported in the Summary Compensation Table: |
| | | Average | |||
First PEO | Second PEO | Non-PEO NEOs | ||||
Adjustments to Determine 2025 "Compensation Actually Paid” | ($) | ($) | ($) | |||
Total Reported in 2025 Summary Compensation Table (SCT) |
| 9,582,736 |
| 9,044,466 |
| 5,059,032 |
Less, Value of Stock Awards Reported in SCT |
| (9,000,005) |
| (3,775,003) |
| (2,024,998) |
Plus, Year-End Value of Awards Granted in Fiscal Year that Are Unvested and Outstanding |
|
| 7,925,828 |
| 1,779,643 | |
Plus, Change in Fair Value of Prior Year Awards that Are Outstanding and Unvested |
|
|
| 415,789 | ||
Plus, FMV of Awards Granted this Year and that Vested this Year |
|
|
| |||
Plus, Change in Fair Value (from Prior Year-End) of Prior Year Awards that Vested this Year |
|
| 119,151 |
| (68,973) | |
Less, Prior Year Fair Value of Prior Year Awards that Failed to Vest this Year |
| (17,517,160) |
|
| ||
Total Adjustments |
| (26,517,165) |
| 4,269,976 |
| 101,461 |
"Compensation Actually Paid" for Fiscal Year 2025 |
| (16,934,429) |
| 13,314,442 |
| 5,160,493 |
| (9) | For Fiscal 2024, “Compensation Actually Paid to First PEO,” “Compensation Actually Paid to Second PEO,” and the “Average Compensation Actually Paid to Non-PEO NEOs” reflects the following adjustments from total compensation reported in the Summary Compensation Table: |
| | | Average |
| |||
First PEO | Second PEO | Non-PEO NEOs |
| ||||
Adjustments to Determine 2024 "Compensation Actually Paid” | ($) | ($) | ($) |
| |||
Total Reported in 2024 Summary Compensation Table (SCT) |
| 11,036,800 |
| 20,907,736 |
| 3,147,860 | |
Less, Value of Stock Awards Reported in SCT |
| (9,099,987) |
| (17,000,000) |
| (2,024,997) | |
Plus, Year-End Value of Awards Granted in Fiscal Year that Are Unvested and Outstanding |
| 1,721,992 |
| 17,517,160 |
| 396,704 | |
Plus, Change in Fair Value of Prior Year Awards that Are Outstanding and Unvested |
| (4,811,296) |
|
| (1,758,077) | ||
Plus, FMV of Awards Granted this Year and that Vested this Year |
|
|
| ||||
Plus, Change in Fair Value (from Prior Year-End) of Prior Year Awards that Vested this Year |
|
|
| (187,631) | |||
Less, Prior Year Fair Value of Prior Year Awards that Failed to Vest this Year |
|
|
| ||||
Total Adjustments |
| (12,189,291) |
| 517,160 |
| (3,574,000) | |
"Compensation Actually Paid" for Fiscal Year 2024 |
| (1,152,491) |
| 21,424,896 |
| (426,140) |
| (10) | For Fiscal 2023, “Compensation Actually Paid to First PEO” and the “Average Compensation Actually Paid to Non-PEO NEOs” reflects the following adjustments from total compensation reported in the Summary Compensation Table: |
| | Average | ||
First PEO | Non-PEO NEOs | |||
Adjustments to Determine 2023 "Compensation Actually Paid” | ($) | ($) | ||
Total Reported in 2023 Summary Compensation Table (SCT) |
| 8,962,889 |
| 5,883,271 (a) |
Less, Value of Stock Awards Reported in SCT |
| (4,699,989) |
| (3,194,999) |
Plus, Year-End Value of Awards Granted in Fiscal Year that Are Unvested and Outstanding |
| 5,938,380 |
| 3,248,521 |
Plus, Change in Fair Value of Prior Year Awards that Are Outstanding and Unvested |
|
| (67,486) | |
Plus, FMV of Awards Granted this Year and that Vested this Year |
|
| 399,648 | |
Plus, Change in Fair Value (from Prior Year-End) of Prior Year Awards that Vested this Year |
| (431,697) |
| (99,893) |
Less, Prior Year Fair Value of Prior Year Awards that Failed to Vest this Year |
|
| ||
Total Adjustments |
| 806,694 |
| 285,791 |
"Compensation Actually Paid" for Fiscal Year 2023 |
| 9,769,583 |
| 6,169,062 |
| (11) | For Fiscal 2022, “Compensation Actually Paid to First PEO,” “Compensation Actually Paid to Second PEO,” and the “Average Compensation Actually Paid to Non-PEO NEOs” reflects the following adjustments from total compensation reported in the Summary Compensation Table: |
| | | Average |
| |||
First PEO | Second PEO | Non-PEO NEOs |
| ||||
Adjustments to Determine 2022 "Compensation Actually Paid” | ($) | ($) | ($) |
| |||
Total Reported in 2022 Summary Compensation Table (SCT) |
| 9,034,094 |
| 4,427,865 |
| 3,420,060 | |
Less, Value of Stock Awards Reported in SCT |
| (7,549,993) |
| (3,920,000) |
| (1,891,344) | |
Plus, Year-End Value of Awards Granted in Fiscal Year that Are Unvested and Outstanding |
|
| 4,226,216 |
| 972,774 | ||
Plus, Change in Fair Value of Prior Year Awards that Are Outstanding and Unvested |
|
|
| (2,905,529) | |||
Plus, FMV of Awards Granted this Year and that Vested this Year |
|
|
| 67,135 | |||
Plus, Change in Fair Value (from Prior Year-End) of Prior Year Awards that Vested this Year |
| 143,079 |
| (23,493) |
| (389,692) | (a) |
Less, Prior Year Fair Value of Prior Year Awards that Failed to Vest this Year |
| (58,654,169) |
|
| (2,929,173) | (a) | |
Total Adjustments |
| (66,061,083) |
| 282,723 |
| (7,075,829) | |
"Compensation Actually Paid" for Fiscal Year 2022 |
| (57,026,989) |
| 4,710,588 |
| (3,655,769) |
| (12) | For Fiscal 2021, “Compensation Actually Paid to First PEO” and the “Average Compensation Actually Paid to Non-PEO NEOs” reflects the following adjustments from total compensation reported in the Summary Compensation Table: |
| | Average | ||
First PEO | Non-PEO NEOs | |||
Adjustments to Determine 2021 "Compensation Actually Paid” | ($) | ($) | ||
Total Reported in 2021 Summary Compensation Table (SCT) |
| 12,924,834 |
| 4,016,239 |
Less, Value of Stock Awards Reported in SCT |
| (7,250,011) |
| (1,375,046) |
Plus, Year-End Value of Awards Granted in Fiscal Year that Are Unvested and Outstanding |
| 14,444,589 |
| 2,739,579 |
Plus, Change in Fair Value of Prior Year Awards that Are Outstanding and Unvested |
| 12,179,438 |
| 2,675,545 |
Plus, FMV of Awards Granted this Year and that Vested this Year |
|
| ||
Plus, Change in Fair Value (from Prior Year-End) of Prior Year Awards that Vested this Year |
| 1,928,652 |
| 418,902 |
Less, Prior Year Fair Value of Prior Year Awards that Failed to Vest this Year |
|
| ||
Total Adjustments |
| 21,302,668 |
| 4,458,980 |
"Compensation Actually Paid" for Fiscal Year 2021 |
| 34,227,502 |
| 8,475,219 |
Important Financial Performance Measures
The following unranked performance measures reflect the Company’s most important performance measures used to link executive compensation to company performance in 2025. These performance measures were used by the Compensation Committee to assess company performance and determine annual cash incentives and equity awards paid to our PEO and Non-PEO Named Executive Officers in Fiscal 2025. For further information regarding these performance measures, refer to the Compensation Discussion and Analysis section of this Proxy Statement.
Most Important Performance Measures for Fiscal 2025 |
● Operating Margin |
● Merchandise Sales |
● Net Sales |
| (7) | Net Sales is the financial performance measure that the Company believes to be the most important measure (that is not otherwise required to be disclosed in the table) it used in the most recent fiscal year to determine compensation. |