Pay Versus Performance Table
| | | Average | | | | ||||||
Summary | ||||||||||||
Summary | Compensation | Compensation | Average | Value of Initial | ||||||||
Compensation | Actually | Table Total | Compensation | Fixed $100 Investment | ||||||||
Table Total | Paid | for Non-PEO | Actually Paid | Based On | ||||||||
for PEO | to PEO | NEOs | to Non-PEO NEOs | Total Shareholder Return | Net Loss | |||||||
Year | | ($)(1) | | ($)(2) | | ($)(3) | | ($)(4) | | ($)(5) | | ($ in millions)(6) |
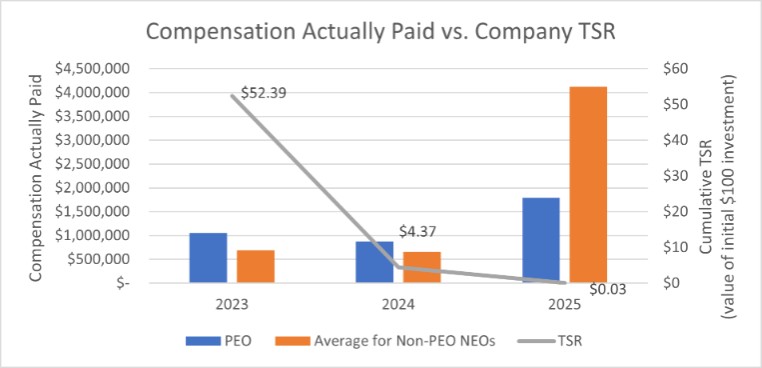
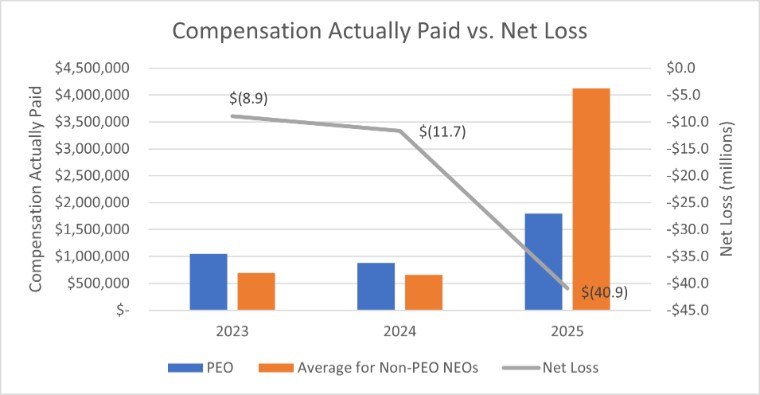
2025 | 2,125,594 | 1,793,592 | 4,208,783 | 4,125,368 | 0.03 | (40.9) | ||||||
2024 |
| 1,269,419 |
| 876,793 |
| 814,738 |
| 655,714 |
| 0.10 |
| (11.7) |
2023 |
| 1,635,226 |
| 1,052,743 |
| 922,495 |
| 690,975 |
| 1.22 |
| (8.9) |
(1) | Reflects the amount reported in the “Total” column of the Summary Compensation Table for Mr. Andreeff for each corresponding year. See “Named Executive Officer Compensation Tables – Summary Compensation Table for 2025”. |
(2) | Amounts reported reflect CAP for Mr. Andreeff, as computed in accordance with Item 402(v) of Regulation S-K, for each corresponding year, which amounts do not reflect the actual amount of compensation earned by or paid to Mr. Andreeff during the applicable year. The adjustments below were made to Mr. Andreeff’s total compensation for each year to determine the CAP for such fiscal year in accordance with the requirements of Item 402(v) of Regulation S-K. |
| Reported | | | | | Equity | | | ||||||
Summary Compensation | Reported | Award | CAP for | |||||||||||
Table Total for PEO | Value of Equity Awards | Adjustments | PEO | |||||||||||
Year | | ($) | | Less | | ($)(a) | | Plus | | ($)(b) | | Equals | | ($)(c) |
2025 | 2,125,594 | — | 636,456 | + | 304,454 | = | 1,793,592 | |||||||
2024 |
| 1,269,419 |
| — |
| 682,760 |
| + |
| 290,134 |
| = |
| 876,793 |
2023 |
| 1,635,226 |
| — |
| 1,115,469 |
| + |
| 532,986 |
| = |
| 1,052,743 |
(a) | Amounts reflect the sum of the grant date fair value of equity awards as reported in the “Stock Awards” and “Option Awards” columns in the Summary Compensation Table for the applicable year. |
(b) | The equity award adjustments were calculated in accordance with Item 402(v) of Regulation S-K and include: (i) the year-end fair value of any equity awards granted in the applicable year that are outstanding and unvested as of the end of the year; (ii) the amount of change as of the end of the applicable year (from the end of the prior fiscal year) in fair value of any awards granted in prior years that are outstanding and unvested as of the end of the applicable year; (iii) for awards granted in the applicable year and vest in the same year, the fair value as of the vesting date; and (iv) for awards granted in prior years that vest in the applicable year, the amount equal to the change as of the vesting date (from the end of the prior fiscal year) in fair value. No dividends or other earnings were paid on stock or option awards in any applicable year. The valuation assumptions used to calculate fair values did not materially differ from those disclosed at the time of grant. The amounts deducted or added in calculating the equity award adjustments for Mr. Andreeff are as follows: |
| Year End Fair | | | Fair Value as | | Change in Fair Value to the | | |||
Value of Equity | Year over Year Change | of Vesting | Vesting Date of Equity | |||||||
Awards Granted in | in Fair | Date of Equity | Awards | Total | ||||||
the Year and | Value of | Awards Granted | Granted in Prior | Equity | ||||||
Outstanding and | Outstanding and | and Vested | Years that Vested | Award | ||||||
Unvested at Year End | Unvested Equity Awards | in the Year | in the Year | Adjustments | ||||||
Year | | ($) | | ($) | | ($) | | ($) | | ($) |
2025 | — | — | 430,252 | (125,798) | 304,454 | |||||
2024 |
| 130,225 |
| (158,145) |
| 441,355 |
| (123,301) |
| 290,134 |
2023 |
| 330,374 |
| (6,515) |
| 212,482 |
| (3,355) |
| 532,986 |
(3) | Reflects the average amount reported in the “Total” column of the Summary Compensation Table for our other NEOs as a group (excluding Mr. Andreeff) for each corresponding year. See “Named Executive Officer Compensation Tables – Summary Compensation Table for 2025”. The names of each of the other NEOs (excluding Mr. Andreeff) included for purposes of calculating the average amounts in 2025 are Messrs. Chee and Mathiesen and in each of 2024 and 2023 are Mr. Mathiesen and Dr. Antonella Favit-Van Pelt, our former Chief Medical Officer. |
(4) | Amounts reported reflect CAP for the other NEOs as a group (excluding Mr. Andreeff), as computed in accordance with Item 402(v) of Regulation S-K, for each corresponding year, which amounts do not reflect an average of the actual amount of compensation earned by or paid to the other NEOs as a group (excluding Mr. Andreeff) during the applicable year. The adjustments below were made to the average total compensation for the NEOs as a group (excluding Mr. Andreeff) for each year to determine the CAP for such year in accordance with the requirements of Item 402(v) of Regulation S-K. |
| Average Reported | | | | | | | |||||||
Summary | Average | |||||||||||||
Compensation | Reported | Average | ||||||||||||
Table | Value of | Equity | Average | |||||||||||
Total for | Equity | Award | CAP for | |||||||||||
Non-PEO NEOs | Awards | Adjustments | Non-PEO NEOs | |||||||||||
Year | | ($) | | Less | | ($) | | Plus | | ($)(a) | | Equals | | ($) |
2025 | 4,208,783 | — | 3,475,258 | + | 3,391,843 | = | 4,125,368 | |||||||
2024 |
| 814,738 |
| — |
| 287,723 |
| + | 128,699 |
| = |
| 655,714 | |
2023 |
| 922,495 |
| — |
| 447,394 |
| + |
| 215,874 |
| = |
| 690,975 |
(a) | See note (b) to footnote (2) above for an explanation of the equity award adjustments made in accordance with Item 402(v) of Regulation S-K. The amounts deducted or added in calculating the total average equity award adjustments for the other NEOs as a group (excluding Mr. Andreeff) are as follows: |
| | | Fair Value as | | | |||||
Average | of Vesting | Average Change | ||||||||
Year End Fair Value | Year over Year Average | Date of Equity | in Fair Value to the | Total | ||||||
of Equity Awards | Change in Fair Value of | Awards | Vesting Date of Equity | Average | ||||||
Granted in the Year | Outstanding and | Granted | Awards Granted in | Equity | ||||||
and Outstanding and | Unvested Equity | and Vested | Prior Years that | Award | ||||||
Unvested at Year End | Awards | in the Year | Vested in the Year | Adjustments | ||||||
Year | | ($) | | ($) | | ($) | | ($) | | ($) |
2025 | — | — | 3,423,756 | (31,913) | 3,391,843 | |||||
2024 |
| 54,879 |
| (63,185) |
| 185,991 |
| (48,986) |
| 128,699 |
2023 |
| 132,513 |
| (1,209) |
| 85,215 |
| (645) |
| 215,874 |
(5) | Cumulative TSR is calculated as the difference between the Company’s share price at the end and the beginning of the measurement period by the Company’s share price at the beginning of the measurement period. |
(6) | Amounts reflect the net income as reported in the Company’s audited financial statements for the applicable year. |
(1) | Reflects the amount reported in the “Total” column of the Summary Compensation Table for Mr. Andreeff for each corresponding year. See “Named Executive Officer Compensation Tables – Summary Compensation Table for 2025”. |
(3) | Reflects the average amount reported in the “Total” column of the Summary Compensation Table for our other NEOs as a group (excluding Mr. Andreeff) for each corresponding year. See “Named Executive Officer Compensation Tables – Summary Compensation Table for 2025”. The names of each of the other NEOs (excluding Mr. Andreeff) included for purposes of calculating the average amounts in 2025 are Messrs. Chee and Mathiesen and in each of 2024 and 2023 are Mr. Mathiesen and Dr. Antonella Favit-Van Pelt, our former Chief Medical Officer. |
(2) | Amounts reported reflect CAP for Mr. Andreeff, as computed in accordance with Item 402(v) of Regulation S-K, for each corresponding year, which amounts do not reflect the actual amount of compensation earned by or paid to Mr. Andreeff during the applicable year. The adjustments below were made to Mr. Andreeff’s total compensation for each year to determine the CAP for such fiscal year in accordance with the requirements of Item 402(v) of Regulation S-K. |
| Reported | | | | | Equity | | | ||||||
Summary Compensation | Reported | Award | CAP for | |||||||||||
Table Total for PEO | Value of Equity Awards | Adjustments | PEO | |||||||||||
Year | | ($) | | Less | | ($)(a) | | Plus | | ($)(b) | | Equals | | ($)(c) |
2025 | 2,125,594 | — | 636,456 | + | 304,454 | = | 1,793,592 | |||||||
2024 |
| 1,269,419 |
| — |
| 682,760 |
| + |
| 290,134 |
| = |
| 876,793 |
2023 |
| 1,635,226 |
| — |
| 1,115,469 |
| + |
| 532,986 |
| = |
| 1,052,743 |
(a) | Amounts reflect the sum of the grant date fair value of equity awards as reported in the “Stock Awards” and “Option Awards” columns in the Summary Compensation Table for the applicable year. |
(b) | The equity award adjustments were calculated in accordance with Item 402(v) of Regulation S-K and include: (i) the year-end fair value of any equity awards granted in the applicable year that are outstanding and unvested as of the end of the year; (ii) the amount of change as of the end of the applicable year (from the end of the prior fiscal year) in fair value of any awards granted in prior years that are outstanding and unvested as of the end of the applicable year; (iii) for awards granted in the applicable year and vest in the same year, the fair value as of the vesting date; and (iv) for awards granted in prior years that vest in the applicable year, the amount equal to the change as of the vesting date (from the end of the prior fiscal year) in fair value. No dividends or other earnings were paid on stock or option awards in any applicable year. The valuation assumptions used to calculate fair values did not materially differ from those disclosed at the time of grant. The amounts deducted or added in calculating the equity award adjustments for Mr. Andreeff are as follows: |
| Year End Fair | | | Fair Value as | | Change in Fair Value to the | | |||
Value of Equity | Year over Year Change | of Vesting | Vesting Date of Equity | |||||||
Awards Granted in | in Fair | Date of Equity | Awards | Total | ||||||
the Year and | Value of | Awards Granted | Granted in Prior | Equity | ||||||
Outstanding and | Outstanding and | and Vested | Years that Vested | Award | ||||||
Unvested at Year End | Unvested Equity Awards | in the Year | in the Year | Adjustments | ||||||
Year | | ($) | | ($) | | ($) | | ($) | | ($) |
2025 | — | — | 430,252 | (125,798) | 304,454 | |||||
2024 |
| 130,225 |
| (158,145) |
| 441,355 |
| (123,301) |
| 290,134 |
2023 |
| 330,374 |
| (6,515) |
| 212,482 |
| (3,355) |
| 532,986 |
(4) | Amounts reported reflect CAP for the other NEOs as a group (excluding Mr. Andreeff), as computed in accordance with Item 402(v) of Regulation S-K, for each corresponding year, which amounts do not reflect an average of the actual amount of compensation earned by or paid to the other NEOs as a group (excluding Mr. Andreeff) during the applicable year. The adjustments below were made to the average total compensation for the NEOs as a group (excluding Mr. Andreeff) for each year to determine the CAP for such year in accordance with the requirements of Item 402(v) of Regulation S-K. |
| Average Reported | | | | | | | |||||||
Summary | Average | |||||||||||||
Compensation | Reported | Average | ||||||||||||
Table | Value of | Equity | Average | |||||||||||
Total for | Equity | Award | CAP for | |||||||||||
Non-PEO NEOs | Awards | Adjustments | Non-PEO NEOs | |||||||||||
Year | | ($) | | Less | | ($) | | Plus | | ($)(a) | | Equals | | ($) |
2025 | 4,208,783 | — | 3,475,258 | + | 3,391,843 | = | 4,125,368 | |||||||
2024 |
| 814,738 |
| — |
| 287,723 |
| + | 128,699 |
| = |
| 655,714 | |
2023 |
| 922,495 |
| — |
| 447,394 |
| + |
| 215,874 |
| = |
| 690,975 |
(a) | See note (b) to footnote (2) above for an explanation of the equity award adjustments made in accordance with Item 402(v) of Regulation S-K. The amounts deducted or added in calculating the total average equity award adjustments for the other NEOs as a group (excluding Mr. Andreeff) are as follows: |
| | | Fair Value as | | | |||||
Average | of Vesting | Average Change | ||||||||
Year End Fair Value | Year over Year Average | Date of Equity | in Fair Value to the | Total | ||||||
of Equity Awards | Change in Fair Value of | Awards | Vesting Date of Equity | Average | ||||||
Granted in the Year | Outstanding and | Granted | Awards Granted in | Equity | ||||||
and Outstanding and | Unvested Equity | and Vested | Prior Years that | Award | ||||||
Unvested at Year End | Awards | in the Year | Vested in the Year | Adjustments | ||||||
Year | | ($) | | ($) | | ($) | | ($) | | ($) |
2025 | — | — | 3,423,756 | (31,913) | 3,391,843 | |||||
2024 |
| 54,879 |
| (63,185) |
| 185,991 |
| (48,986) |
| 128,699 |
2023 |
| 132,513 |
| (1,209) |
| 85,215 |
| (645) |
| 215,874 |
| Year End Fair | | | Fair Value as | | Change in Fair Value to the | | |||
Value of Equity | Year over Year Change | of Vesting | Vesting Date of Equity | |||||||
Awards Granted in | in Fair | Date of Equity | Awards | Total | ||||||
the Year and | Value of | Awards Granted | Granted in Prior | Equity | ||||||
Outstanding and | Outstanding and | and Vested | Years that Vested | Award | ||||||
Unvested at Year End | Unvested Equity Awards | in the Year | in the Year | Adjustments | ||||||
Year | | ($) | | ($) | | ($) | | ($) | | ($) |
2025 | — | — | 430,252 | (125,798) | 304,454 | |||||
2024 |
| 130,225 |
| (158,145) |
| 441,355 |
| (123,301) |
| 290,134 |
2023 |
| 330,374 |
| (6,515) |
| 212,482 |
| (3,355) |
| 532,986 |
| | | Fair Value as | | | |||||
Average | of Vesting | Average Change | ||||||||
Year End Fair Value | Year over Year Average | Date of Equity | in Fair Value to the | Total | ||||||
of Equity Awards | Change in Fair Value of | Awards | Vesting Date of Equity | Average | ||||||
Granted in the Year | Outstanding and | Granted | Awards Granted in | Equity | ||||||
and Outstanding and | Unvested Equity | and Vested | Prior Years that | Award | ||||||
Unvested at Year End | Awards | in the Year | Vested in the Year | Adjustments | ||||||
Year | | ($) | | ($) | | ($) | | ($) | | ($) |
2025 | — | — | 3,423,756 | (31,913) | 3,391,843 | |||||
2024 |
| 54,879 |
| (63,185) |
| 185,991 |
| (48,986) |
| 128,699 |
2023 |
| 132,513 |
| (1,209) |
| 85,215 |
| (645) |
| 215,874 |