Pay vs Performance Disclosure - USD ($)
Dec. 31, 2025
Dec. 31, 2024
Dec. 31, 2023
Pay Versus Performance Disclosure
In accordance with rules adopted by the SEC pursuant to the Dodd-Frank Wall Street Reform and Consumer Protection Act of 2010, we are providing the following disclosure regarding executive compensation for our principal executive officer (“PEO”) and Non-PEO NEOs and Company performance for the fiscal years listed below. The Compensation Committee did not consider the pay versus performance disclosure below in making its pay decisions for any of the years shown.
Year | Summary Compensation Table Total for the Principal Executive Officer (“PEO”)(1) (2) | Compensation Actually Paid to PEO(1) (3) (4) | Average Summary Compensation Table Total for Non-PEO NEOs(1) (3) (5) | Average Compensation Actually Paid to Non-PEO NEOs(1) (3) (6) | Valuation of Initial Fixed $100 Investment Based on TSR(7) | Net Income (Loss) (in thousands)(8) | ||||||||||||
2025 | $1,123,127 | $948,928 | $557,231 | $439,295 | $0.05 | $(29,778) | ||||||||||||
2024 | $919,310 | $863,615 | $422,407 | $409,903 | $1.45 | $(34,946) | ||||||||||||
2023 | $2,560,269 | $803,949 | $811,517 | $420,395 | $4.44 | $(68,920) | ||||||||||||
(1) | We are a smaller reporting company pursuant to Rule 405 of the Securities Act and as such, we are only required to include information for the past three fiscal years in the table. |
(2) | The dollar amounts reported in this column are the amounts of total compensation reported in the “Total” column of the Summary Compensation Table for the 2023, 2024, and 2025 fiscal years for Mr. Rood who served as our PEO for the applicable year. For additional information, see “Executive Compensation – Summary Compensation Table.” |
(3) | For each of the three years presented in the above table, John C. Rood was our Principal Executive Officer (“PEO”). Our Non-PEO Named Executive Officers (“Non-PEO NEOs”) were (i) Jon Layman and Rob Schwarz in 2025, (ii) Paul Ney and Rob Schwarz in 2024, and (iii) Paul Ney and Rob Schwarz in 2023. |
(4) | The dollar amounts reported in this column represent the amount of the “compensation actually paid” to Mr. Rood. In accordance with the requirements of Item 402(v) of Regulation S-K, the adjustments made to Mr. Rood’s total compensation for each year to determine the compensation actually paid are shown in the table below: |
Adjustments to Determine Compensation Actually Paid to PEO | 2025 ($) | 2024 ($) | 2023 ($) | ||||||
Summary Compensation Table Totals for PEO. | 1,123,127 | 919,310 | 2,560,269 | ||||||
Less: Stock Values Reported in SCT for the Covered Year ($) | (208,195) | — | (752,094) | ||||||
Plus: Fair Value for Stock Granted and Vested in the Covered Year (on Vest Date) ($) | — | — | — | ||||||
Plus: Fair Value of Outstanding Unvested Stock Granted in Covered Year at Year-End ($) | 46,538 | — | 43,596 | ||||||
Plus: Change in Fair Value of Outstanding Unvested Stock from Prior Years at Year-End ($) | (4,512) | (30,821) | (794,671) | ||||||
Plus: Change in Fair Value of Stock Granted in Prior Years That Vested During Covered Year (on Vest Date) ($) | (8,030) | (24,874) | (253,151) | ||||||
Compensation Actually Paid | $948,928 | $863,615 | $803,949 | ||||||
(5) | The dollar amounts reported in this column represent the average of the amounts reported for the Non-PEO NEOs as a group for each corresponding year in the “Total” column of the Summary Compensation Table as disclosed in the proxy statements for the applicable years. |
(6) | The dollar amounts reported in this column for our Non-PEO NEOs as a group in each appliable year, represent averages of the “compensation actually paid” to the Non-PEO NEOs. The dollar amounts do not reflect the actual average amount of compensation earned by or paid to the Non-PEO NEOs during the applicable year. In accordance with the requirements of Item 402(v) of Regulation S-K, the adjustments made to the average total compensation for the Non-PEO NEOs for each year to determine the average compensation actually paid are shown in the table below: |
Adjustments to Determine Compensation Actually Paid to Non-PEO NEOs | 2025 ($) | 2024 ($) | 2023 ($) | ||||||
Summary Compensation Table Totals | 557,231 | 422,407 | 811,517 | ||||||
Less: Stock Values Reported in SCT for the Covered Year ($) | (138,777) | — | (210,418) | ||||||
Plus: Fair Value for Stock Granted and Vested in the Covered Year (on Vest Date) ($) | — | — | — | ||||||
Plus: Fair Value of Outstanding Unvested Stock Granted in Covered Year at Year-End ($) | 23,476 | — | 12,195 | ||||||
Plus: Change in Fair Value of Outstanding Unvested Stock from Prior Years at Year-End ($) | (1,778) | (7,209) | (129,402) | ||||||
Adjustments to Determine Compensation Actually Paid to Non-PEO NEOs | 2025 ($) | 2024 ($) | 2023 ($) | ||||||
Plus: Change in Fair Value of Stock Granted in Prior Years That Vested During Covered Year (on Vest Date) ($) | (857) | (5,296) | (63,499) | ||||||
Compensation Actually Paid | $439,295 | $409,903 | $420,395 | ||||||
(7) | Cumulative Total Shareholder Return (“TSR”) represents the return on a fixed investment of $100 in our Class A common stock for the period beginning on the last trading day of 2022 through the last trading day of the applicable fiscal year. |
(8) | The dollar amounts reported represent the amount of net loss reflected in the Company’s audited financial statements for each year presented. |
(2) | The dollar amounts reported in this column are the amounts of total compensation reported in the “Total” column of the Summary Compensation Table for the 2023, 2024, and 2025 fiscal years for Mr. Rood who served as our PEO for the applicable year. For additional information, see “Executive Compensation – Summary Compensation Table.” |
(3) | For each of the three years presented in the above table, John C. Rood was our Principal Executive Officer (“PEO”). Our Non-PEO Named Executive Officers (“Non-PEO NEOs”) were (i) Jon Layman and Rob Schwarz in 2025, (ii) Paul Ney and Rob Schwarz in 2024, and (iii) Paul Ney and Rob Schwarz in 2023. |
(4) | The dollar amounts reported in this column represent the amount of the “compensation actually paid” to Mr. Rood. In accordance with the requirements of Item 402(v) of Regulation S-K, the adjustments made to Mr. Rood’s total compensation for each year to determine the compensation actually paid are shown in the table below: |
Adjustments to Determine Compensation Actually Paid to PEO | 2025 ($) | 2024 ($) | 2023 ($) | ||||||
Summary Compensation Table Totals for PEO. | 1,123,127 | 919,310 | 2,560,269 | ||||||
Less: Stock Values Reported in SCT for the Covered Year ($) | (208,195) | — | (752,094) | ||||||
Plus: Fair Value for Stock Granted and Vested in the Covered Year (on Vest Date) ($) | — | — | — | ||||||
Plus: Fair Value of Outstanding Unvested Stock Granted in Covered Year at Year-End ($) | 46,538 | — | 43,596 | ||||||
Plus: Change in Fair Value of Outstanding Unvested Stock from Prior Years at Year-End ($) | (4,512) | (30,821) | (794,671) | ||||||
Plus: Change in Fair Value of Stock Granted in Prior Years That Vested During Covered Year (on Vest Date) ($) | (8,030) | (24,874) | (253,151) | ||||||
Compensation Actually Paid | $948,928 | $863,615 | $803,949 | ||||||
(6) | The dollar amounts reported in this column for our Non-PEO NEOs as a group in each appliable year, represent averages of the “compensation actually paid” to the Non-PEO NEOs. The dollar amounts do not reflect the actual average amount of compensation earned by or paid to the Non-PEO NEOs during the applicable year. In accordance with the requirements of Item 402(v) of Regulation S-K, the adjustments made to the average total compensation for the Non-PEO NEOs for each year to determine the average compensation actually paid are shown in the table below: |
Adjustments to Determine Compensation Actually Paid to Non-PEO NEOs | 2025 ($) | 2024 ($) | 2023 ($) | ||||||
Summary Compensation Table Totals | 557,231 | 422,407 | 811,517 | ||||||
Less: Stock Values Reported in SCT for the Covered Year ($) | (138,777) | — | (210,418) | ||||||
Plus: Fair Value for Stock Granted and Vested in the Covered Year (on Vest Date) ($) | — | — | — | ||||||
Plus: Fair Value of Outstanding Unvested Stock Granted in Covered Year at Year-End ($) | 23,476 | — | 12,195 | ||||||
Plus: Change in Fair Value of Outstanding Unvested Stock from Prior Years at Year-End ($) | (1,778) | (7,209) | (129,402) | ||||||
Adjustments to Determine Compensation Actually Paid to Non-PEO NEOs | 2025 ($) | 2024 ($) | 2023 ($) | ||||||
Plus: Change in Fair Value of Stock Granted in Prior Years That Vested During Covered Year (on Vest Date) ($) | (857) | (5,296) | (63,499) | ||||||
Compensation Actually Paid | $439,295 | $409,903 | $420,395 | ||||||
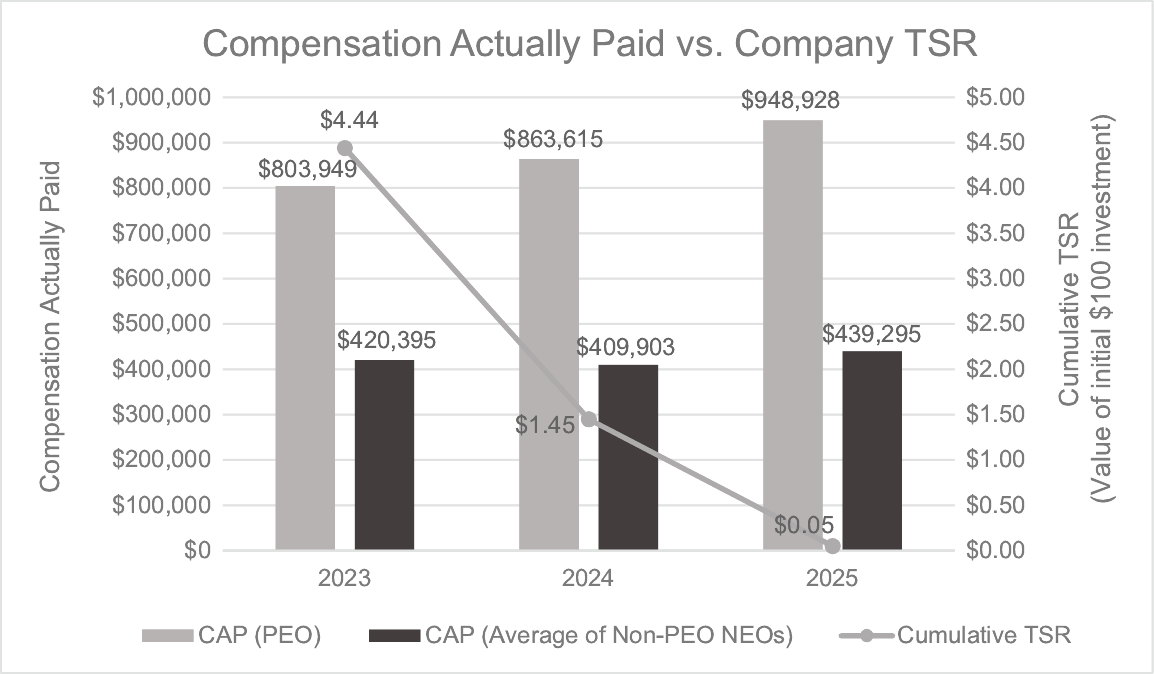
Relationship Between Compensation Actually Paid vs. Cumulative TSR of Company
The following chart illustrates the relationship between Compensation Actually Paid for our PEO and the average Compensation Actually Paid for our Non-PEO NEOs against the Company’s TSR:
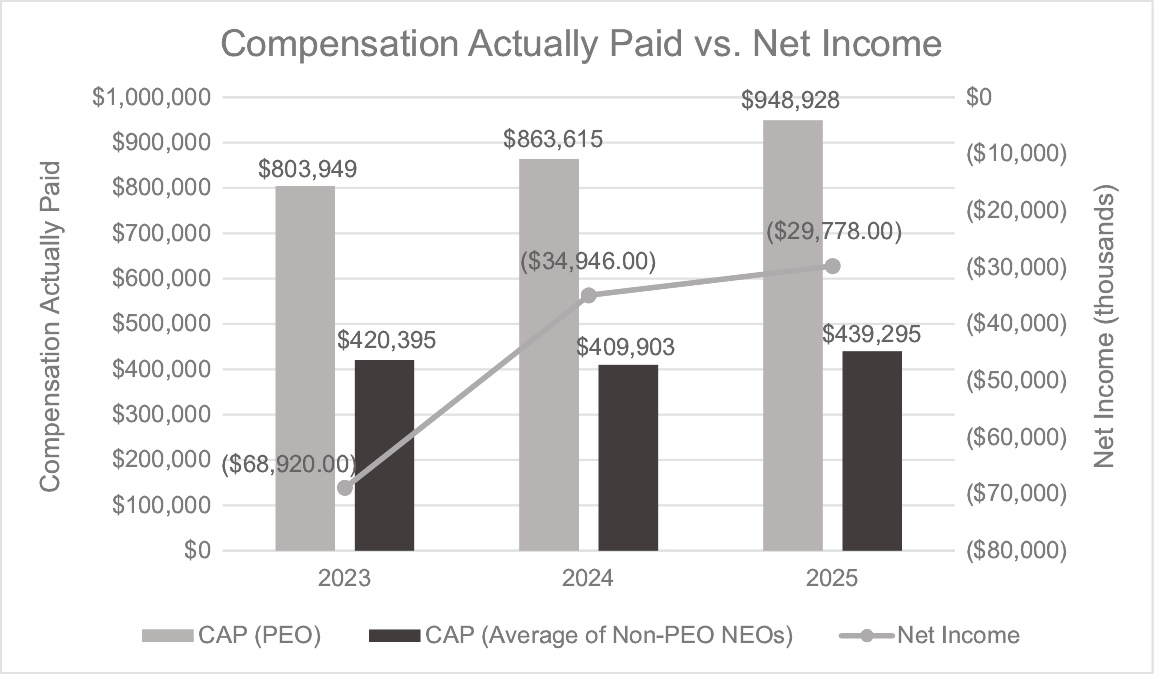
Relationship Between Compensation Actually Paid vs. Net Income
The following chart illustrates the relationship between Compensation Actually Paid for our PEO and the average Compensation Actually Paid for our Non-PEO NEOs against the Company’s net income: