Pay Versus Performance Table | ||||||||||
Value of Initial Fixed $100 | ||||||||||
Year | SCT Total | SCT Total | CAP to | CAP to | Avg. SCT | Avg. CAP to | TSR | Peer Group | Net Income | Diluted |
($)(1) | ($)(2) | ($)(3) | ($)(4) | ($)(5) | ($)(6) | ($)(7) | ($)(8) | ($) | ($) | |
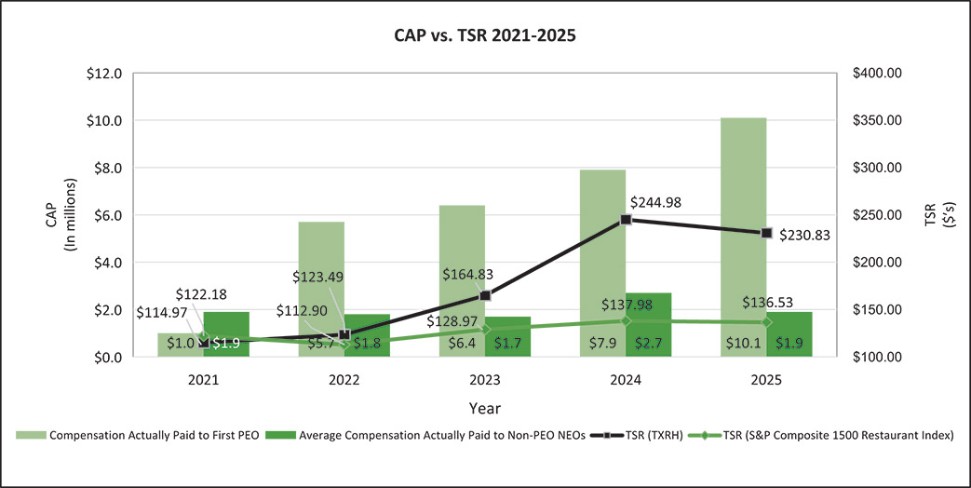
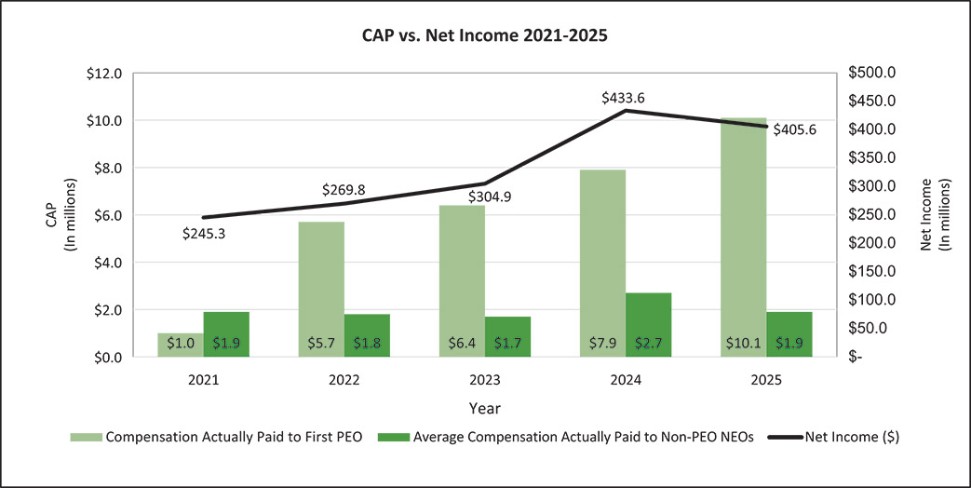
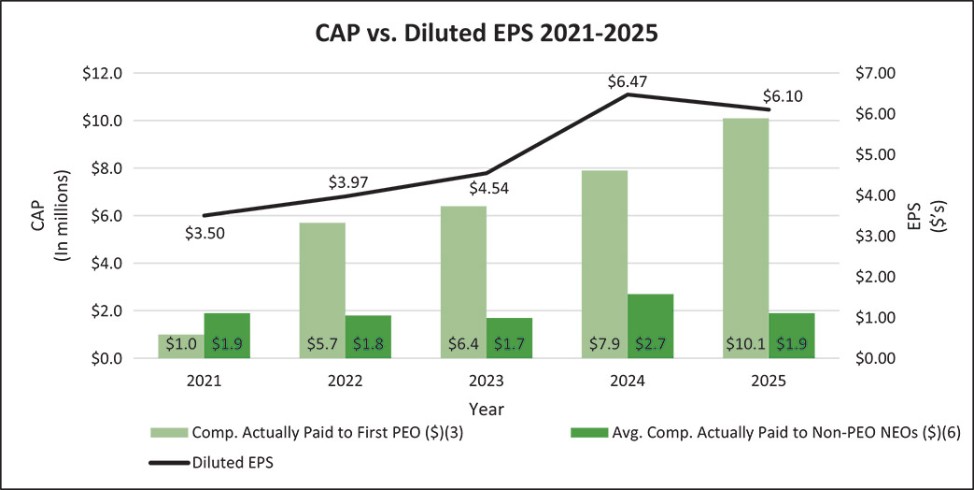
2025 | 10,822,133 | N/A | 10,139,183 | N/A | 2,497,043 | 1,937,250 | 230.83 | 136.53 | 405.6 | 6.10 |
2024 | 6,186,009 | N/A | 7,866,236 | N/A | 2,156,772 | 2,669,087 | 244.98 | 137.98 | 433.6 | 6.47 |
2023 | 5,347,527 | N/A | 6,435,377 | N/A | 1,746,269 | 1,697,782 | 164.83 | 128.97 | 304.9 | 4.54 |
2022 | 4,421,989 | N/A | 5,725,465 | N/A | 1,662,319 | 1,823,561 | 123.49 | 112.90 | 269.8 | 3.97 |
2021 | 3,769,765 | 4,986,164 | 3,801,740 | (2,793,754) | 2,634,509 | 1,934,435 | 114.97 | 122.18 | 245.3 | 3.50 |
(1) | For the purposes of this table, the Principal Executive Officer refers to Gerald L. Morgan. On March 18, 2021, Mr. Morgan was named Chief Executive Officer of the Company following W. Kent Taylor’s passing. The amounts described in this column relate to amounts disclosed in the Summary Compensation Table of this proxy statement. Additionally, for the purposes of the 2021 fiscal year, the amounts also reflect compensation received by Mr. Morgan for positions within the Company before assuming the role of Chief Executive Officer on March 18, 2021. |
(2) | For the purposes of this table, the Second Principal Executive Officer refers to W. Kent Taylor. Mr. Taylor served as the Chief Executive Officer of the Company until his passing on March 18, 2021. The amounts described in this column relate to amounts disclosed in the Summary Compensation Table of this proxy statement. |
(3) | The dollar amounts reported in the “CAP to First PEO” column have been calculated in accordance with Item 402(v) of Regulation S-K and do not reflect compensation actually earned, realized, or received by the First PEO. These amounts reflect the amount set forth in the “Total” column of the “Summary Compensation Table” for each fiscal year presented, with certain adjustments as described in the table below, in accordance with the requirements of Item 402(v) of Regulation S-K. Amounts in the below reconciliation table may not sum to total due to rounding: |
CALCULATION OF FIRST PEO CAP | ||||||||
Year | SCT | SCT | Value of | Change in | Value of | Change in | Value of | CAP to First PEO($) |
($)(a) | ($)(b) | ($)(c) | ($)(d) | ($)(e) | ($)(f) | ($)(g)(i) | (a)-(b)+(c)+(d)+(e)+(f)-(g) | |
2025 | 10,822,133 | 8,410,928 | 7,767,360 | — | — | (39,382) | 10,139,183 | |
2024 | 6,186,009 | 2,602,600 | 3,969,460 | — | — | 313,367 | — | 7,866,236 |
2023 | 5,347,527 | 2,599,856 | 3,423,848 | — | — | 263,858 | — | 6,435,377 |
2022 | 4,421,989 | 2,201,368 | 2,297,748 | — | 4,996 | 1,202,100 | — | 5,725,465 |
2021 | 3,769,765 | 2,394,513 | 2,352,525 | — | — | 73,963 | — | 3,801,740 |
| (i) | For the purposes of determining the amount that should be included in column (g) of each footnote throughout the Company’s Pay Versus Performance disclosure, the Company has used (i) the value of the difference in the target amount of performance based restricted stock units that an applicable officer was granted for a particular fiscal year and the amount of performance based restricted stock units that actually vested to the extent the same is less than such target amount, and (ii) the value of the difference in the target amount of “retention” restricted stock units that an applicable officer was granted and the amount of “retention” restricted stock units that actually vested (as and if applicable). |
(4)
CALCULATION OF SECOND PEO CAP | ||||||||
Year | SCT | SCT | Value of | Change in | Value of | Change in | Value of | CAP to Second PEO($) |
($)(a) | ($)(b) | ($)(c) | ($)(d) | ($)(e) | ($)(f) | ($)(g) | (a)-(b)+(c)+(d)+(e)+(f)-(g) | |
2025 | N/A | N/A | N/A | N/A | N/A | N/A | N/A | N/A |
2024 | N/A | N/A | N/A | N/A | N/A | N/A | N/A | N/A |
2023 | N/A | N/A | N/A | N/A | N/A | N/A | N/A | N/A |
2022 | N/A | N/A | N/A | N/A | N/A | N/A | N/A | N/A |
2021 | 4,986,164 | 4,753,200 | — | — | 1,909,885 | 880,222 | 5,816,825 | (2,793,754) |
(5) | For the purposes of the 2021 fiscal year, the Non-Principal Executive Officers include Tonya R. Robinson, Doug W. Thompson, S. Chris Jacobsen, Christopher C. Colson, Hernan E. Mujica, and Regina A. Tobin. |
For the purposes of the 2022 fiscal year, the Non-Principal Executive Officers include Tonya R. Robinson, S. Chris Jacobsen, Christopher C. Colson, Hernan E. Mujica, and Regina A. Tobin.
For the purposes of the 2023 fiscal year, the Non-Principal Executive Officers include Regina A. Tobin, D. Christopher Monroe, Keith V. Humpich, Tonya R. Robinson, Travis C. Doster, S. Chris Jacobsen, Christopher C. Colson, and Hernan E. Mujica.
For the purposes of the 2024 fiscal year, the Non-Principal Executive Officers include Regina A. Tobin, D. Christopher Monroe, Travis C. Doster, Christopher C. Colson, and Hernan E. Mujica.
For the purposes of the 2025 fiscal year, the Non-Principal Executive Officers include Regina A. Tobin, Michael S. Lenihan, Travis C. Doster, Christopher C. Colson, Hernan E. Mujica, L. Paul Marshall, Keith V. Humpich, and D. Christopher Monroe.
(6)
CALCULATION OF 2021 NON-PEO CAP | ||||||||
Non PEO | SCT | SCT | Value of | Change in | Value of | Change in | Value of | CAP to Non-PEO($) |
Robinson | 1,788,492 | 998,855 | 1,120,250 | — | — | 5,234 | 147,497 | 1,767,624 |
Thompson | 7,556,722 | 2,376,600 | — | — | — | 6,192 | 1,475,289 | 3,711,025 |
Jacobsen | 1,712,853 | 950,640 | 1,075,440 | — | — | 4,020 | 516,319 | 1,325,354 |
Tobin | 1,395,079 | 822,315 | 761,770 | — | — | 56,190 | — | 1,390,724 |
Colson | 1,589,173 | 945,109 | 873,795 | — | — | 66,566 | — | 1,584,425 |
Mujica | 1,764,732 | 1,142,043 | 1,064,238 | — | — | 140,529 | — | 1,827,456 |
Average | 2,634,509 | 1,205,927 | 815,916 | — | — | 46,455 | 356,518 | 1,934,435 |
CALCULATION OF 2022 NON-PEO CAP | ||||||||
Non PEO | SCT | SCT | Value of | Change in | Value of | Change in | Value of | CAP to Non-PEO($) |
Robinson | 1,755,123 | 893,178 | 932,283 | — | — | 205,623 | — | 1,999,851 |
Jacobsen | 1,787,674 | 793,936 | 828,696 | — | — | 403,536 | — | 2,225,970 |
Tobin | 1,788,904 | 795,166 | 913,449 | — | — | (11,380) | — | 1,895,807 |
Colson | 1,489,948 | 496,210 | 517,935 | — | — | (6,458) | — | 1,505,215 |
Mujica | 1,489,948 | 496,210 | 517,935 | — | — | (20,710) | — | 1,490,963 |
Average | 1,662,319 | 694,940 | 742,060 | — | — | 114,122 | — | 1,823,561 |
CALCULATION OF 2023 NON-PEO CAP | ||||||||
Non PEO | SCT | SCT | Value of | Change in | Value of | Change in | Value of | CAP to Non-PEO($) |
Tobin | 2,400,016 | 897,792 | 1,182,336 | — | — | 90,021 | — | 2,774,581 |
Monroe | 1,398,938 | 404,484 | 455,692 | — | — | — | — | 1,450,146 |
Humpich | 1,148,979 | 364,629 | 421,946 | — | — | 48,696 | — | 1,254,992 |
Robinson | 2,021,333 | — | — | — | — | — | 932,283 | 1,089,050 |
Doster | 1,518,004 | 860,836 | 1,014,838 | — | — | 70,954 | — | 1,742,960 |
Jacobsen | 1,827,450 | 804,272 | — | — | — | 95,188 | — | 1,118,366 |
Colson | 1,826,340 | 794,920 | 1,046,860 | — | — | (3,575) | — | 2,074,705 |
Mujica | 1,829,094 | 794,920 | 1,046,860 | — | — | (3,575) | — | 2,077,459 |
Average | 1,746,269 | 615,232 | 646,067 | — | — | 37,214 | 116,535 | 1,697,782 |
CALCULATION OF 2024 NON-PEO CAP | ||||||||
Non PEO | SCT | SCT | Value of | Change in | Value of | Change in | Value of | CAP to Non-PEO($) |
Tobin | 2,830,728 | 899,080 | 1,371,268 | — | — | 92,110 | — | 3,395,026 |
Monroe | 2,345,344 | 792,610 | 1,208,881 | — | — | 169,556 | — | 2,931,171 |
Doster | 1,413,672 | 92,442 | 113,310 | 274,896 | — | 159,213 | — | 1,868,649 |
Colson | 2,095,563 | 792,610 | 1,208,881 | — | — | 61,966 | — | 2,573,800 |
Mujica | 2,098,551 | 792,610 | 1,208,881 | — | — | 61,966 | — | 2,576,788 |
Average | 2,156,772 | 673,870 | 1,022,244 | 54,979 | — | 108,962 | — | 2,669,087 |
CALCULATION OF 2025 NON-PEO CAP | ||||||||
Non PEO | SCT | SCT | Value of | Change in | Value of | Change in | Value of | CAP to Non-PEO($) |
Tobin | 4,085,463 | 2,900,320 | 2,678,400 | — | — | (11,500) | — | 3,852,043 |
Lenihan | 534,374 | 492,768 | 485,460 | — | — | — | — | 527,066 |
Doster | 2,844,018 | 1,885,208 | 1,740,960 | — | — | (10,474) | — | 2,689,296 |
Colson | 2,842,506 | 1,885,208 | 1,740,960 | — | — | (7,523) | — | 2,690,735 |
Mujica | 2,845,260 | 1,885,208 | 1,740,960 | — | — | (7,523) | — | 2,693,489 |
Marshall | 2,328,292 | 1,432,033 | 1,322,460 | — | — | (5,960) | — | 2,212,759 |
Humpich | 1,638,793 | 875,787 | 822,604 | — | — | 8,341 | — | 1,593,951 |
Monroe | 2,857,634 | 1,885,208 | — | — | — | 7,197 | 1,740,960 | (761,337) |
Average | 2,497,043 | 1,655,218 | 1,316,476 | — | — | (3,430) | 217,620 | 1,937,250 |
| (7) | For the purposes of calculating the Company’s total shareholder return (“TSR”), the Company’s TSR increased 15.0% in fiscal year 2021, increased 7.4% in fiscal year 2022, increased 33.5% in fiscal year 2023, increased 48.6% in fiscal year 2024, and decreased 5.8% in fiscal year 2025. |
| (8) | As more particularly shown in the Company’s Annual Report on Form 10-K for the year ended December 28, 2021, we presented a performance graph by comparing our cumulative TSR against the Russell 3000 Restaurant Index. In connection with our Annual Report on Form 10-K for the year ended December 28, 2021, December 27, 2022, December 26, 2023, December 31, 2024, and December 30, 2025, the Company presented a performance graph by comparing our cumulative TSR against the S&P Composite 1500 Restaurant Sub-Index (the “S&P Index”). For the purposes of the table above, we have shown the TSR for the Company’s peer companies using the S&P Index. In furtherance of the foregoing, using the S&P Composite 1500 Restaurant Sub-Index, the TSR of the Company’s peer companies increased 22.2% in fiscal year 2021, decreased 7.6% in fiscal year 2022, increased 14.2% in fiscal year 2023, increased 7.0% in fiscal year 2024, and decreased 1.1% in fiscal year 2025. |
| (8) | As more particularly shown in the Company’s Annual Report on Form 10-K for the year ended December 28, 2021, we presented a performance graph by comparing our cumulative TSR against the Russell 3000 Restaurant Index. In connection with our Annual Report on Form 10-K for the year ended December 28, 2021, December 27, 2022, December 26, 2023, December 31, 2024, and December 30, 2025, the Company presented a performance graph by comparing our cumulative TSR against the S&P Composite 1500 Restaurant Sub-Index (the “S&P Index”). For the purposes of the table above, we have shown the TSR for the Company’s peer companies using the S&P Index. In furtherance of the foregoing, using the S&P Composite 1500 Restaurant Sub-Index, the TSR of the Company’s peer companies increased 22.2% in fiscal year 2021, decreased 7.6% in fiscal year 2022, increased 14.2% in fiscal year 2023, increased 7.0% in fiscal year 2024, and decreased 1.1% in fiscal year 2025. |
(3) | The dollar amounts reported in the “CAP to First PEO” column have been calculated in accordance with Item 402(v) of Regulation S-K and do not reflect compensation actually earned, realized, or received by the First PEO. These amounts reflect the amount set forth in the “Total” column of the “Summary Compensation Table” for each fiscal year presented, with certain adjustments as described in the table below, in accordance with the requirements of Item 402(v) of Regulation S-K. Amounts in the below reconciliation table may not sum to total due to rounding: |
CALCULATION OF FIRST PEO CAP | ||||||||
Year | SCT | SCT | Value of | Change in | Value of | Change in | Value of | CAP to First PEO($) |
($)(a) | ($)(b) | ($)(c) | ($)(d) | ($)(e) | ($)(f) | ($)(g)(i) | (a)-(b)+(c)+(d)+(e)+(f)-(g) | |
2025 | 10,822,133 | 8,410,928 | 7,767,360 | — | — | (39,382) | 10,139,183 | |
2024 | 6,186,009 | 2,602,600 | 3,969,460 | — | — | 313,367 | — | 7,866,236 |
2023 | 5,347,527 | 2,599,856 | 3,423,848 | — | — | 263,858 | — | 6,435,377 |
2022 | 4,421,989 | 2,201,368 | 2,297,748 | — | 4,996 | 1,202,100 | — | 5,725,465 |
2021 | 3,769,765 | 2,394,513 | 2,352,525 | — | — | 73,963 | — | 3,801,740 |
| (i) | For the purposes of determining the amount that should be included in column (g) of each footnote throughout the Company’s Pay Versus Performance disclosure, the Company has used (i) the value of the difference in the target amount of performance based restricted stock units that an applicable officer was granted for a particular fiscal year and the amount of performance based restricted stock units that actually vested to the extent the same is less than such target amount, and (ii) the value of the difference in the target amount of “retention” restricted stock units that an applicable officer was granted and the amount of “retention” restricted stock units that actually vested (as and if applicable). |
(4)
CALCULATION OF SECOND PEO CAP | ||||||||
Year | SCT | SCT | Value of | Change in | Value of | Change in | Value of | CAP to Second PEO($) |
($)(a) | ($)(b) | ($)(c) | ($)(d) | ($)(e) | ($)(f) | ($)(g) | (a)-(b)+(c)+(d)+(e)+(f)-(g) | |
2025 | N/A | N/A | N/A | N/A | N/A | N/A | N/A | N/A |
2024 | N/A | N/A | N/A | N/A | N/A | N/A | N/A | N/A |
2023 | N/A | N/A | N/A | N/A | N/A | N/A | N/A | N/A |
2022 | N/A | N/A | N/A | N/A | N/A | N/A | N/A | N/A |
2021 | 4,986,164 | 4,753,200 | — | — | 1,909,885 | 880,222 | 5,816,825 | (2,793,754) |
CALCULATION OF 2021 NON-PEO CAP | ||||||||
Non PEO | SCT | SCT | Value of | Change in | Value of | Change in | Value of | CAP to Non-PEO($) |
Robinson | 1,788,492 | 998,855 | 1,120,250 | — | — | 5,234 | 147,497 | 1,767,624 |
Thompson | 7,556,722 | 2,376,600 | — | — | — | 6,192 | 1,475,289 | 3,711,025 |
Jacobsen | 1,712,853 | 950,640 | 1,075,440 | — | — | 4,020 | 516,319 | 1,325,354 |
Tobin | 1,395,079 | 822,315 | 761,770 | — | — | 56,190 | — | 1,390,724 |
Colson | 1,589,173 | 945,109 | 873,795 | — | — | 66,566 | — | 1,584,425 |
Mujica | 1,764,732 | 1,142,043 | 1,064,238 | — | — | 140,529 | — | 1,827,456 |
Average | 2,634,509 | 1,205,927 | 815,916 | — | — | 46,455 | 356,518 | 1,934,435 |
CALCULATION OF 2022 NON-PEO CAP | ||||||||
Non PEO | SCT | SCT | Value of | Change in | Value of | Change in | Value of | CAP to Non-PEO($) |
Robinson | 1,755,123 | 893,178 | 932,283 | — | — | 205,623 | — | 1,999,851 |
Jacobsen | 1,787,674 | 793,936 | 828,696 | — | — | 403,536 | — | 2,225,970 |
Tobin | 1,788,904 | 795,166 | 913,449 | — | — | (11,380) | — | 1,895,807 |
Colson | 1,489,948 | 496,210 | 517,935 | — | — | (6,458) | — | 1,505,215 |
Mujica | 1,489,948 | 496,210 | 517,935 | — | — | (20,710) | — | 1,490,963 |
Average | 1,662,319 | 694,940 | 742,060 | — | — | 114,122 | — | 1,823,561 |
CALCULATION OF 2023 NON-PEO CAP | ||||||||
Non PEO | SCT | SCT | Value of | Change in | Value of | Change in | Value of | CAP to Non-PEO($) |
Tobin | 2,400,016 | 897,792 | 1,182,336 | — | — | 90,021 | — | 2,774,581 |
Monroe | 1,398,938 | 404,484 | 455,692 | — | — | — | — | 1,450,146 |
Humpich | 1,148,979 | 364,629 | 421,946 | — | — | 48,696 | — | 1,254,992 |
Robinson | 2,021,333 | — | — | — | — | — | 932,283 | 1,089,050 |
Doster | 1,518,004 | 860,836 | 1,014,838 | — | — | 70,954 | — | 1,742,960 |
Jacobsen | 1,827,450 | 804,272 | — | — | — | 95,188 | — | 1,118,366 |
Colson | 1,826,340 | 794,920 | 1,046,860 | — | — | (3,575) | — | 2,074,705 |
Mujica | 1,829,094 | 794,920 | 1,046,860 | — | — | (3,575) | — | 2,077,459 |
Average | 1,746,269 | 615,232 | 646,067 | — | — | 37,214 | 116,535 | 1,697,782 |
CALCULATION OF 2024 NON-PEO CAP | ||||||||
Non PEO | SCT | SCT | Value of | Change in | Value of | Change in | Value of | CAP to Non-PEO($) |
Tobin | 2,830,728 | 899,080 | 1,371,268 | — | — | 92,110 | — | 3,395,026 |
Monroe | 2,345,344 | 792,610 | 1,208,881 | — | — | 169,556 | — | 2,931,171 |
Doster | 1,413,672 | 92,442 | 113,310 | 274,896 | — | 159,213 | — | 1,868,649 |
Colson | 2,095,563 | 792,610 | 1,208,881 | — | — | 61,966 | — | 2,573,800 |
Mujica | 2,098,551 | 792,610 | 1,208,881 | — | — | 61,966 | — | 2,576,788 |
Average | 2,156,772 | 673,870 | 1,022,244 | 54,979 | — | 108,962 | — | 2,669,087 |
CALCULATION OF 2025 NON-PEO CAP | ||||||||
Non PEO | SCT | SCT | Value of | Change in | Value of | Change in | Value of | CAP to Non-PEO($) |
Tobin | 4,085,463 | 2,900,320 | 2,678,400 | — | — | (11,500) | — | 3,852,043 |
Lenihan | 534,374 | 492,768 | 485,460 | — | — | — | — | 527,066 |
Doster | 2,844,018 | 1,885,208 | 1,740,960 | — | — | (10,474) | — | 2,689,296 |
Colson | 2,842,506 | 1,885,208 | 1,740,960 | — | — | (7,523) | — | 2,690,735 |
Mujica | 2,845,260 | 1,885,208 | 1,740,960 | — | — | (7,523) | — | 2,693,489 |
Marshall | 2,328,292 | 1,432,033 | 1,322,460 | — | — | (5,960) | — | 2,212,759 |
Humpich | 1,638,793 | 875,787 | 822,604 | — | — | 8,341 | — | 1,593,951 |
Monroe | 2,857,634 | 1,885,208 | — | — | — | 7,197 | 1,740,960 | (761,337) |
Average | 2,497,043 | 1,655,218 | 1,316,476 | — | — | (3,430) | 217,620 | 1,937,250 |
The following table lists the three financial performance measures that we believe represent the most important financial measures to link compensation actually paid to our Named Executive Officers in 2025 to our performance.
Most Important Performance Measures |
1) Diluted Earnings Per Share Growth |
2) Profit Growth |
3) Change in Stock Price |