Pay vs Performance Disclosure - USD ($)
Dec. 31, 2024
Dec. 31, 2025
Nov. 25, 2025
Dec. 31, 2025
Sep. 30, 2024
Sep. 30, 2023
Sep. 30, 2022
Sep. 30, 2021
Pay Versus Performance
As required by Item 402(v) of Regulation S-K (“Item 402(v)”), the Company is providing the following information regarding the relationship between the executive compensation actually paid (“CAP”) by the Company to our principal executive officer (“PEO”) and the average of all other non-PEO NEOs (“Other NEOs”) and the financial performance of the Company using selected financial performance measures over the applicable time period of the disclosure, calculated in a manner consistent with Item 402(v). Please refer to our “Compensation Discussion and Analysis” section for a discussion of the Company’s executive compensation policies and programs and an explanation of how executive compensation decisions are made at Republic.
Year | SCT Total for PEO(1) ($) | CAP to PEO(1),(2) ($) | SCT Total for Other NEOs(3) ($) | CAP for Other NEOs(4) ($) | Value of Initial Fixed $100 Investment Based On: | Net Income(7) ($000s) | Adjusted EBITDA(8) ($000s) | |||||||||||||||||||||||
Mr. Ornstein | Mr. Grizzle | Mr. Ornstein | Mr. Grizzle | Republic TSR(5) | Peer Group TSR(6) | |||||||||||||||||||||||||
2025 | 5,498,461 | 4,262,081 | 5,722,130 | 4,757,195 | 4,522,478 | 5,004,945 | 41.51 | 151.20 | 76,200 | 341,700 | ||||||||||||||||||||
2024T | 156,250 | — | 137,242 | — | 143,367 | 128,450 | 39.32 | 141.63 | (111,944) | 11,005 | ||||||||||||||||||||
2024 | 1,825,942 | — | 1,896,950 | — | 1,069,548 | 1,061,433 | 41.02 | 137.30 | (91,015) | 55,514 | ||||||||||||||||||||
2023 | 1,868,406 | — | 1,683,858 | — | 905,512 | 738,346 | 29.15 | 121.41 | (120,116) | 24,222 | ||||||||||||||||||||
2022 | 1,867,608 | — | 161,076 | — | 914,730 | 292,155 | 55.93 | 96.37 | (182,678) | 66,623 | ||||||||||||||||||||
2021 | 1,861,055 | — | 3,568,886 | — | 990,887 | 1,726,651 | 259.66 | 121.22 | 16,588 | 150,002 | ||||||||||||||||||||
(1) | On November 25, 2025, in connection with the completion of the Merger, the Company’s executive officers were reconstituted. At the Effective Time of the Merger, Mr. Grizzle was appointed as the Company’s Chairman & Chief Executive Officer; and consequently, CAP comparisons are shown for each of Mr. Ornstein and Mr. Grizzle in 2025. Mr. Ornstein was the Company’s sole PEO in 2021, 2022, 2023, and 2024. |
(2) | The amounts in this column represents the total compensation actually paid to (lost by) the PEO for the years indicated, adjusting the Summary Compensation Table (“SCT”) total compensation by the amounts in the “PEOs” table below. |
(3) | The amounts in this column represents the average Summary Compensation Table (“SCT”) total compensation of our Other NEOs: Messrs. Koscal, Allman, Kinstedt, Pulley, and Lotz for 2025; Mr. Lotz for 2024 TP; Messrs. Lotz and Brian S. Gillman for 2024; and Messrs. Lotz, Gillman, Torque Zubeck, and Bradford R. Rich, for each of 2023, 2022, and 2021, as reported in the Summary Compensation Table of the proxy statement filed in the applicable year. |
(4) | The amounts in this column represents the average total compensation actually paid to (lost by) the Other NEOs for the years indicated, adjusting the Summary Compensation Table (“SCT”) total compensation by the amounts in the “Other NEOs” table below. |
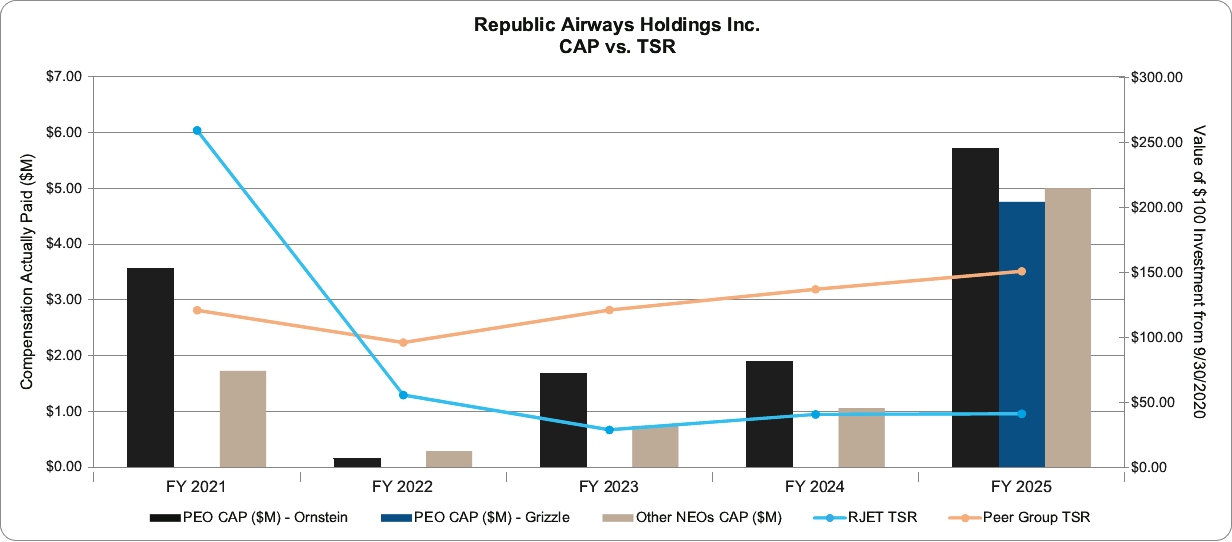
(5) | The total shareholder return shows the cumulative total shareholder return (“TSR”) on the Company’s common stock through the last day of each fiscal year reflected in the table above, assuming an initial investment of $100.00 on September 30, 2020. The calculation was adjusted for the Reverse Stock Split. |
(6) | The peer group total shareholder return shows the cumulative total shareholder return (“TSR”) of the Nasdaq Transportation Index through the last day of each fiscal year reflected in the table above, assuming an initial investment of $100.00 on September 30, 2020, with dividends reinvested. |
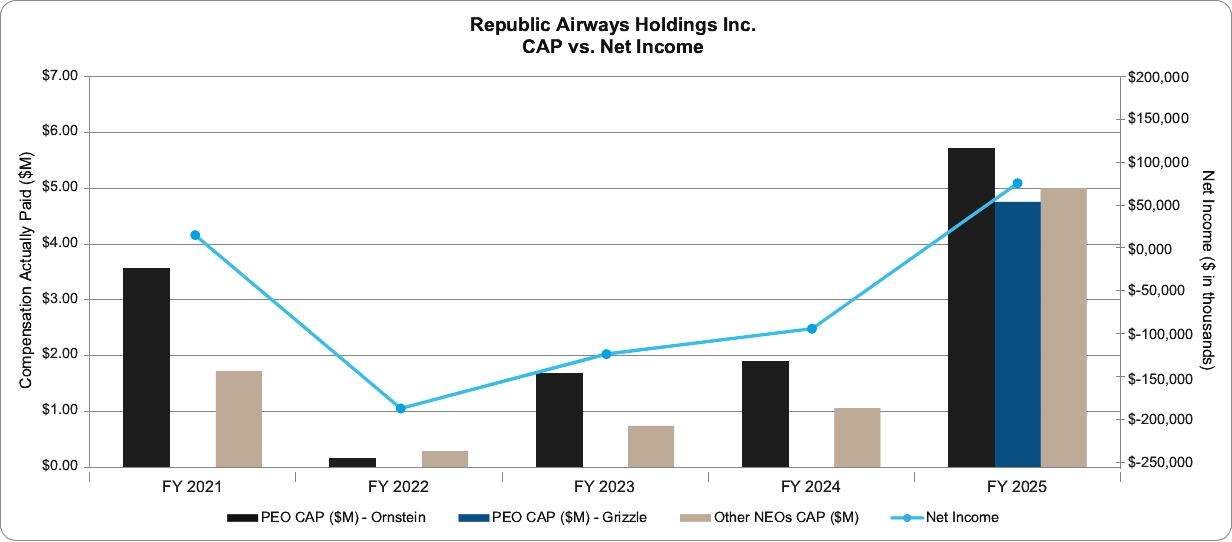
(7) | The amounts in this column represent the Company’s net income (loss) for the indicated years as reported in the Company’s Annual Report on Form 10-K filed with the SEC. |
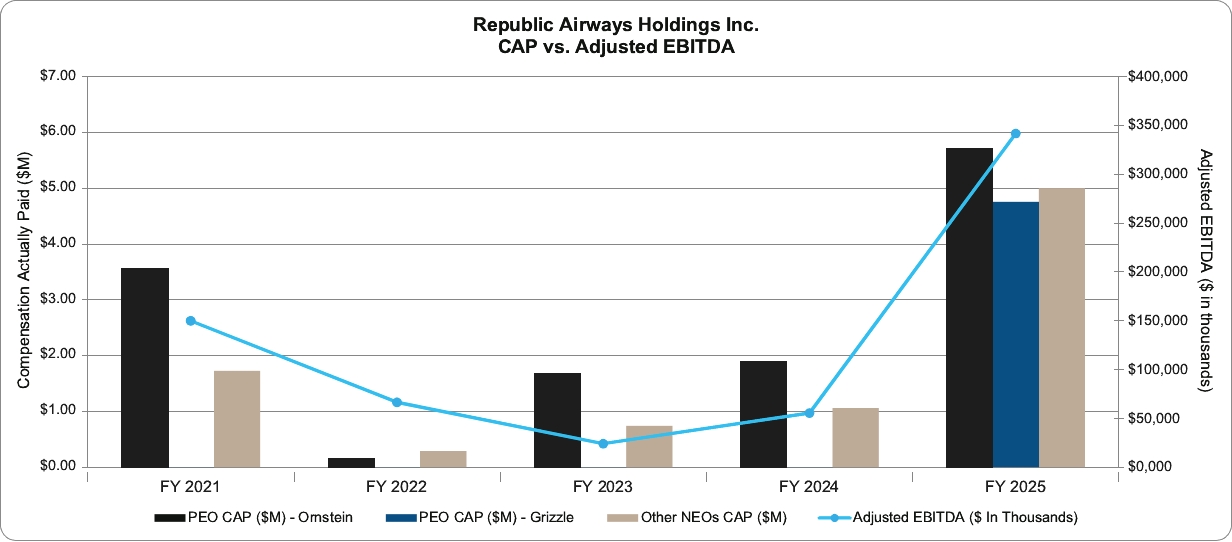
(8) | We define Adjusted EBITDA in a manner consistent with the definition we use when reporting our financial results. See “Part II, Item 7: Management’s Discussion and Analysis of Financial Condition and Results of Operations – Results of Operations,” beginning on page 45 of our 2025 Form 10-K for information regarding our calculation of Adjusted EBITDA. |
PEOs | Mr. Ornstein- 2025 | Mr. Grizzle- 2025 | Mr. Ornstein- 2024T | Mr. Ornstein- 2024 | ||||||||
Total compensation as reported in SCT | $5,498,461 | $4,262,081 | $156,250 | $1,825,942 | ||||||||
Subtract SCT “Stock Awards” value | $191,085 | $3,326,400 | $— | $332,228 | ||||||||
Add Year-end fair value of outstanding and unvested equity compensation granted in current year | $— | $3,718,366 | $— | $319,939 | ||||||||
Add Change in fair value (from end of prior fiscal year to end of current fiscal year) for awards granted in prior fiscal years that remained unvested and outstanding at end of current fiscal year | $— | $— | $(19,008) | $40,513 | ||||||||
Add Fair value of awards, as of the vesting date, for awards granted in current fiscal year that vested before fiscal year end | $327,836 | $103,148 | $— | $— | ||||||||
Add Change in fair value (from end of prior fiscal year to vesting date) for awards granted in prior fiscal years that vested during current fiscal year | $86,918 | $— | $— | $42,785 | ||||||||
Subtract Fair value of awards forfeited in current fiscal year determined at end of prior fiscal year | $— | $— | $— | $— | ||||||||
Compensation Actually Paid to PEO | $5,722,130 | $4,757,195 | $137,242 | $1,896,950 | ||||||||
Other NEOs | Other NEOs-2025 | Other NEOs-2024T | Other NEOs-2024 | |||||||||
Total compensation as reported in SCT | $4,522,478 | $143,367 | $1,069,548 | |||||||||
Subtract SCT “Stock Awards” value | $2,338,147 | $— | $219,385 | |||||||||
Add Year-end fair value of outstanding and unvested equity compensation granted in current year | $2,633,295 | $— | $168,009 | |||||||||
Add Change in fair value (from end of prior fiscal year to end of current fiscal year) for awards granted in prior fiscal years that remained unvested and outstanding at end of current fiscal year | $— | $(14,917) | $21,016 | |||||||||
Add Fair value of awards, as of the vesting date, for awards granted in current fiscal year that vested before fiscal year end | $173,717 | $— | $— | |||||||||
Add Change in fair value (from end of prior fiscal year to vesting date) for awards granted in prior fiscal years that vested during current fiscal year | $13,602 | $— | $22,244 | |||||||||
Subtract Fair value of awards forfeited in current fiscal year determined at end of prior fiscal year | $— | $— | $— | |||||||||
Compensation Actually Paid to PEO | $5,004,945 | $128,450 | $1,061,433 | |||||||||
(1) | On November 25, 2025, in connection with the completion of the Merger, the Company’s executive officers were reconstituted. At the Effective Time of the Merger, Mr. Grizzle was appointed as the Company’s Chairman & Chief Executive Officer; and consequently, CAP comparisons are shown for each of Mr. Ornstein and Mr. Grizzle in 2025. Mr. Ornstein was the Company’s sole PEO in 2021, 2022, 2023, and 2024. |
(3) | The amounts in this column represents the average Summary Compensation Table (“SCT”) total compensation of our Other NEOs: Messrs. Koscal, Allman, Kinstedt, Pulley, and Lotz for 2025; Mr. Lotz for 2024 TP; Messrs. Lotz and Brian S. Gillman for 2024; and Messrs. Lotz, Gillman, Torque Zubeck, and Bradford R. Rich, for each of 2023, 2022, and 2021, as reported in the Summary Compensation Table of the proxy statement filed in the applicable year. |
(6) | The peer group total shareholder return shows the cumulative total shareholder return (“TSR”) of the Nasdaq Transportation Index through the last day of each fiscal year reflected in the table above, assuming an initial investment of $100.00 on September 30, 2020, with dividends reinvested. |
(2) | The amounts in this column represents the total compensation actually paid to (lost by) the PEO for the years indicated, adjusting the Summary Compensation Table (“SCT”) total compensation by the amounts in the “PEOs” table below. |
PEOs | Mr. Ornstein- 2025 | Mr. Grizzle- 2025 | Mr. Ornstein- 2024T | Mr. Ornstein- 2024 | ||||||||
Total compensation as reported in SCT | $5,498,461 | $4,262,081 | $156,250 | $1,825,942 | ||||||||
Subtract SCT “Stock Awards” value | $191,085 | $3,326,400 | $— | $332,228 | ||||||||
Add Year-end fair value of outstanding and unvested equity compensation granted in current year | $— | $3,718,366 | $— | $319,939 | ||||||||
Add Change in fair value (from end of prior fiscal year to end of current fiscal year) for awards granted in prior fiscal years that remained unvested and outstanding at end of current fiscal year | $— | $— | $(19,008) | $40,513 | ||||||||
Add Fair value of awards, as of the vesting date, for awards granted in current fiscal year that vested before fiscal year end | $327,836 | $103,148 | $— | $— | ||||||||
Add Change in fair value (from end of prior fiscal year to vesting date) for awards granted in prior fiscal years that vested during current fiscal year | $86,918 | $— | $— | $42,785 | ||||||||
Subtract Fair value of awards forfeited in current fiscal year determined at end of prior fiscal year | $— | $— | $— | $— | ||||||||
Compensation Actually Paid to PEO | $5,722,130 | $4,757,195 | $137,242 | $1,896,950 | ||||||||
(4) | The amounts in this column represents the average total compensation actually paid to (lost by) the Other NEOs for the years indicated, adjusting the Summary Compensation Table (“SCT”) total compensation by the amounts in the “Other NEOs” table below. |
Other NEOs | Other NEOs-2025 | Other NEOs-2024T | Other NEOs-2024 | |||||||||
Total compensation as reported in SCT | $4,522,478 | $143,367 | $1,069,548 | |||||||||
Subtract SCT “Stock Awards” value | $2,338,147 | $— | $219,385 | |||||||||
Add Year-end fair value of outstanding and unvested equity compensation granted in current year | $2,633,295 | $— | $168,009 | |||||||||
Add Change in fair value (from end of prior fiscal year to end of current fiscal year) for awards granted in prior fiscal years that remained unvested and outstanding at end of current fiscal year | $— | $(14,917) | $21,016 | |||||||||
Add Fair value of awards, as of the vesting date, for awards granted in current fiscal year that vested before fiscal year end | $173,717 | $— | $— | |||||||||
Add Change in fair value (from end of prior fiscal year to vesting date) for awards granted in prior fiscal years that vested during current fiscal year | $13,602 | $— | $22,244 | |||||||||
Subtract Fair value of awards forfeited in current fiscal year determined at end of prior fiscal year | $— | $— | $— | |||||||||
Compensation Actually Paid to PEO | $5,004,945 | $128,450 | $1,061,433 | |||||||||
Financial Performance Measures
The most important financial performance measures used by the Company in 2025 related to CAP based on Company performance are listed below:
• | Adjusted EBITDA |
• | Pre-Tax Income |
• | Adjusted EBITDAR |
(8) | We define Adjusted EBITDA in a manner consistent with the definition we use when reporting our financial results. See “Part II, Item 7: Management’s Discussion and Analysis of Financial Condition and Results of Operations – Results of Operations,” beginning on page 45 of our 2025 Form 10-K for information regarding our calculation of Adjusted EBITDA. |