Pay vs Performance Disclosure
|
3 Months Ended |
12 Months Ended |
Dec. 31, 2020 |
Dec. 31, 2025
USD ($)
|
Dec. 31, 2024
USD ($)
|
Dec. 31, 2023
USD ($)
|
Dec. 31, 2022
USD ($)
|
Dec. 31, 2021
USD ($)
|
| Pay vs Performance Disclosure |
|
|
|
|
|
|
| Pay vs Performance Disclosure, Table |
|
| | | | | | | | | | | | | | | | | | | | | | | | | | | | | | | | | | | | VALUE OF INITIAL FIXED $100 INVESTMENT BASED ON: | | | FISCAL YEAR | SUMMARY COMPENSATION TABLE TOTAL FOR PEO (1) | COMPENSATION ACTUALLY PAID TO PEO (1)(2) | | | AVERAGE SUMMARY COMPENSATION TABLE TOTAL FOR NON-PEO NEOS (3)(4)- | AVERAGE COMPENSATION ACTUALLY PAID TO NON-PEO NEOS (3)(4) | TOTAL SHAREHOLDER RETURN (5) | PEER GROUP TOTAL SHAREHOLDER RETURN (5) | NET INCOME (6) | CROCE (%) (7) | | (a) | (b) | (c) | | | (d) | (e) | (f) | (g) | (h) | (i) | | 2025 | $ | 2,884,957 | | $ | 1,338,101 | | | | $ | 1,331,789 | | $ | 965,311 | | $ | 131.84 | | $ | 246.96 | | $ | (34,731,199) | | 11.9 | % | | 2024 | $ | 3,403,046 | | $ | 2,548,311 | | | | $ | 919,180 | | $ | 484,003 | | $ | 206.09 | | $ | 251.80 | | $ | 67,470,314 | | 15.9 | % | | 2023 | $ | 3,762,729 | | $ | 1,481,896 | | | | $ | 1,189,765 | | $ | 627,525 | | $ | 221.25 | | $ | 253.58 | | $ | 104,864,641 | | 17.2 | % | | 2022 | $ | 3,718,193 | | $ | 3,338,519 | | | | $ | 1,260,139 | | $ | 1,183,597 | | $ | 372.78 | | $ | 244.21 | | $ | 138,635,025 | | 20.7 | % | | 2021 | $ | 3,493,117 | | $ | 3,586,781 | | | | $ | 934,244 | | $ | 1,158,645 | | $ | 345.51 | | $ | 167.58 | | $ | 3,322,892 | | 11.6 | % |
|
|
|
|
|
| Company Selected Measure Name |
|
CROCE
|
|
|
|
|
| Named Executive Officers, Footnote |
|
Reflects the summary compensation table total compensation of our current Chief Executive Officer, Paul D. McKinney.
|
|
|
|
|
| Peer Group Issuers, Footnote |
|
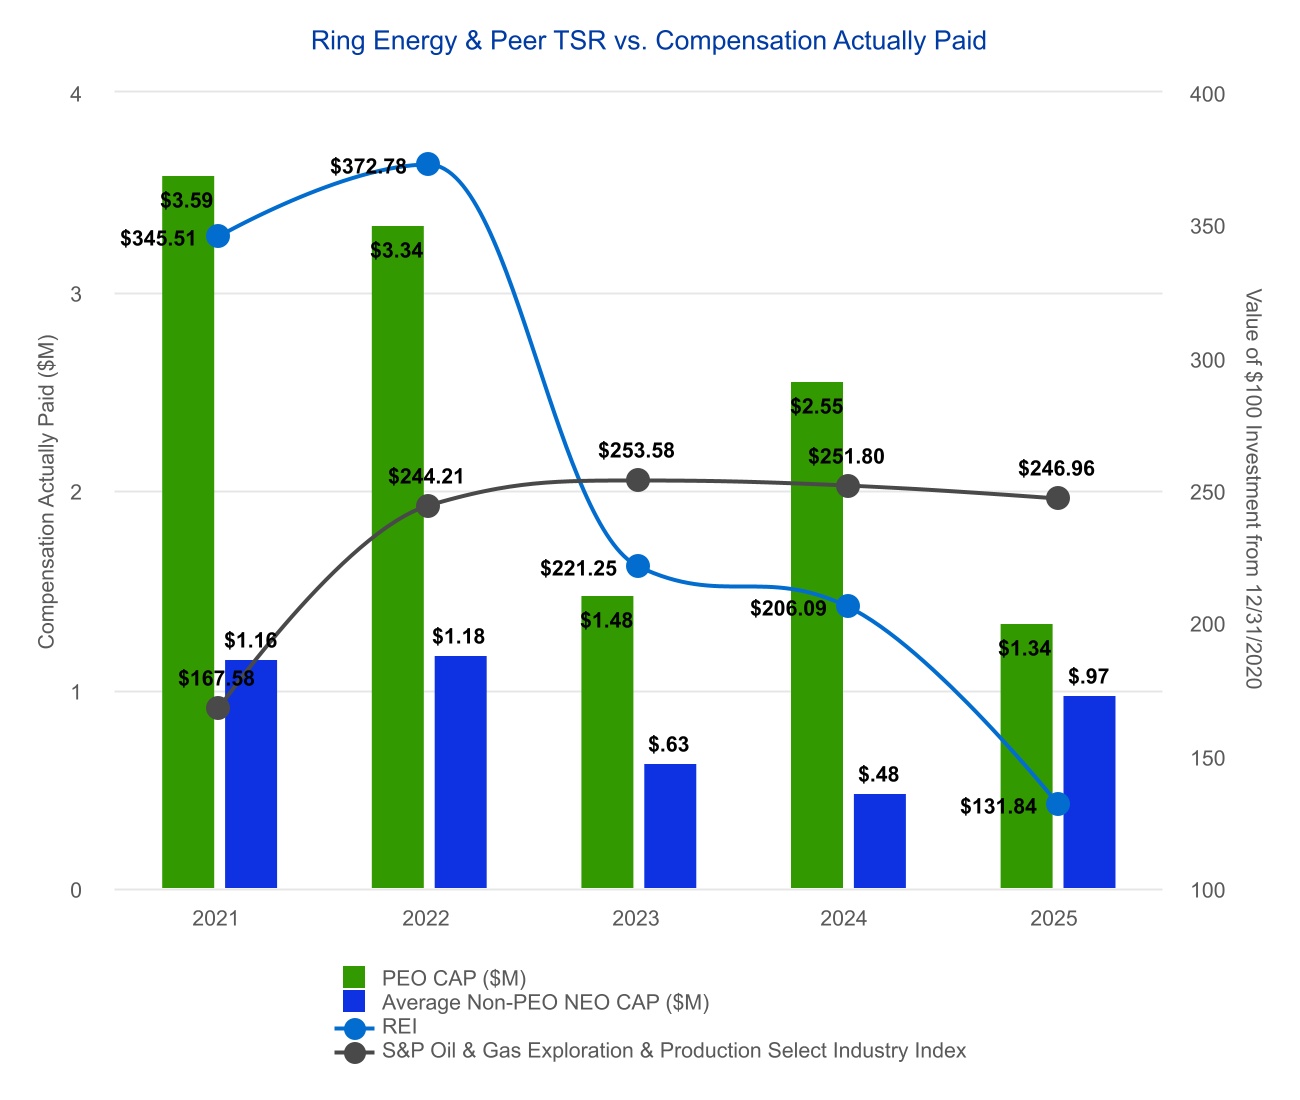
TSR is cumulative for the measurement periods beginning on December 31, 2020 and ending on December 31 of each of 2025, 2024, 2023, 2022, and 2021 respectively, calculated in accordance with Item 201(e) of Regulation S-K. The peer group for purposes of this table is the S&P Oil and Gas Exploration and Production Select Industry Total Return Index (“SPSIOP”), which is the same peer group as for the Shareholder Return Performance Presentation of the Company’s Annual Report on Form 10-K for the year ended December 31, 2025.
|
|
|
|
|
| PEO Total Compensation Amount |
|
$ 2,884,957
|
|
|
|
|
| PEO Actually Paid Compensation Amount |
|
$ 1,338,101
|
|
|
|
|
| Adjustment To PEO Compensation, Footnote |
|
| | | | | | | | | | | | PEO 1 (MR. McKINNEY) | | FISCAL YEAR | | | 2025 | | Summary Compensation Table Total | | | $ | 2,884,957 | | | - Grant Date Fair Value of Option Awards and Stock Awards Granted in Fiscal Year | | | (1,473,306) | | | + Fair Value at Fiscal Year-End of Outstanding and Unvested Option Awards and Stock Awards Granted in Fiscal Year | | | 1,048,092 | | | + Change in Fair Value of Outstanding and Unvested Option Awards and Stock Awards Granted in Prior Fiscal Years | | | (722,276) | | | + Fair Value at Vesting of Option Awards and Stock Awards Granted in Fiscal Year That Vested During Fiscal Year | | | — | | | + Change in Fair Value as of Vesting Date of Option Awards and Stock Awards Granted in Prior Fiscal Years For Which Applicable Vesting Conditions Were Satisfied During Fiscal Year | | | (399,366) | | | - Fair Value as of Prior Fiscal Year-End of Option Awards and Stock Awards Granted in Prior Fiscal Years That Failed to Meet Applicable Vesting Conditions During Fiscal Year | | | — | | | Compensation Actually Paid | | | $ | 1,338,101 | |
|
|
|
|
|
| Non-PEO NEO Average Total Compensation Amount |
|
$ 1,331,789
|
$ 919,180
|
$ 1,189,765
|
$ 1,260,139
|
$ 934,244
|
| Non-PEO NEO Average Compensation Actually Paid Amount |
|
$ 965,311
|
484,003
|
627,525
|
1,183,597
|
1,158,645
|
| Adjustment to Non-PEO NEO Compensation Footnote |
|
| | | | | | | | | | | | NON-PEO NEOs | | FISCAL YEAR | | | 2025 | | Summary Compensation Table Total | | | $ | 1,331,789 | | | - Grant Date Fair Value of Option Awards and Stock Awards Granted in Fiscal Year | | | (507,003) | | | + Fair Value at Fiscal Year-End of Outstanding and Unvested Option Awards and Stock Awards Granted in Fiscal Year | | | 168,851 | | | + Change in Fair Value of Outstanding and Unvested Option Awards and Stock Awards Granted in Prior Fiscal Years | | | (57,769) | | | + Fair Value at Vesting of Option Awards and Stock Awards Granted in Fiscal Year That Vested During Fiscal Year | | | 86,086 | | | + Change in Fair Value as of Vesting Date of Option Awards and Stock Awards Granted in Prior Fiscal Years For Which Applicable Vesting Conditions Were Satisfied During Fiscal Year | | | (56,643) | | | - Fair Value as of Prior Fiscal Year-End of Option Awards and Stock Awards Granted in Prior Fiscal Years That Failed to Meet Applicable Vesting Conditions During Fiscal Year | | | — | | | Compensation Actually Paid | | | $ | 965,311 | |
|
|
|
|
|
| Compensation Actually Paid vs. Total Shareholder Return |
|
|
|
|
|
|
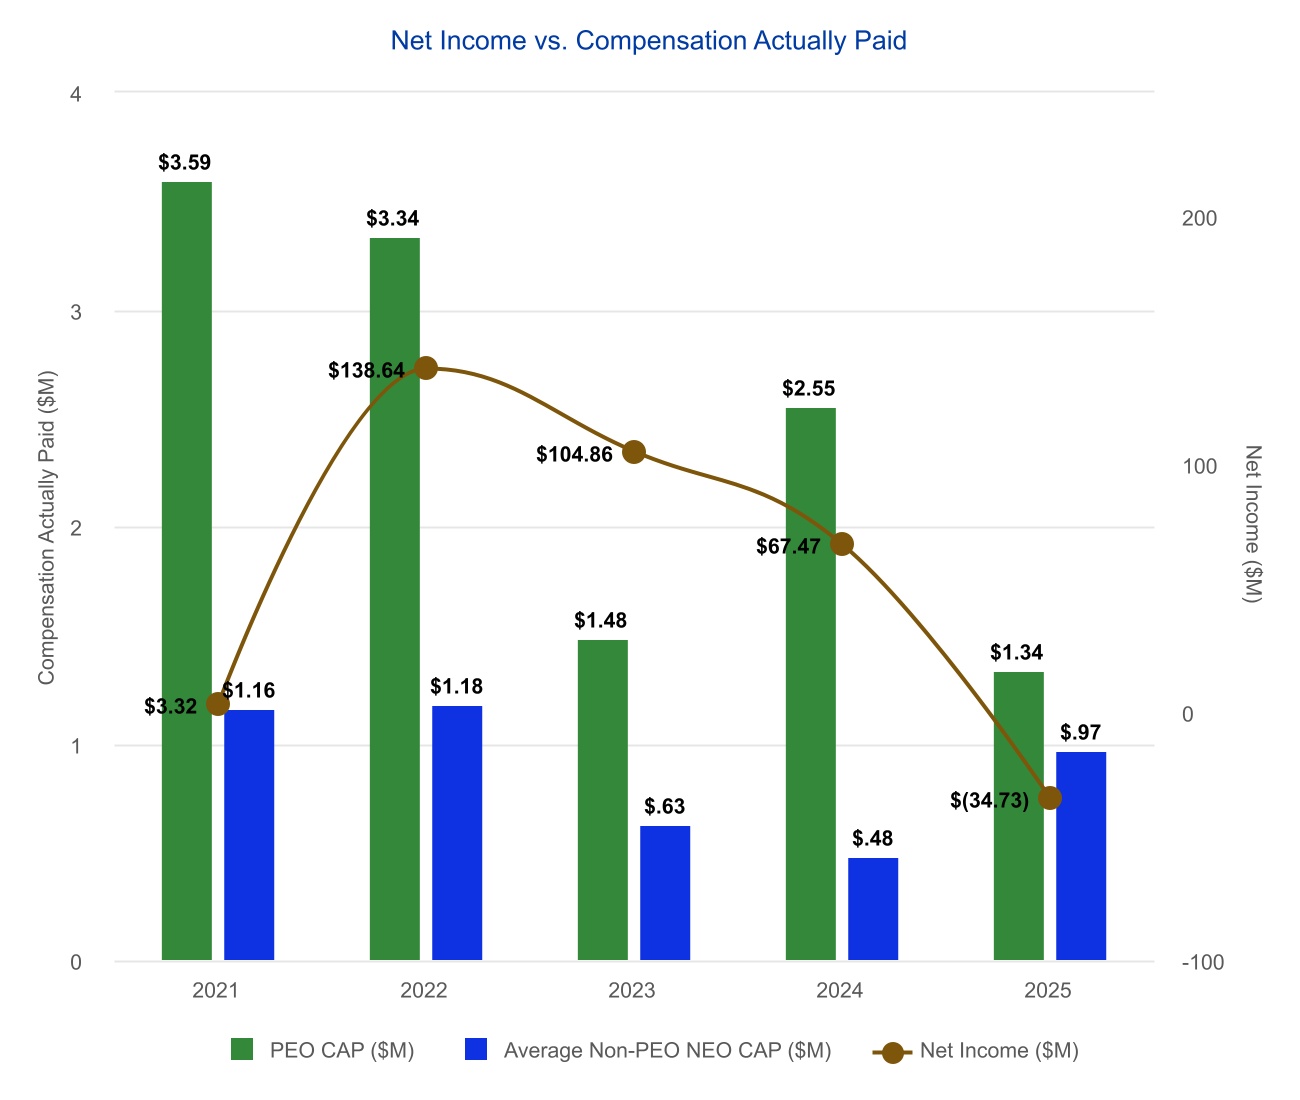
| Compensation Actually Paid vs. Net Income |
|
|
|
|
|
|
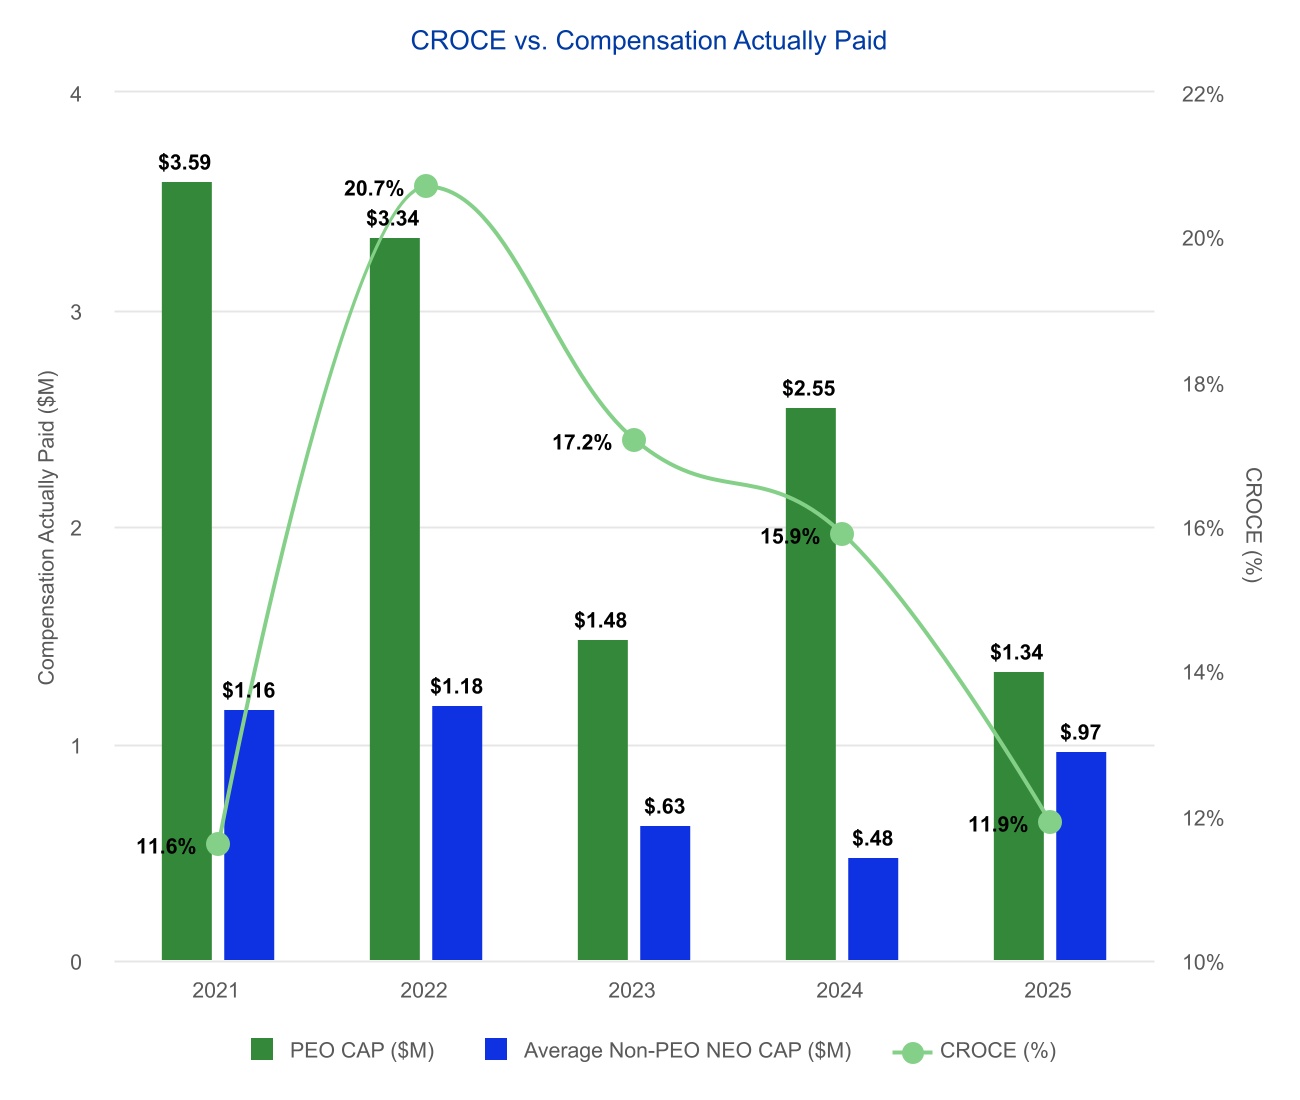
| Compensation Actually Paid vs. Company Selected Measure |
|
|
|
|
|
|
| Tabular List, Table |
|
| | | | | | | TOTAL SHAREHOLDER RETURN (TSR) | NET BOE PRODUCTION (SALES) | CASH RETURN ON CAPITAL EMPLOYED (CROCE) | NET LIFTING COSTS | | | | |
|
|
|
|
|
| Total Shareholder Return Amount |
|
$ 131.84
|
206.09
|
221.25
|
372.78
|
345.51
|
| Peer Group Total Shareholder Return Amount |
|
246.96
|
251.80
|
253.58
|
244.21
|
167.58
|
| Net Income (Loss) |
|
$ (34,731,199)
|
$ 67,470,314
|
$ 104,864,641
|
$ 138,635,025
|
$ 3,322,892
|
| Company Selected Measure Amount |
|
0.119
|
0.159
|
0.172
|
0.207
|
0.116
|
| PEO Name |
Paul D. McKinney
|
Paul D. McKinney
|
Paul D. McKinney
|
Paul D. McKinney
|
Paul D. McKinney
|
|
| Additional 402(v) Disclosure |
|
The dollar amounts reported in this column represent the amount of “Compensation Actually Paid” to Mr. McKinney as computed in accordance with Item 402(v) of Regulation S-K. The dollar amounts do not reflect the actual amount of compensation earned by or paid to Mr. McKinney during the applicable year. In accordance with the requirements of Item 402(v) of Regulation S-K, the following adjustments were made to Mr. McKinney’s total compensation for 2025 to determine the compensation actually paid:The non-PEO NEOs included in this column are: | | | | | | | YEAR | NON-PEO NEOs | | 2025 | Travis T. Thomas, Rocky P. Kwon, Alexander Dyes, James J. Parr, and Phillip B. Feiner | | 2024 | Travis T. Thomas, Marinos C. Baghdati, Stephen D. Brooks, Alexander Dyes, Phillip B. Feiner, and Shawn Young | | 2023 | Travis T. Thomas, Marinos C. Baghdati, Stephen D. Brooks and Alexander Dyes | | 2022 | Travis T. Thomas, Marinos C. Baghdati, Stephen D. Brooks and Alexander Dyes | | 2021 | Travis T. Thomas, Marinos C. Baghdati, Stephen D. Brooks, Alexander Dyes and William D. Broaddrick |
|
|
|
|
|
| Measure:: 1 |
|
|
|
|
|
|
| Pay vs Performance Disclosure |
|
|
|
|
|
|
| Name |
|
TOTAL SHAREHOLDER RETURN (TSR)
|
|
|
|
|
| Measure:: 2 |
|
|
|
|
|
|
| Pay vs Performance Disclosure |
|
|
|
|
|
|
| Name |
|
CASH RETURN ON CAPITAL EMPLOYED (CROCE)
|
|
|
|
|
| Non-GAAP Measure Description |
|
The Company calculates “CROCE,” or Cash Return on Capital Employed, by dividing the Company's net cash provided by operating activities from its Statements of Cash Flows, excluding changes in working capital (referred to as Adjusted Cash Flows From Operations, or "ACFFO"), by the Company's average total debt and stockholders' equity for each calendar year, with average total debt and stockholders' equity being based on the simple average of such values as of the first and last day of the applicable calendar year. See Appendix A for additional information regarding non-GAAP financial measures, including a reconciliation of non-GAAP financial measures to the nearest comparable GAAP financial measures.
|
|
|
|
|
| Measure:: 3 |
|
|
|
|
|
|
| Pay vs Performance Disclosure |
|
|
|
|
|
|
| Name |
|
NET BOE PRODUCTION (SALES)
|
|
|
|
|
| Measure:: 4 |
|
|
|
|
|
|
| Pay vs Performance Disclosure |
|
|
|
|
|
|
| Name |
|
NET LIFTING COSTS
|
|
|
|
|
| Paul D. McKinney [Member] |
|
|
|
|
|
|
| Pay vs Performance Disclosure |
|
|
|
|
|
|
| PEO Total Compensation Amount |
|
$ 2,884,957
|
$ 3,403,046
|
$ 3,762,729
|
$ 3,718,193
|
$ 3,493,117
|
| PEO Actually Paid Compensation Amount |
|
1,338,101
|
$ 2,548,311
|
$ 1,481,896
|
$ 3,338,519
|
$ 3,586,781
|
| PEO | Aggregate Grant Date Fair Value of Equity Award Amounts Reported in Summary Compensation Table |
|
|
|
|
|
|
| Pay vs Performance Disclosure |
|
|
|
|
|
|
| Adjustment to Compensation, Amount |
|
(1,473,306)
|
|
|
|
|
| PEO | Year-end Fair Value of Equity Awards Granted in Covered Year that are Outstanding and Unvested |
|
|
|
|
|
|
| Pay vs Performance Disclosure |
|
|
|
|
|
|
| Adjustment to Compensation, Amount |
|
1,048,092
|
|
|
|
|
| PEO | Year-over-Year Change in Fair Value of Equity Awards Granted in Prior Years That are Outstanding and Unvested |
|
|
|
|
|
|
| Pay vs Performance Disclosure |
|
|
|
|
|
|
| Adjustment to Compensation, Amount |
|
(722,276)
|
|
|
|
|
| PEO | Vesting Date Fair Value of Equity Awards Granted and Vested in Covered Year |
|
|
|
|
|
|
| Pay vs Performance Disclosure |
|
|
|
|
|
|
| Adjustment to Compensation, Amount |
|
0
|
|
|
|
|
| PEO | Change in Fair Value as of Vesting Date of Prior Year Equity Awards Vested in Covered Year |
|
|
|
|
|
|
| Pay vs Performance Disclosure |
|
|
|
|
|
|
| Adjustment to Compensation, Amount |
|
(399,366)
|
|
|
|
|
| PEO | Prior Year End Fair Value of Equity Awards Granted in Any Prior Year that Fail to Meet Applicable Vesting Conditions During Covered Year |
|
|
|
|
|
|
| Pay vs Performance Disclosure |
|
|
|
|
|
|
| Adjustment to Compensation, Amount |
|
0
|
|
|
|
|
| Non-PEO NEO | Aggregate Grant Date Fair Value of Equity Award Amounts Reported in Summary Compensation Table |
|
|
|
|
|
|
| Pay vs Performance Disclosure |
|
|
|
|
|
|
| Adjustment to Compensation, Amount |
|
(507,003)
|
|
|
|
|
| Non-PEO NEO | Year-end Fair Value of Equity Awards Granted in Covered Year that are Outstanding and Unvested |
|
|
|
|
|
|
| Pay vs Performance Disclosure |
|
|
|
|
|
|
| Adjustment to Compensation, Amount |
|
168,851
|
|
|
|
|
| Non-PEO NEO | Year-over-Year Change in Fair Value of Equity Awards Granted in Prior Years That are Outstanding and Unvested |
|
|
|
|
|
|
| Pay vs Performance Disclosure |
|
|
|
|
|
|
| Adjustment to Compensation, Amount |
|
(57,769)
|
|
|
|
|
| Non-PEO NEO | Vesting Date Fair Value of Equity Awards Granted and Vested in Covered Year |
|
|
|
|
|
|
| Pay vs Performance Disclosure |
|
|
|
|
|
|
| Adjustment to Compensation, Amount |
|
86,086
|
|
|
|
|
| Non-PEO NEO | Change in Fair Value as of Vesting Date of Prior Year Equity Awards Vested in Covered Year |
|
|
|
|
|
|
| Pay vs Performance Disclosure |
|
|
|
|
|
|
| Adjustment to Compensation, Amount |
|
(56,643)
|
|
|
|
|
| Non-PEO NEO | Prior Year End Fair Value of Equity Awards Granted in Any Prior Year that Fail to Meet Applicable Vesting Conditions During Covered Year |
|
|
|
|
|
|
| Pay vs Performance Disclosure |
|
|
|
|
|
|
| Adjustment to Compensation, Amount |
|
$ 0
|
|
|
|
|