Pay Versus Performance Disclosure
The table below shows the following information for the past five fiscal years: (i) “total” compensation for our named executive officers (“NEOs”) for purposes of the “Summary compensation table”; (ii) the “Compensation actually paid” to named executive officers (calculated using rules required by the SEC); (iii) our total shareholder return (“TSR”); (iv) the TSR of the S&P U.S. BMI Banks Index; (v) our net income; and (vi) our return on average tangible common equity. “Compensation actually paid” does not represent the value of cash and shares of the Company’s common stock received by named executive officers during the year, but rather is an amount calculated under SEC rules and includes, among other things, year-over-year changes in the value of unvested equity-based awards. As a result of the calculation methodology required by the SEC, “Compensation actually paid” amounts below differ from compensation actually received by the individuals.
| | | Average | | | | | | Return on | |||||||||||||
“Summary | “Summary | Average | average | |||||||||||||||||||
compensation | Compensation | compensation | compensation | tangible | ||||||||||||||||||
table” total for | actually paid to | table” total for | actually paid to | Company | Peer group | Net income | common | |||||||||||||||
Year | CEO(1) | CEO(2) | other NEOs(1) | other NEOs(2) | TSR(3) | TSR(3) | (in thousands) | equity(4) | ||||||||||||||
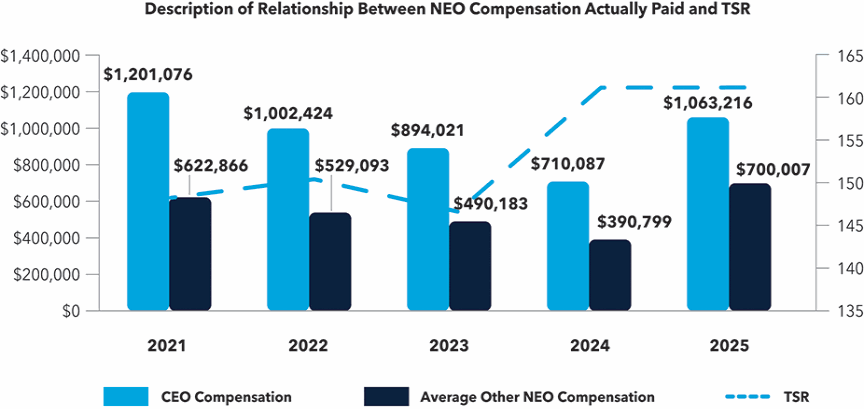
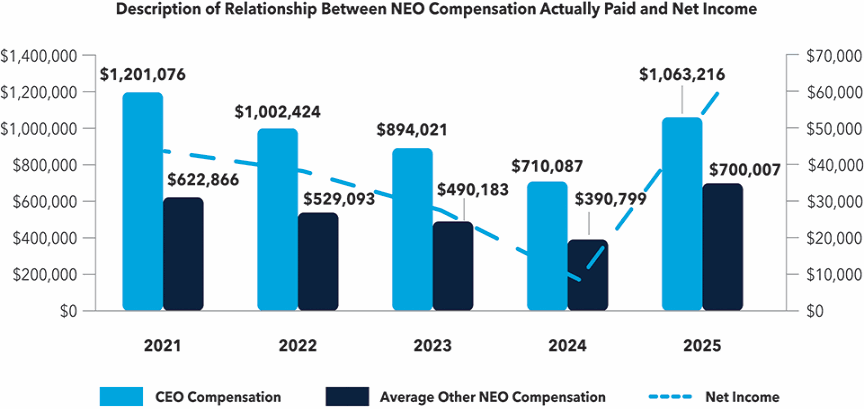
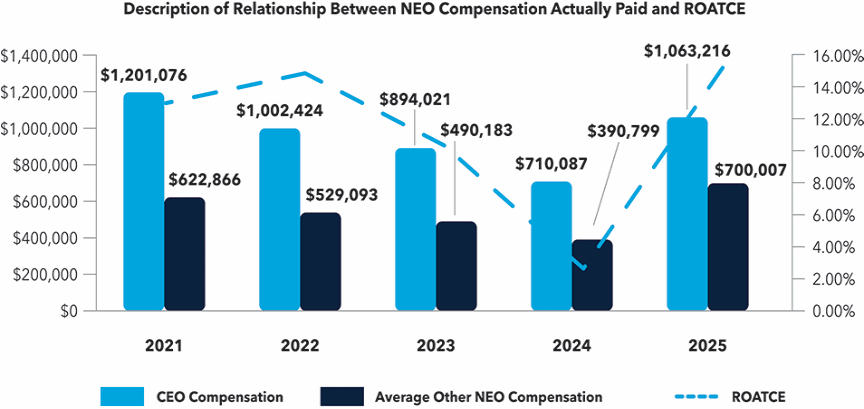
2025 | $ | 1,068,323 | $ | 1,063,216 | $ | 703,410 | $ | 700,007 | 161.09 | 211.47 | $ | 59,187 | 15.14 | % | ||||||||
2024 | $ | 924,318 | $ | 710,087 | $ | 443,009 | $ | 390,799 |
| 161.07 |
| 164.70 | $ | 8,498 |
| 2.63 | % | |||||
2023 | $ | 927,073 | $ | 894,021 | $ | 517,313 | $ | 490,183 |
| 146.59 |
| 123.02 | $ | 27,380 |
| 10.30 | % | |||||
2022 | $ | 992,140 | $ | 1,002,424 | $ | 537,708 | $ | 529,093 |
| 150.37 |
| 112.77 | $ | 38,090 |
| 14.80 | % | |||||
2021 | $ | 1,009,089 | $ | 1,201,076 | $ | 587,389 | $ | 622,866 |
| 148.20 |
| 135.97 | $ | 43,519 |
| 12.94 | % | |||||
| (1) | The CEO for 2025 was Gerard A. Champi. The CEO for 2021 to 2024 was Craig W. Best. The other named executive officers, or NEOs, for 2025 were: Thomas P. Tulaney, Jeffrey A. Drobins, Timothy H. Kirtley, James M. Bone, Jr., CPA and John R. Anderson III. The other NEOs for 2021 to 2024 were: Thomas P. Tulaney, Neal D. Koplin, Timothy H. Kirtley and John R. Anderson III. |
| (2) | SEC rules require certain adjustments be made to the “Summary compensation table” totals to determine “compensation actually paid” as reported in the “Pay versus performance table” above. The following table details the applicable adjustments that were made to determine “compensation actually paid” (all amounts are averages for the named executive officers other than the CEO): |
| | | | | | Add year- | | Change in | | Change in | | Deduct value | | ||||||||||||||||
end value of | value of | value of equity | of equity | ||||||||||||||||||||||||||
unvested | unvested | awards | awards | ||||||||||||||||||||||||||
Deduct | Add | equity | equity | granted in | granted in | ||||||||||||||||||||||||
“Summary | change in | pension | Deduct | awards | awards | prior years | prior years | ||||||||||||||||||||||
compensation | pension | services | stock | granted in | granted in | which vested in | that failed to | Add | |||||||||||||||||||||
Year | Executive(s) | table” total | value | costs | awards | year | prior years | year | vest | dividends | |||||||||||||||||||
2025 | CEO | $ | 1,068,323 | $ | (112,500) | $ | 112,500 | $ | (162,400) | 162,401 | (4,802) | (306) | — | — | |||||||||||||||
Other NEOs | $ | 703,410 | $ | (30,052) | $ | 26,444 | $ | (237,130) | 226,351 | (1,552) | 12,536 | — | — | ||||||||||||||||
2024 | CEO | $ | 924,318 | $ | — | $ | — | $ | (49,609) | $ | 63,003 | $ | 72,280 | $ | (5,273) | $ | (299,408) | $ | 4,776 | ||||||||||
Other NEOs | $ | 443,009 | $ | (26,637) | $ | (38,302) | $ | (21,843) | $ | 27,740 | $ | 31,760 | $ | (2,226) | $ | (24,788) | $ | 2,086 | |||||||||||
2023 | CEO | $ | 927,073 | $ | (6,996) | $ | — | $ | (223,175) | $ | 248,711 | $ | (14,394) | $ | (15,868) | $ | (24,883) | $ | 3,553 | ||||||||||
Other NEOs | $ | 517,313 | $ | (66,964) | $ | 50,329 | $ | (96,684) | $ | 107,737 | $ | (6,206) | $ | (6,569) | $ | (10,290) | $ | 1,518 | |||||||||||
2022 | CEO | $ | 992,140 | $ | — | $ | — | $ | (217,333) | $ | 235,405 | $ | (4,312) | $ | (6,823) | $ | — | $ | 3,347 | ||||||||||
| Other NEOs | $ | 537,708 | $ | (60,394) | $ | 47,076 | $ | (94,081) | $ | 101,904 | $ | (1,778) | $ | (2,734) |
| $ | — | $ | 1,393 | |||||||||
2021 |
| CEO | $ | 1,009,089 | $ | — | $ | — | $ | (217,311) | $ | 269,351 | $ | 73,039 | $ | 63,721 |
| $ | — |
| $ | 3,187 | |||||||
| Other NEOs | $ | 587,389 | $ | (111,305) | $ | 70,743 | $ | (89,845) | $ | 111,360 | $ | 29,005 | $ | 24,260 |
| $ | — | $ | 1,258 | |||||||||
| (3) | TSR is determined based on the value of an initial fixed investment of $100 on December 31, 2020. The peer group TSR represents TSR of the S&P U.S. BMI Banks Index. |
| (4) | Return on average tangible common equity (ROATCE), a non-GAAP measure, is equal to net income divided by the difference of average stockholders’ equity minus average intangible assets. |
| | | Average | | | | | | Return on | |||||||||||||
“Summary | “Summary | Average | average | |||||||||||||||||||
compensation | Compensation | compensation | compensation | tangible | ||||||||||||||||||
table” total for | actually paid to | table” total for | actually paid to | Company | Peer group | Net income | common | |||||||||||||||
Year | CEO(1) | CEO(2) | other NEOs(1) | other NEOs(2) | TSR(3) | TSR(3) | (in thousands) | equity(4) | ||||||||||||||
2025 | $ | 1,068,323 | $ | 1,063,216 | $ | 703,410 | $ | 700,007 | 161.09 | 211.47 | $ | 59,187 | 15.14 | % | ||||||||
2024 | $ | 924,318 | $ | 710,087 | $ | 443,009 | $ | 390,799 |
| 161.07 |
| 164.70 | $ | 8,498 |
| 2.63 | % | |||||
2023 | $ | 927,073 | $ | 894,021 | $ | 517,313 | $ | 490,183 |
| 146.59 |
| 123.02 | $ | 27,380 |
| 10.30 | % | |||||
2022 | $ | 992,140 | $ | 1,002,424 | $ | 537,708 | $ | 529,093 |
| 150.37 |
| 112.77 | $ | 38,090 |
| 14.80 | % | |||||
2021 | $ | 1,009,089 | $ | 1,201,076 | $ | 587,389 | $ | 622,866 |
| 148.20 |
| 135.97 | $ | 43,519 |
| 12.94 | % | |||||
| (1) | The CEO for 2025 was Gerard A. Champi. The CEO for 2021 to 2024 was Craig W. Best. The other named executive officers, or NEOs, for 2025 were: Thomas P. Tulaney, Jeffrey A. Drobins, Timothy H. Kirtley, James M. Bone, Jr., CPA and John R. Anderson III. The other NEOs for 2021 to 2024 were: Thomas P. Tulaney, Neal D. Koplin, Timothy H. Kirtley and John R. Anderson III. |
| | | | | | Add year- | | Change in | | Change in | | Deduct value | | ||||||||||||||||
end value of | value of | value of equity | of equity | ||||||||||||||||||||||||||
unvested | unvested | awards | awards | ||||||||||||||||||||||||||
Deduct | Add | equity | equity | granted in | granted in | ||||||||||||||||||||||||
“Summary | change in | pension | Deduct | awards | awards | prior years | prior years | ||||||||||||||||||||||
compensation | pension | services | stock | granted in | granted in | which vested in | that failed to | Add | |||||||||||||||||||||
Year | Executive(s) | table” total | value | costs | awards | year | prior years | year | vest | dividends | |||||||||||||||||||
2025 | CEO | $ | 1,068,323 | $ | (112,500) | $ | 112,500 | $ | (162,400) | 162,401 | (4,802) | (306) | — | — | |||||||||||||||
Other NEOs | $ | 703,410 | $ | (30,052) | $ | 26,444 | $ | (237,130) | 226,351 | (1,552) | 12,536 | — | — | ||||||||||||||||
2024 | CEO | $ | 924,318 | $ | — | $ | — | $ | (49,609) | $ | 63,003 | $ | 72,280 | $ | (5,273) | $ | (299,408) | $ | 4,776 | ||||||||||
Other NEOs | $ | 443,009 | $ | (26,637) | $ | (38,302) | $ | (21,843) | $ | 27,740 | $ | 31,760 | $ | (2,226) | $ | (24,788) | $ | 2,086 | |||||||||||
2023 | CEO | $ | 927,073 | $ | (6,996) | $ | — | $ | (223,175) | $ | 248,711 | $ | (14,394) | $ | (15,868) | $ | (24,883) | $ | 3,553 | ||||||||||
Other NEOs | $ | 517,313 | $ | (66,964) | $ | 50,329 | $ | (96,684) | $ | 107,737 | $ | (6,206) | $ | (6,569) | $ | (10,290) | $ | 1,518 | |||||||||||
2022 | CEO | $ | 992,140 | $ | — | $ | — | $ | (217,333) | $ | 235,405 | $ | (4,312) | $ | (6,823) | $ | — | $ | 3,347 | ||||||||||
| Other NEOs | $ | 537,708 | $ | (60,394) | $ | 47,076 | $ | (94,081) | $ | 101,904 | $ | (1,778) | $ | (2,734) |
| $ | — | $ | 1,393 | |||||||||
2021 |
| CEO | $ | 1,009,089 | $ | — | $ | — | $ | (217,311) | $ | 269,351 | $ | 73,039 | $ | 63,721 |
| $ | — |
| $ | 3,187 | |||||||
| Other NEOs | $ | 587,389 | $ | (111,305) | $ | 70,743 | $ | (89,845) | $ | 111,360 | $ | 29,005 | $ | 24,260 |
| $ | — | $ | 1,258 | |||||||||
| (2) | SEC rules require certain adjustments be made to the “Summary compensation table” totals to determine “compensation actually paid” as reported in the “Pay versus performance table” above. The following table details the applicable adjustments that were made to determine “compensation actually paid” (all amounts are averages for the named executive officers other than the CEO): |
| | | | | | Add year- | | Change in | | Change in | | Deduct value | | ||||||||||||||||
end value of | value of | value of equity | of equity | ||||||||||||||||||||||||||
unvested | unvested | awards | awards | ||||||||||||||||||||||||||
Deduct | Add | equity | equity | granted in | granted in | ||||||||||||||||||||||||
“Summary | change in | pension | Deduct | awards | awards | prior years | prior years | ||||||||||||||||||||||
compensation | pension | services | stock | granted in | granted in | which vested in | that failed to | Add | |||||||||||||||||||||
Year | Executive(s) | table” total | value | costs | awards | year | prior years | year | vest | dividends | |||||||||||||||||||
2025 | CEO | $ | 1,068,323 | $ | (112,500) | $ | 112,500 | $ | (162,400) | 162,401 | (4,802) | (306) | — | — | |||||||||||||||
Other NEOs | $ | 703,410 | $ | (30,052) | $ | 26,444 | $ | (237,130) | 226,351 | (1,552) | 12,536 | — | — | ||||||||||||||||
2024 | CEO | $ | 924,318 | $ | — | $ | — | $ | (49,609) | $ | 63,003 | $ | 72,280 | $ | (5,273) | $ | (299,408) | $ | 4,776 | ||||||||||
Other NEOs | $ | 443,009 | $ | (26,637) | $ | (38,302) | $ | (21,843) | $ | 27,740 | $ | 31,760 | $ | (2,226) | $ | (24,788) | $ | 2,086 | |||||||||||
2023 | CEO | $ | 927,073 | $ | (6,996) | $ | — | $ | (223,175) | $ | 248,711 | $ | (14,394) | $ | (15,868) | $ | (24,883) | $ | 3,553 | ||||||||||
Other NEOs | $ | 517,313 | $ | (66,964) | $ | 50,329 | $ | (96,684) | $ | 107,737 | $ | (6,206) | $ | (6,569) | $ | (10,290) | $ | 1,518 | |||||||||||
2022 | CEO | $ | 992,140 | $ | — | $ | — | $ | (217,333) | $ | 235,405 | $ | (4,312) | $ | (6,823) | $ | — | $ | 3,347 | ||||||||||
| Other NEOs | $ | 537,708 | $ | (60,394) | $ | 47,076 | $ | (94,081) | $ | 101,904 | $ | (1,778) | $ | (2,734) |
| $ | — | $ | 1,393 | |||||||||
2021 |
| CEO | $ | 1,009,089 | $ | — | $ | — | $ | (217,311) | $ | 269,351 | $ | 73,039 | $ | 63,721 |
| $ | — |
| $ | 3,187 | |||||||
| Other NEOs | $ | 587,389 | $ | (111,305) | $ | 70,743 | $ | (89,845) | $ | 111,360 | $ | 29,005 | $ | 24,260 |
| $ | — | $ | 1,258 | |||||||||
Company’s Most Important Financial Performance Measures
The following were the most important financial performance measures, as determined by the Company, that link compensation actually paid to our CEO and other NEOs to the Company’s performance for the most recently completed fiscal year.
Net income | Net loan growth |
Non-interest deposit growth | Non-interest income |
Asset quality |
Each of these financial performance measures has been used in our incentive programs to determine the level of payout. For more information on each of these performance measures, see “2025 Annual Scorecard and Results” beginning on page 59.
| (4) | Return on average tangible common equity (ROATCE), a non-GAAP measure, is equal to net income divided by the difference of average stockholders’ equity minus average intangible assets. |