Pay vs Performance Disclosure - USD ($)
Dec. 31, 2025
Dec. 31, 2024
Dec. 31, 2023
Dec. 31, 2022
Dec. 31, 2021
Pay Versus Performance
This section provides disclosure about the relationship between executive compensation actually paid to our principal executive officer (CEO) and
non-CEO
NEOs and certain financial performance measures of the company for the years listed below. This disclosure has been prepared in accordance with Item 402(v) of Regulation S-K
under the Exchange Act (the “Pay Versus Performance Rules”) and does not necessarily reflect how the human capital management and compensation committee evaluates compensation decisions. | YEAR (1) |
SUMMARY COMPENSATION TABLE TOTAL FOR CEO ($) |
COMPENSATION ACTUALLY PAID TO CEO ($) (2)(3) |
AVERAGE SUMMARY COMPENSATION TABLE TOTAL FOR NON-CEO NEOs ($) |
AVERAGE COMPENSATION ACTUALLY PAID TO NON-CEO NEOs ($) (2)(4) |
VALUE OF INITIAL FIXED $100 INVESTMENT BASED ON: (5) |
NET INCOME (LOSS) ($) (MILLIONS) |
NET REVENUES ($) (MILLIONS) (6) | |||||||||||||||||||||||||||||||||
| TOTAL SHAREHOLDER RETURN ($) |
PEER GROUP TOTAL SHAREHOLDER RETURN ($) | |||||||||||||||||||||||||||||||||||||||
| (a) |
|
(b) |
|
|
(c) |
|
|
(d) |
|
|
(e) |
|
|
(f) |
|
|
(g) |
|
|
(h) |
|
|
(i) |
| ||||||||||||||||
| 2025 |
|
29,846,850 |
|
|
22,039,753 |
|
|
4,738,454 |
|
|
3,465,284 |
|
|
0.66 |
|
|
117.99 |
|
|
219.0 |
|
|
275.5 |
| ||||||||||||||||
| 2024 |
|
5,016,951 |
|
|
301,397 |
|
|
1,912,190 |
|
|
459,570 |
|
|
3.01 |
|
|
122.94 |
|
|
(160.3) |
|
|
326.5 |
| ||||||||||||||||
| 2023 |
|
6,713,337 |
|
|
3,235,433 |
|
|
2,291,354 |
|
|
1,261,801 |
|
|
7.12 |
|
|
116.75 |
|
|
(338.1) |
|
|
343.4 |
| ||||||||||||||||
| 2022 |
|
6,770,871 |
|
|
(6,453,862) |
|
|
2,656,373 |
|
|
(1,184,913) |
|
|
9.85 |
|
|
114.29 |
|
|
(366.1) |
|
|
418.9 |
| ||||||||||||||||
| 2021 |
|
6,572,625 |
|
|
(8,778,700) |
|
|
5,782,695 |
|
|
4,365,316 |
|
|
52.13 |
|
|
115.76 |
|
|
(182.1) |
|
|
464.7 |
| ||||||||||||||||
| (1) |
The following table lists the CEO and non-CEO NEOs for each of years 2025, 2024, 2023, 2022 and 2021: |
| YEAR |
CEO |
NON-CEO NEOS | ||
| 2025 |
Ethan Brown |
Lubi Kutua, Dariush Ajami, PhD, Teri L. Witteman, Drew Lufkin | ||
| 2024 |
Ethan Brown |
Lubi Kutua, Dariush Ajami, PhD, Teri L. Witteman, Jonathan Nelson | ||
| 2023 |
Ethan Brown |
Lubi Kutua, Dariush Ajami, PhD, Jonathan Nelson, Akerho “AK” Oghoghomeh | ||
| 2022 |
Ethan Brown |
Lubi Kutua, Dariush Ajami, PhD, Margaret “Jackie” Trask, Teri L. Witteman, Phil Hardin, Bernie Adcock, Deanna Jurgens | ||
| 2021 |
Ethan Brown |
Phil Hardin, Mark J. Nelson, Gary Schultz, Doug Ramsey, Bernie Adcock, Deanna Jurgens | ||
| (2) |
The dollar amounts reported represent the amount of “compensation actually paid,” as calculated in accordance with the Pay Versus Performance Rules. These dollar amounts do not reflect the actual amounts of compensation earned by or paid to our NEOs during the applicable year. For purposes of calculating “compensation actually paid,” the fair value of equity awards is calculated in accordance with FASB ASC Topic 718 using the same assumption methodologies used to calculate the grant date fair value of awards for purposes of the Summary Compensation Table (refer to “Summary Compensation Table” for additional information). |
| (3) |
The following table shows the amounts deducted from and added to the Summary Compensation Table total to calculate “compensation actually paid” to Mr. Brown in accordance with the Pay Versus Performance Rules: |
| EQUITY AWARD ADJUSTMENTS | ||||||||||||||
| YEAR |
SUMMARY COMPENSATION TABLE TOTAL FOR CEO ($) |
REPORTED VALUE OF EQUITY AWARDS ($) |
YEAR END FAIR VALUE OF EQUITY AWARDS GRANTED IN THE YEAR AND UNVESTED AT YEAR END ($) |
YEAR OVER YEAR CHANGE IN FAIR VALUE OF OUTSTANDING AND UNVESTED EQUITY AWARDS GRANTED IN PRIOR YEARS ($) |
FAIR VALUE AS OF VESTING DATE OF EQUITY AWARDS GRANTED AND VESTED IN THE YEAR ($) |
CHANGE IN FAIR VALUE OF EQUITY AWARDS GRANTED IN PRIOR YEARS THAT VESTED IN THE YEAR ($) |
COMPENSATION ACTUALLY PAID TO CEO ($) | |||||||
| 2025 |
29,846,850 |
(26,701,431) |
16,297,381 |
(768,574) |
3,621,641 |
(256,114) |
22,039,753 | |||||||
| 2024 |
5,016,951 |
(4,500,019) |
1,103,136 |
(1,192,983) |
0 |
(125,688) |
301,397 | |||||||
| 2023 |
6,713,337 |
(5,900,005) |
2,761,081 |
(399,466) |
88,923 |
(28,438) |
3,235,433 | |||||||
| 2022 |
6,770,871 |
(6,255,489) |
1,479,685 |
(4,245,608) |
(351,693) |
(3,851,628) |
(6,453,862) | |||||||
| 2021 |
6,572,625 |
(5,888,273) |
1,939,794 |
(13,048,744) |
830,244 |
815,654 |
(8,778,700) | |||||||
| (4) |
The following table shows the amounts deducted from and added to the average Summary Compensation Table total compensation to calculate the average “compensation actually paid” to our non-CEO NEOs in accordance with the Pay Versus Performance Rules. |
| EQUITY AWARD ADJUSTMENTS | ||||||||||||||
| YEAR |
AVERAGE SUMMARY COMPENSATION TABLE TOTAL FOR NON-CEO NEOS ($) |
AVERAGE REPORTED VALUE OF EQUITY AWARDS ($) |
AVERAGE YEAR END FAIR VALUE OF EQUITY AWARDS GRANTED IN THE YEAR AND UNVESTED AT YEAR END ($) |
AVERAGE YEAR OVER YEAR CHANGE IN FAIR VALUE OF OUTSTANDING AND UNVESTED EQUITY AWARDS GRANTED IN PRIOR YEARS ($) |
AVERAGE FAIR VALUE AS OF VESTING DATE OF EQUITY AWARDS GRANTED AND VESTED IN THE YEAR ($) |
AVERAGE CHANGE IN FAIR VALUE OF EQUITY AWARDS GRANTED IN PRIOR YEARS THAT VESTED IN THE YEAR ($) |
AVERAGE COMPENSATION ACTUALLY PAID TO NON-CEO NEOS ($) | |||||||
| 2025 |
4,738,454 |
(3,778,030) |
2,471,346 |
(289,662) |
409,982 |
(86,805) |
3,465,284 | |||||||
| 2024 |
1,912,190 |
(1,487,378) |
461,265 |
(380,221) |
0 |
(46,286) |
459,570 | |||||||
| 2023 |
2,291,354 |
(1,725,015) |
797,890 |
(101,084) |
12,107 |
(13,451) |
1,261,801 | |||||||
| 2022 |
2,656,373 |
(2,201,026) |
457,139 |
(1,312,497) |
(389,865) |
(395,036) |
(1,184,913) | |||||||
| 2021 |
5,782,695 |
(5,257,003) |
4,693,472 |
(888,213) |
8,903 |
25,461 |
4,365,316 | |||||||
| (5) |
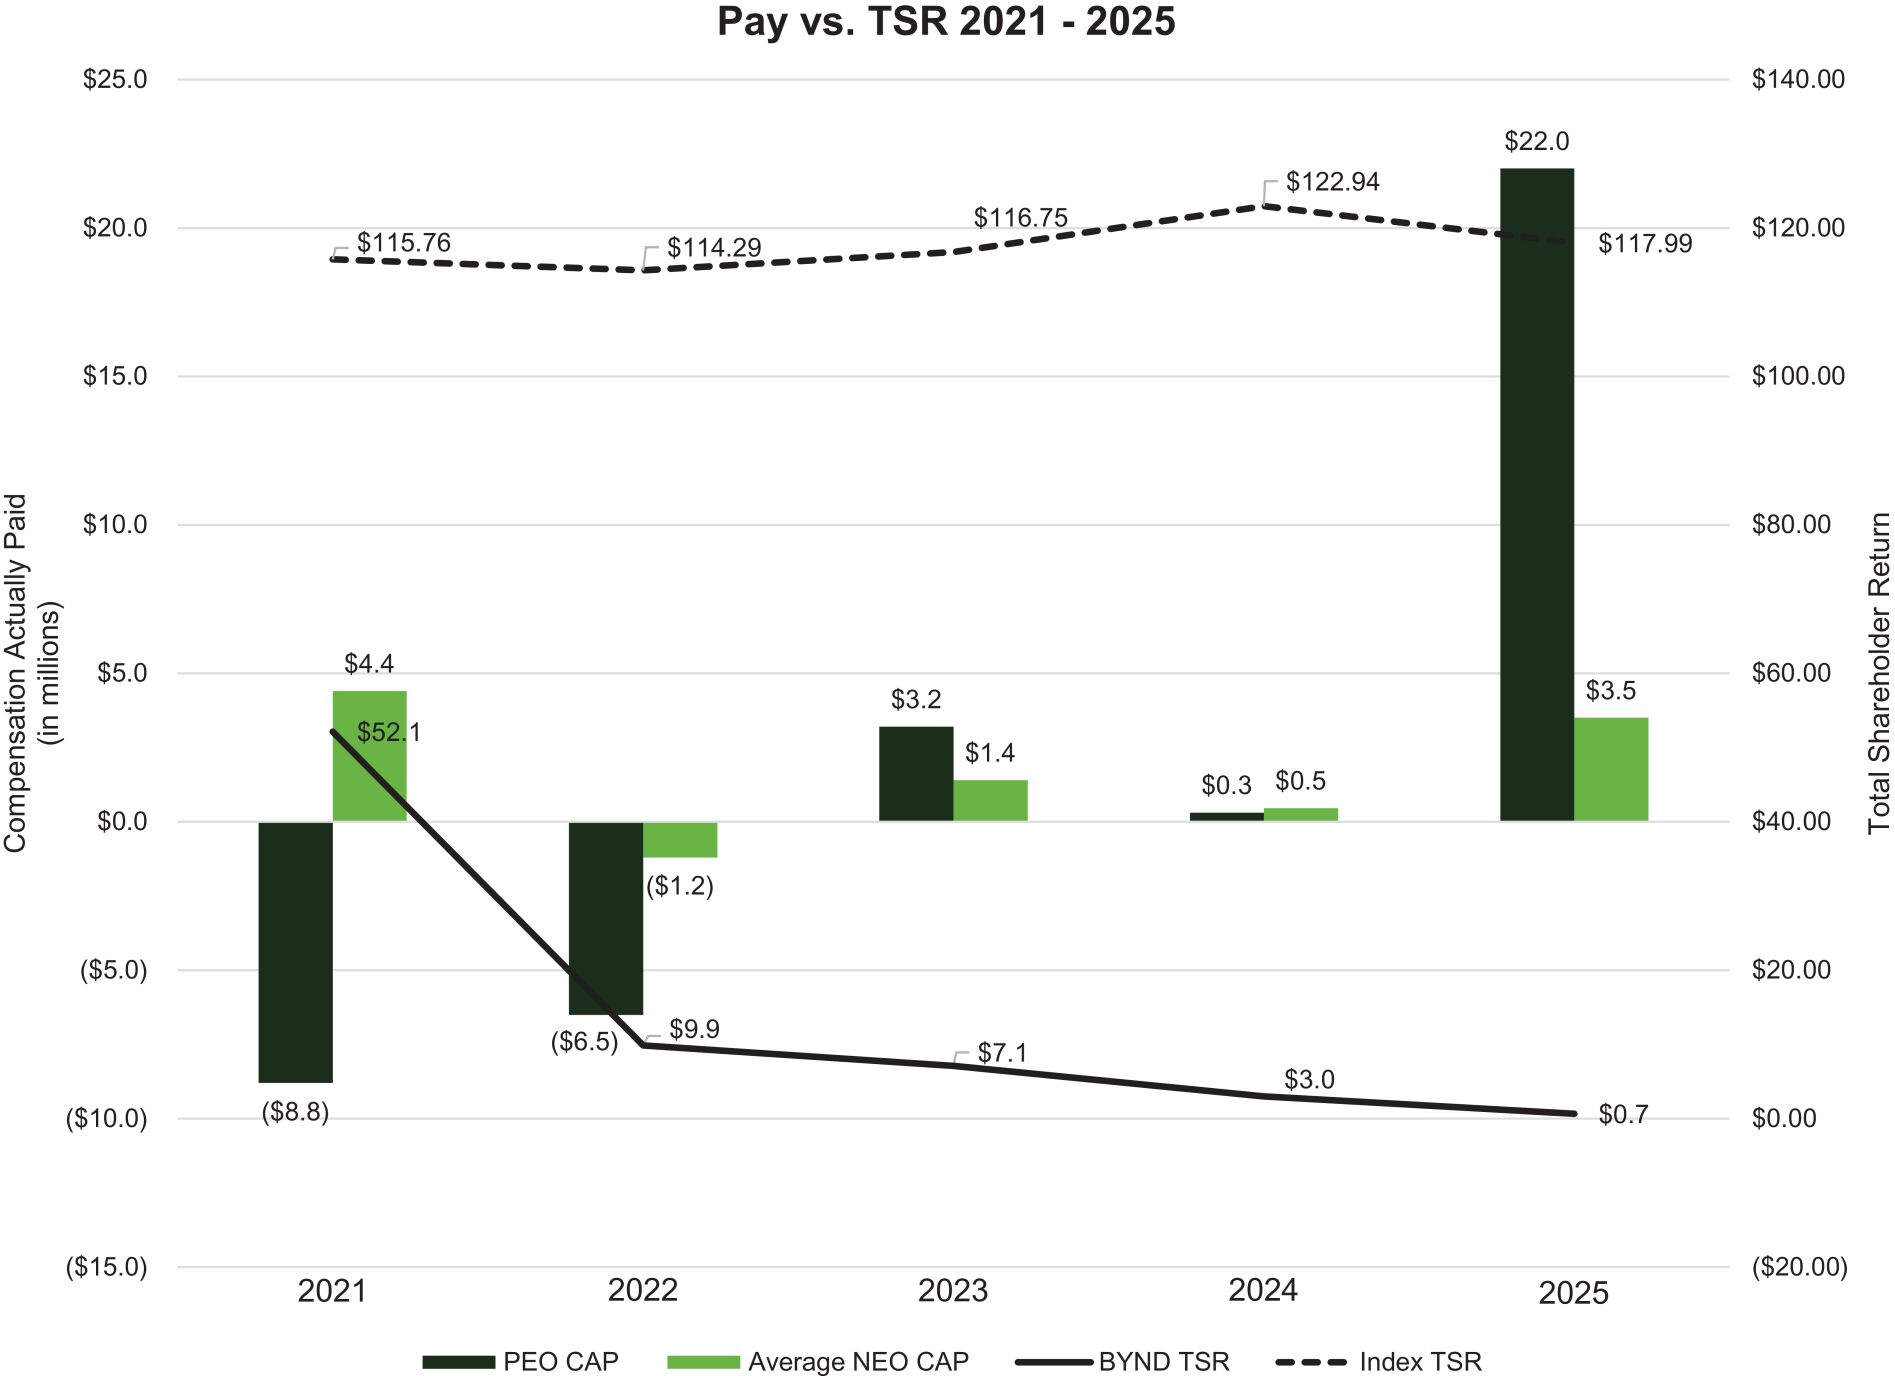
In accordance with the Pay Versus Performance Rules, the company and the company’s peer group total shareholder return (the “Peer Group TSR”) is determined based on the value of an initial fixed investment of $100.00 on December 31, 2020, through the end of the listed year. The Peer Group TSR set forth in this table was determined using the S&P Food and Beverage Select Industry Index, which we also use in preparing the stock performance graph required by Item 201(e) of Regulation S-K under the Exchange Act for our 2025 Form 10-K. |
| (6) |
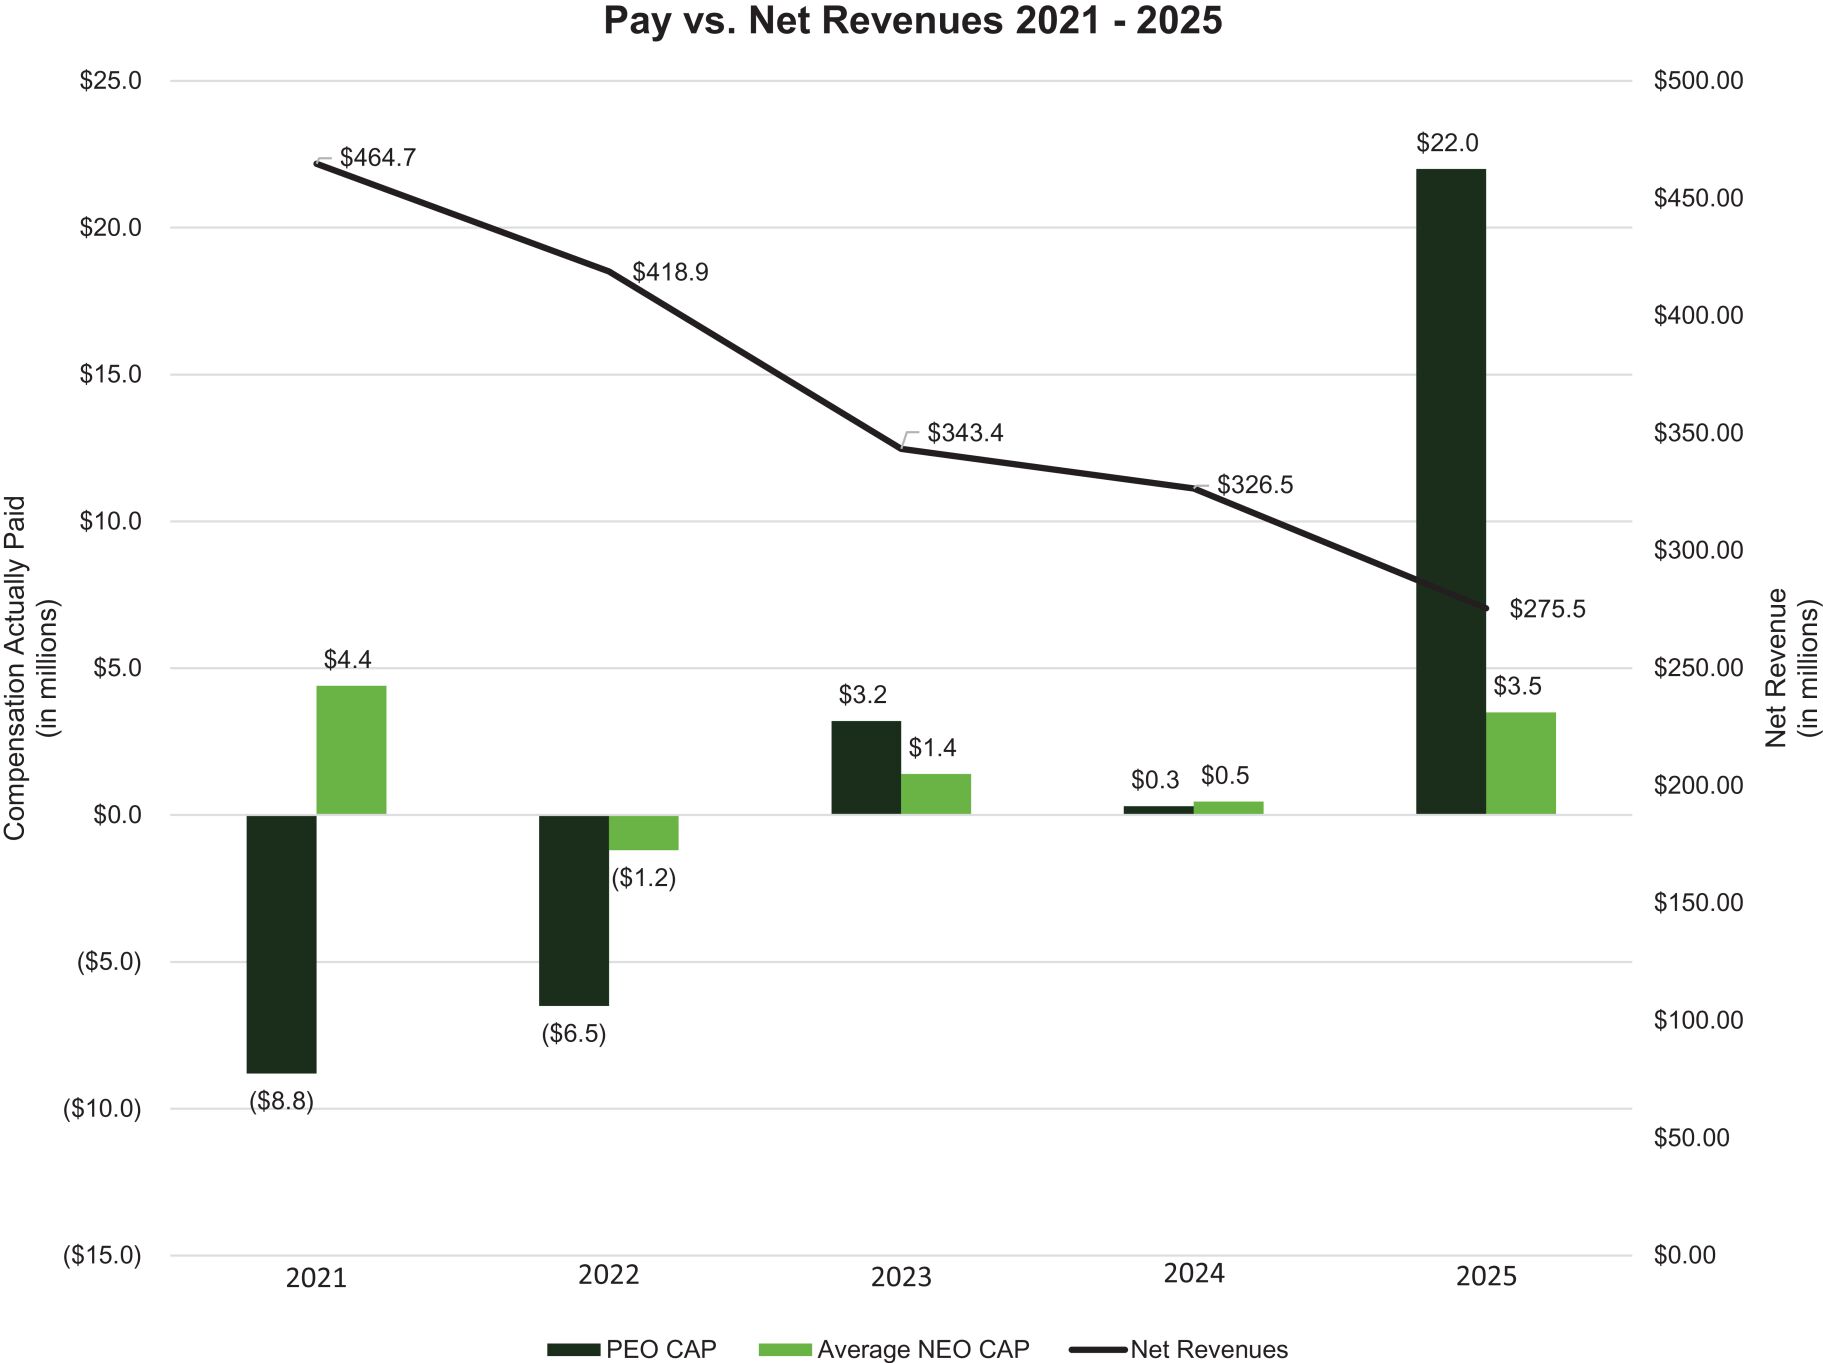
We have determined that net revenues is the financial performance measure that, in the company’s assessment, represents the most important financial performance measure used to link “compensation actually paid” to our NEOs, for 2025, to company performance (the “Company Selected Measure” as defined in the Pay Versus Performance Rules). We generate net revenues primarily from sales of our products to our customers across mainstream grocery, mass merchandiser, club store and natural retailer channels, and various food-away-from-home channels, including restaurants, foodservice outlets and schools, mainly in the United States. We routinely offer sales discounts and promotions through various programs to customers and consumers. These programs include rebates, temporary on-shelf price reductions, off-invoice discounts, retailer advertisements, product coupons and other trade activities. The expense associated with these discounts and promotions is estimated and recorded as a reduction in total gross revenues in order to arrive at reported net revenues. Please refer to our consolidated financial statements and the related notes thereto included in our 2025 Form 10-K for more information. We use net revenues as a financial performance measure in determining annual cash STI payments under the Bonus Plan for our NEOs. Linking NEO compensation to net revenues incentivizes revenue growth and rewards efforts to grow and expand our business. |
| (1) |
The following table lists the CEO and non-CEO NEOs for each of years 2025, 2024, 2023, 2022 and 2021: |
| YEAR |
CEO |
NON-CEO NEOS | ||
| 2025 |
Ethan Brown |
Lubi Kutua, Dariush Ajami, PhD, Teri L. Witteman, Drew Lufkin | ||
| 2024 |
Ethan Brown |
Lubi Kutua, Dariush Ajami, PhD, Teri L. Witteman, Jonathan Nelson | ||
| 2023 |
Ethan Brown |
Lubi Kutua, Dariush Ajami, PhD, Jonathan Nelson, Akerho “AK” Oghoghomeh | ||
| 2022 |
Ethan Brown |
Lubi Kutua, Dariush Ajami, PhD, Margaret “Jackie” Trask, Teri L. Witteman, Phil Hardin, Bernie Adcock, Deanna Jurgens | ||
| 2021 |
Ethan Brown |
Phil Hardin, Mark J. Nelson, Gary Schultz, Doug Ramsey, Bernie Adcock, Deanna Jurgens | ||
S-K
under the Exchange Act for our 2025 Form 10-K.
| (3) |
The following table shows the amounts deducted from and added to the Summary Compensation Table total to calculate “compensation actually paid” to Mr. Brown in accordance with the Pay Versus Performance Rules: |
| EQUITY AWARD ADJUSTMENTS | ||||||||||||||
| YEAR |
SUMMARY COMPENSATION TABLE TOTAL FOR CEO ($) |
REPORTED VALUE OF EQUITY AWARDS ($) |
YEAR END FAIR VALUE OF EQUITY AWARDS GRANTED IN THE YEAR AND UNVESTED AT YEAR END ($) |
YEAR OVER YEAR CHANGE IN FAIR VALUE OF OUTSTANDING AND UNVESTED EQUITY AWARDS GRANTED IN PRIOR YEARS ($) |
FAIR VALUE AS OF VESTING DATE OF EQUITY AWARDS GRANTED AND VESTED IN THE YEAR ($) |
CHANGE IN FAIR VALUE OF EQUITY AWARDS GRANTED IN PRIOR YEARS THAT VESTED IN THE YEAR ($) |
COMPENSATION ACTUALLY PAID TO CEO ($) | |||||||
| 2025 |
29,846,850 |
(26,701,431) |
16,297,381 |
(768,574) |
3,621,641 |
(256,114) |
22,039,753 | |||||||
| 2024 |
5,016,951 |
(4,500,019) |
1,103,136 |
(1,192,983) |
0 |
(125,688) |
301,397 | |||||||
| 2023 |
6,713,337 |
(5,900,005) |
2,761,081 |
(399,466) |
88,923 |
(28,438) |
3,235,433 | |||||||
| 2022 |
6,770,871 |
(6,255,489) |
1,479,685 |
(4,245,608) |
(351,693) |
(3,851,628) |
(6,453,862) | |||||||
| 2021 |
6,572,625 |
(5,888,273) |
1,939,794 |
(13,048,744) |
830,244 |
815,654 |
(8,778,700) | |||||||
| (4) |
The following table shows the amounts deducted from and added to the average Summary Compensation Table total compensation to calculate the average “compensation actually paid” to our non-CEO NEOs in accordance with the Pay Versus Performance Rules. |
| EQUITY AWARD ADJUSTMENTS | ||||||||||||||
| YEAR |
AVERAGE SUMMARY COMPENSATION TABLE TOTAL FOR NON-CEO NEOS ($) |
AVERAGE REPORTED VALUE OF EQUITY AWARDS ($) |
AVERAGE YEAR END FAIR VALUE OF EQUITY AWARDS GRANTED IN THE YEAR AND UNVESTED AT YEAR END ($) |
AVERAGE YEAR OVER YEAR CHANGE IN FAIR VALUE OF OUTSTANDING AND UNVESTED EQUITY AWARDS GRANTED IN PRIOR YEARS ($) |
AVERAGE FAIR VALUE AS OF VESTING DATE OF EQUITY AWARDS GRANTED AND VESTED IN THE YEAR ($) |
AVERAGE CHANGE IN FAIR VALUE OF EQUITY AWARDS GRANTED IN PRIOR YEARS THAT VESTED IN THE YEAR ($) |
AVERAGE COMPENSATION ACTUALLY PAID TO NON-CEO NEOS ($) | |||||||
| 2025 |
4,738,454 |
(3,778,030) |
2,471,346 |
(289,662) |
409,982 |
(86,805) |
3,465,284 | |||||||
| 2024 |
1,912,190 |
(1,487,378) |
461,265 |
(380,221) |
0 |
(46,286) |
459,570 | |||||||
| 2023 |
2,291,354 |
(1,725,015) |
797,890 |
(101,084) |
12,107 |
(13,451) |
1,261,801 | |||||||
| 2022 |
2,656,373 |
(2,201,026) |
457,139 |
(1,312,497) |
(389,865) |
(395,036) |
(1,184,913) | |||||||
| 2021 |
5,782,695 |
(5,257,003) |
4,693,472 |
(888,213) |
8,903 |
25,461 |
4,365,316 | |||||||
Compensation Actually Paid and Cumulative TSR
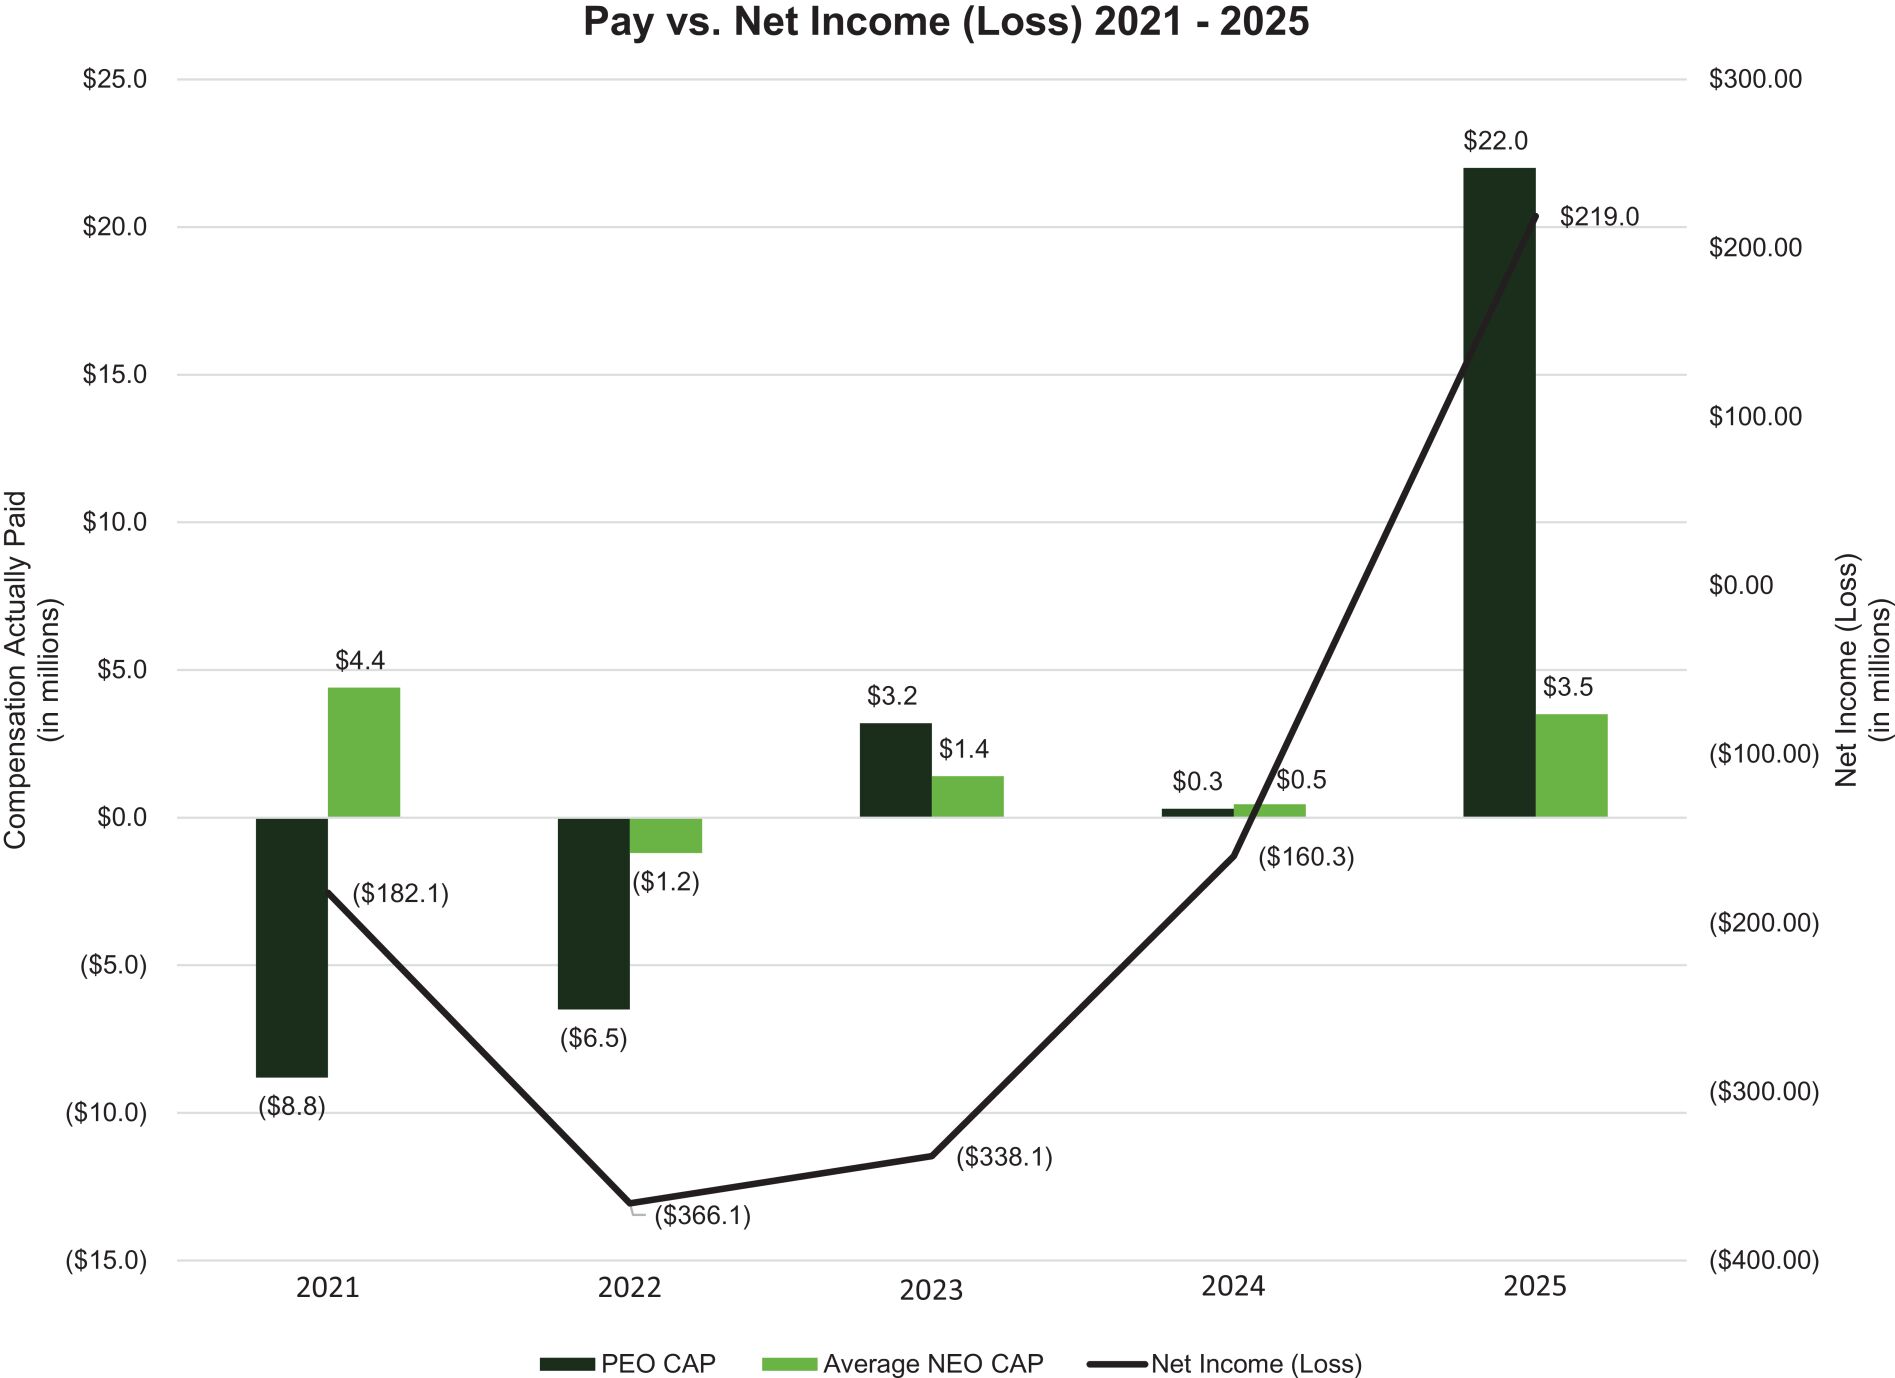
Compensation Actually Paid and Net Income (Loss)
Compensation Actually Paid and Net Revenues
Compensation Actually Paid and Cumulative TSR
Tabular List of Most Important Performance Measures
In accordance with the Pay Versus Performance Rules, the following table lists the measures that, in the company’s assessment, represent the most important financial performance measures used to link “compensation actually paid” to our NEOs, for 2025, to company performance, as further described in our “Compensation Discussion and Analysis” within the section titled “2025 NEO Compensation Details—Executive Incentive Bonus Plan—STI Cash Incentives.”
| MOST IMPORTANT PERFORMANCE MEASURES |
| Net Revenues |
| Gross Margin |
| Operating Expenses |
| (6) |
We have determined that net revenues is the financial performance measure that, in the company’s assessment, represents the most important financial performance measure used to link “compensation actually paid” to our NEOs, for 2025, to company performance (the “Company Selected Measure” as defined in the Pay Versus Performance Rules). We generate net revenues primarily from sales of our products to our customers across mainstream grocery, mass merchandiser, club store and natural retailer channels, and various food-away-from-home channels, including restaurants, foodservice outlets and schools, mainly in the United States. We routinely offer sales discounts and promotions through various programs to customers and consumers. These programs include rebates, temporary on-shelf price reductions, off-invoice discounts, retailer advertisements, product coupons and other trade activities. The expense associated with these discounts and promotions is estimated and recorded as a reduction in total gross revenues in order to arrive at reported net revenues. Please refer to our consolidated financial statements and the related notes thereto included in our 2025 Form 10-K for more information. We use net revenues as a financial performance measure in determining annual cash STI payments under the Bonus Plan for our NEOs. Linking NEO compensation to net revenues incentivizes revenue growth and rewards efforts to grow and expand our business. |