Pay vs Performance Disclosure - USD ($)
Dec. 31, 2025
Dec. 31, 2024
Dec. 31, 2023
Dec. 31, 2022
Dec. 31, 2021
Pay Versus Performance Disclosure
In accordance with rules adopted by the SEC pursuant to the Dodd-Frank Wall Street Reform and Consumer Protection Act of 2010, we provide the following disclosure regarding executive “Compensation Actually Paid” (“CAP”) and certain performance measures for the fiscal years listed below. The Compensation Discussion & Analysis (“CD&A”) describes the compensation setting process for our executive officers, which is done independently from the disclosure requirements.
Pay Versus Performance
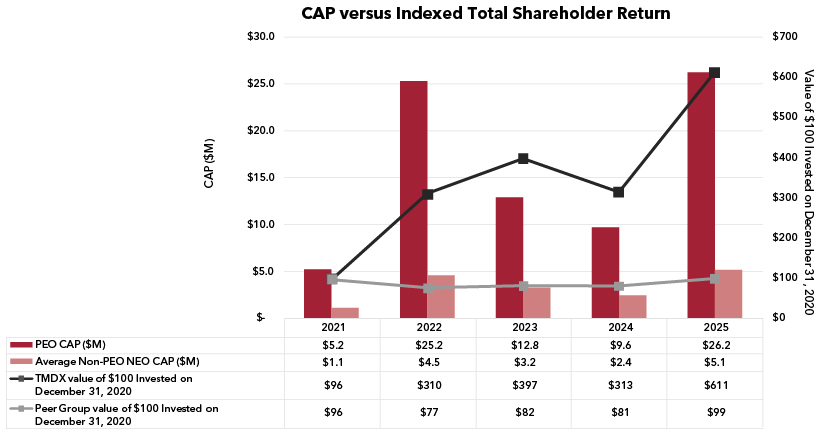
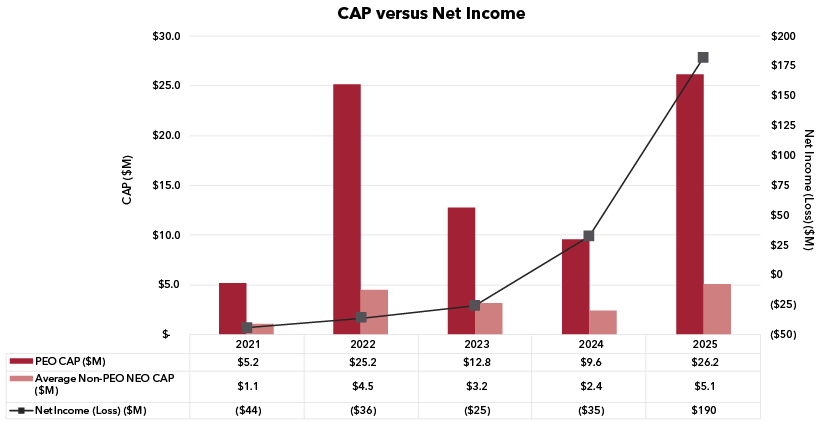
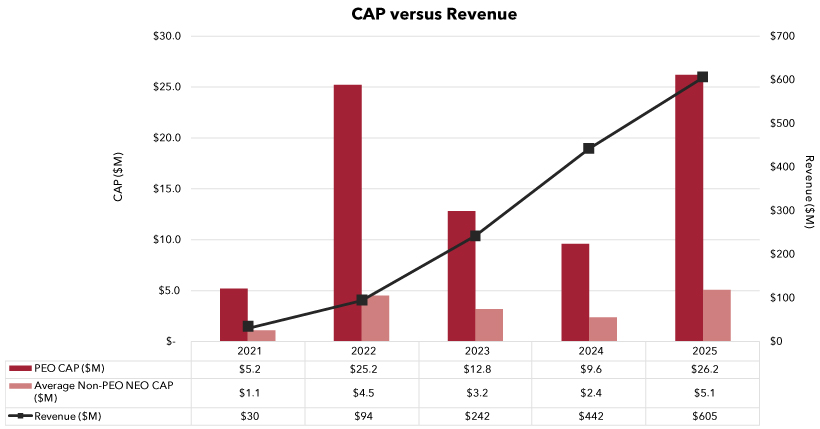
The following table provides the information required for our NEOs for each of the fiscal years ended December 31, 2025, December 31, 2024, December 31, 2023, December 31, 2022, and December 31, 2021 along with the required financial information required for each fiscal year. CAP is calculated in accordance with SEC rules and includes the increase or decrease in value of certain elements of compensation over each fiscal year, including compensation granted in a prior year. CAP does not correlate to the total amount of cash or equity compensation paid or received during each fiscal year. The calculations do not reflect the actual sale of stock underlying equity awards or the exercise of stock options by the executive, and the amount of compensation ultimately received may, in fact, be different from the CAP amounts disclosed in the table below:
| |
|
|
|
|
Value of Initial Fixed $100 Investment Based On: |
|
| |||||||||||||||||||||||||||||||||
Year |
Summary Compensation Table Total for PEO |
Compensation Actually Paid to PEO |
Average Summary Compensation Table Total for Non-PEO NEOs |
Average Compensation Actually Paid to Non-PEO NEOs |
Total Shareholder Return |
Peer Group Total Shareholder Return |
Net Income (Loss) (in millions) |
Revenue (in millions) | ||||||||||||||||||||||||||||||||
$ |
$ |
$ |
$ |
$ |
$ |
$ |
$ | |||||||||||||||||||||||||||||||||
2025 |
10,915,533 | 26,167,148 | 2,410,842 | 5,117,411 | 611.31 | 99.39 | 190.3 | 605.5 | ||||||||||||||||||||||||||||||||
2024 |
8,199,136 | 9,626,783 | 2,983,724 | 2,398,149 | 313.32 | 81.07 | 35.5 | 441.5 | ||||||||||||||||||||||||||||||||
2023 |
6,758,070 | 12,840,624 | 2,493,824 | 3,227,815 | 396.63 | 81.77 | (25.0 | ) | 241.6 | |||||||||||||||||||||||||||||||
2022 |
3,287,862 | 25,221,304 | 958,883 | 4,539,307 | 310.15 | 76.75 | (36.2 | ) | 93.5 | |||||||||||||||||||||||||||||||
2021 |
7,370,365 | 5,172,951 | 1,441,564 | 1,070,396 | 96.28 | 96.45 | (44.2 | ) | 30.3 | |||||||||||||||||||||||||||||||
| (1) | For all years reported, the principal executive officer (“PEO”) was Waleed H. Hassanein, M.D. |
| (2) | Non-PEO NEOs reflect the following executives for each covered fiscal year: |
2025: Gerardo Hernandez, Tamer Khayal, M.D., Nicholas Corcoran, Anil Ranganath;
2024: Gerardo Hernandez, Tamer Khayal, M.D., Nicholas Corcoran, Anil Ranganath, Stephen Gordon;
2023: Stephen Gordon, Tamer Khayal, M.D., Nicholas Corcoran, Anil Ranganath;
2022: Stephen Gordon, Tamer Khayal, M.D., Miriam Provost, Laura Damme; and
2021: Stephen Gordon, Tamer Khayal, M.D., Miriam Provost, Laura Damme.
| (3) | Deductions from, and additions to, total compensation in the Summary Compensation Table by year to calculate CAP are shown in the tables below. |
| |
2025 |
2024 |
2023 |
2022 |
2021 |
|||||||||||||||
| |
$ |
$ |
$ |
$ |
$ |
|||||||||||||||
Summary Compensation Table Total |
10,915,533 |
8,199,136 |
6,758,070 |
3,287,862 |
7,370,365 |
|||||||||||||||
Adjustments for Stock and Option Awards |
||||||||||||||||||||
Adjustment for grant date fair values in the Summary Compensation Table |
(8,724,160 | ) | (6,096,424 | ) | (4,940,574 | ) | (1,825,900 | ) | (6,377,940 | ) | ||||||||||
Year-end fair value of unvested awards granted in the covered fiscal year |
13,606,442 | 3,958,387 | 5,365,601 | 10,641,357 | 2,075,714 | |||||||||||||||
Year-over-year difference of year-end fair values for unvested awards granted in prior years that remained outstanding at the covered fiscal year end |
4,892,258 | (2,382,164 | ) | 3,440,246 | 8,789,181 | (136,012 | ) | |||||||||||||
Fair values at vest date for awards granted and vested in covered fiscal year |
1,546,395 | 971,689 | 532,735 | 1,647,831 | 949,688 | |||||||||||||||
Difference in fair values between prior year-end fair values and vest date fair values for awards granted in prior years and vesting in the covered fiscal year |
3,941,653 | 4,976,159 | 1,684,546 | 2,680,973 | 1,291,136 | |||||||||||||||
Compensation Actually Paid (as calculated) |
26,167,148 |
9,626,783 |
12,840,624 |
25,221,304 |
5,172,951 |
|||||||||||||||
| |
Average CAP to Non-PEO NEOs |
|||||||||||||||||||
| |
2025 |
2024 |
2023 |
2022 |
2021 |
|||||||||||||||
| |
$ |
$ |
$ |
$ |
$ |
|||||||||||||||
Summary Compensation Table Total |
2,410,842 |
2,983,724 |
2,493,824 |
958,883 |
1,441,564 |
|||||||||||||||
Adjustments for Stock and Option Awards |
||||||||||||||||||||
Adjustment for grant date fair values in the Summary Compensation Table |
(1,519,574 | ) | (2,053,545 | ) | (1,738,234 | ) | (328,662 | ) | (977,265 | ) | ||||||||||
Year-end fair value of unvested awards granted in the covered fiscal year |
2,228,435 | 1,079,261 | 1,822,445 | 1,915,468 | 318,056 | |||||||||||||||
Year-over-year difference of year-end fair values for unvested awards granted in prior years that remained outstanding at the covered fiscal year end |
1,201,674 | (371,623 | ) | 372,583 | 1,344,252 | (16,871 | ) | |||||||||||||
Fair values at vest date for awards granted and vested in covered fiscal year |
250,719 | 188,739 | 93,271 | 296,601 | 145,504 | |||||||||||||||
Difference in fair values between prior year-end fair values and vest date fair values for awards granted in prior years and vesting in the covered fiscal year |
545,315 | 571,594 | 183,926 | 352,765 | 159,408 | |||||||||||||||
Compensation Actually Paid (as calculated) |
5,117,411 |
2,398,149 |
3,227,815 |
4,539,307 |
1,070,396 |
|||||||||||||||
| (4) | The valuation of RSU awards included as part of CAP was based on the grant date closing price and the closing price on the applicable vesting date or fiscal year end. The following summarizes the valuation assumptions used for stock option awards included as part of CAP: |
| a. | Expected life of each stock option is based on the “simplified method” using an average of the remaining vesting period and remaining term, as of the applicable vesting date or fiscal year end. |
| b. | The exercise price is based on each grant date closing price and fair value is based on the closing price on the applicable vesting date or fiscal year end. |
| c. | Risk free rate is based on the Treasury Constant Maturity rate closest to the remaining expected life as of the applicable vesting date or fiscal year end. |
| d. | Historical volatility is based on the daily price history for each year of remaining expected life prior to each applicable vesting date or fiscal year end; closing prices are provided by S&P Capital IQ and are adjusted for dividends and splits. |
| e. | Annual dividend yield on each applicable vesting date or fiscal year end is assumed to be zero. |
| (5) | The following table illustrates the valuation assumptions as of the vesting date for stock options that vested in each of the covered fiscal years: |
| |
2025 |
2024 |
2023 |
2022 |
2021 | |||||
Expected volatility |
67.69% - 76.88% |
72.02% - 77.95% |
71.79% - 77.78% |
69.15% - 76.30% |
64.38% - 72.22% | |||||
Expected dividend yield |
0.00% | 0.00% | 0.00% | 0.00% | 0.00% | |||||
Expected term, in years |
3.0 - 5.0 | 3.0 - 5.0 | 3.0 - 5.0 | 3.2 - 5.0 | 3.0 - 5.0 | |||||
Risk-free interest rate |
3.44% - 4.45% | 3.44% - 4.81% | 3.54% - 4.91% | 0.97% - 4.48% | 0.19% - 1.34% | |||||
| (6) | The amounts reported in this column represent the cumulative total return on $100 invested in the Company’s common stock as of December 31, 2020 through the last trading day for the applicable fiscal year in the table. The Company has not paid any dividends since its IPO. |
| (7) | The amounts reported in this column represent the weighted cumulative total return on $100 invested as of December 31, 2020 through the last trading day for the applicable fiscal year in the table, weighted according to the respective companies’ stock market capitalization at the beginning of each period for which a return is indicated. The peer group total shareholder return set forth in this table utilizes the Nasdaq Healthcare Index (IXHC), which we also utilize in the stock performance graph required by Item 201(e) of Regulation S-K included in our Annual Report on Form 10-K for the year ended December 31, 2025. The return of this index is calculated assuming reinvestment of dividends during the period presented. |
| (8) | The amounts reported in this column represent the amount of net income (loss) reflected in the Company’s audited financial statements for the applicable year. |
| (9) | The amounts reported in this column represent revenue, our Company-Selected Measure, which we believe is the most important financial measure used to link compensation actually paid to our named executive officers to Company performance for 2025. The amounts represent the amount of revenue reflected in the Company’s audited financial statements for the applicable year. |
| (2) | Non-PEO NEOs reflect the following executives for each covered fiscal year: |
2025: Gerardo Hernandez, Tamer Khayal, M.D., Nicholas Corcoran, Anil Ranganath;
2024: Gerardo Hernandez, Tamer Khayal, M.D., Nicholas Corcoran, Anil Ranganath, Stephen Gordon;
2023: Stephen Gordon, Tamer Khayal, M.D., Nicholas Corcoran, Anil Ranganath;
2022: Stephen Gordon, Tamer Khayal, M.D., Miriam Provost, Laura Damme; and
2021: Stephen Gordon, Tamer Khayal, M.D., Miriam Provost, Laura Damme.
S-K
included in our Annual Report on Form 10-K
for the year ended December 31, 2025. The return of this index is calculated assuming reinvestment of dividends during the period presented.
| (3) | Deductions from, and additions to, total compensation in the Summary Compensation Table by year to calculate CAP are shown in the tables below. |
| |
2025 |
2024 |
2023 |
2022 |
2021 |
|||||||||||||||
| |
$ |
$ |
$ |
$ |
$ |
|||||||||||||||
Summary Compensation Table Total |
10,915,533 |
8,199,136 |
6,758,070 |
3,287,862 |
7,370,365 |
|||||||||||||||
Adjustments for Stock and Option Awards |
||||||||||||||||||||
Adjustment for grant date fair values in the Summary Compensation Table |
(8,724,160 | ) | (6,096,424 | ) | (4,940,574 | ) | (1,825,900 | ) | (6,377,940 | ) | ||||||||||
Year-end fair value of unvested awards granted in the covered fiscal year |
13,606,442 | 3,958,387 | 5,365,601 | 10,641,357 | 2,075,714 | |||||||||||||||
Year-over-year difference of year-end fair values for unvested awards granted in prior years that remained outstanding at the covered fiscal year end |
4,892,258 | (2,382,164 | ) | 3,440,246 | 8,789,181 | (136,012 | ) | |||||||||||||
Fair values at vest date for awards granted and vested in covered fiscal year |
1,546,395 | 971,689 | 532,735 | 1,647,831 | 949,688 | |||||||||||||||
Difference in fair values between prior year-end fair values and vest date fair values for awards granted in prior years and vesting in the covered fiscal year |
3,941,653 | 4,976,159 | 1,684,546 | 2,680,973 | 1,291,136 | |||||||||||||||
Compensation Actually Paid (as calculated) |
26,167,148 |
9,626,783 |
12,840,624 |
25,221,304 |
5,172,951 |
|||||||||||||||
| (3) | Deductions from, and additions to, total compensation in the Summary Compensation Table by year to calculate CAP are shown in the tables below. |
| |
Average CAP to Non-PEO NEOs |
|||||||||||||||||||
| |
2025 |
2024 |
2023 |
2022 |
2021 |
|||||||||||||||
| |
$ |
$ |
$ |
$ |
$ |
|||||||||||||||
Summary Compensation Table Total |
2,410,842 |
2,983,724 |
2,493,824 |
958,883 |
1,441,564 |
|||||||||||||||
Adjustments for Stock and Option Awards |
||||||||||||||||||||
Adjustment for grant date fair values in the Summary Compensation Table |
(1,519,574 | ) | (2,053,545 | ) | (1,738,234 | ) | (328,662 | ) | (977,265 | ) | ||||||||||
Year-end fair value of unvested awards granted in the covered fiscal year |
2,228,435 | 1,079,261 | 1,822,445 | 1,915,468 | 318,056 | |||||||||||||||
Year-over-year difference of year-end fair values for unvested awards granted in prior years that remained outstanding at the covered fiscal year end |
1,201,674 | (371,623 | ) | 372,583 | 1,344,252 | (16,871 | ) | |||||||||||||
Fair values at vest date for awards granted and vested in covered fiscal year |
250,719 | 188,739 | 93,271 | 296,601 | 145,504 | |||||||||||||||
Difference in fair values between prior year-end fair values and vest date fair values for awards granted in prior years and vesting in the covered fiscal year |
545,315 | 571,594 | 183,926 | 352,765 | 159,408 | |||||||||||||||
Compensation Actually Paid (as calculated) |
5,117,411 |
2,398,149 |
3,227,815 |
4,539,307 |
1,070,396 |
|||||||||||||||
Tabular List of Financial Performance Measures
As described in greater detail in the CD&A, we have a significant focus on The most important financial and
pay-for-performance.
non-financial
performance measures used to link CAP (as calculated in accordance with the SEC rules) to our NEOs in 2025 to our performance were: • |
Revenue target of $545M; |
• |
Initiation of a US Lung clinical program and enrolling approximately 150 OCS cases by December 31, 2025; |
• |
Initiation of a US Heart clinical program and enrolling approximately 150 heart cases by December 31, 2025; |
• |
Initiation of OCS Liver NOP programs in six new US liver centers by December 31, 2025; |
• |
Maintain positive EBITDA for all four quarters of 2025; |
• |
Launch of NOP Connect to manage all NOP services by June 30, 2025; |
• |
Establish OCS NOP program in two countries outside the United States by December 31, 2025; |
• |
Complete MES and Workday headcount planning modules by September 30, 2025 and develop business digital transformation roadmap by December 31, 2025; |
• |
Complete the architectural design of the fully-automated and remote-controlled OCS NextGen Tech platform and initiate key third-party developers by December 31, 2025; and |
• |
Complete the architectural design of OCS Kidney by December 31, 2025. |