Pay Versus Performance
As required by Section 953(a) of the Dodd-Frank Wall Street Reform and Consumer Protection Act, and Item 402(v) of Regulation S-K, we are providing the following information about the relationship between “compensation actually paid” to our CEO and to our other NEOs and certain financial performance of the Company. Compensation actually paid, as determined under SEC requirements, does not reflect the actual amount of compensation earned by or paid to our executive officers during a covered year. For further information concerning the Company’s pay-for-performance philosophy and how the Company aligns executive compensation with the Company’s performance, refer to the Compensation Discussion and Analysis.
Pay Versus Performance Table
|
Value of initial fixed $100 investment based on: |
||||||||||||||||||||||||||||||||
|
Year(1) |
Summary Compensation Table Total for CEO |
Compensation Actually Paid to CEO (2) |
Average Summary Compensation Table Total for Other NEO's |
Average Compensation Actually paid to Other NEO's (2) |
Total Shareholder Return |
Total Shareholder Return Peer Group (3) |
Net Income |
Adjusted Net Earnings(4) |
||||||||||||||||||||||||
|
2025 |
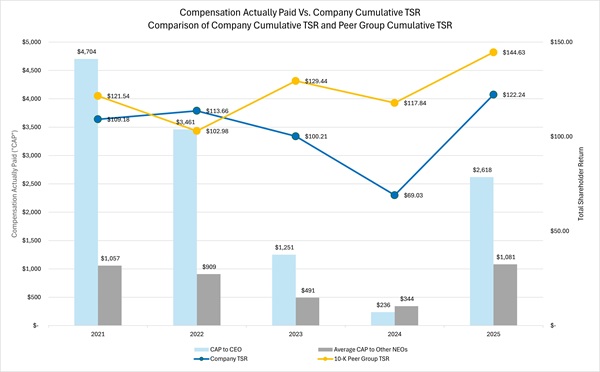
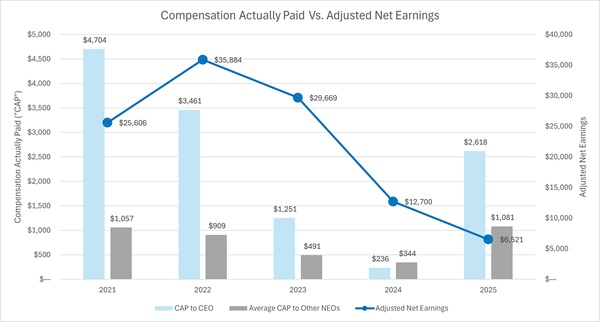
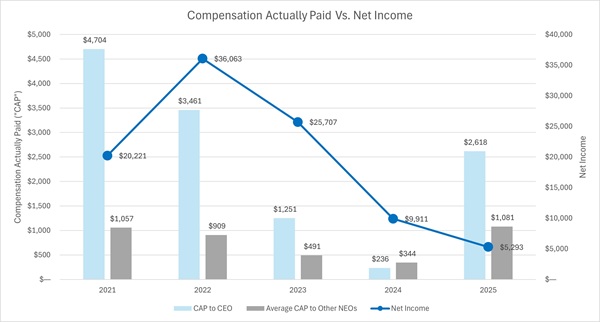
$ | 2,279,041 | $ | 2,617,910 | $ | 531,826 | $ | 1,081,155 | $ | 122.24 | $ | 144.63 | $ | 5,293,000 | $ | 6,521,000 | ||||||||||||||||
|
2024 |
$ | 2,130,225 | $ | 235,859 | $ | 661,866 | $ | 344,315 | $ | 69.03 | $ | 117.84 | $ | 9,911,000 | $ | 12,700,000 | ||||||||||||||||
|
2023 |
$ | 2,353,920 | $ | 1,251,223 | $ | 685,134 | $ | 491,198 | $ | 100.21 | $ | 129.44 | $ | 25,707,000 | $ | 29,669,000 | ||||||||||||||||
|
2022 |
$ | 2,721,053 | $ | 3,461,360 | $ | 791,514 | $ | 908,672 | $ | 113.66 | $ | 102.98 | $ | 36,063,000 | $ | 35,884,000 | ||||||||||||||||
|
2021 |
$ | 3,624,818 | $ | 4,704,237 | $ | 895,018 | $ | 1,057,375 | $ | 109.18 | $ | 121.54 | $ | 20,221,000 | $ | 25,606,000 | ||||||||||||||||
Notes:
|
(1) |
For each covered year, the CEO was Ziv Shoshani. For each covered year, the Other NEOs were William M. Clancy, Amir Tal and Rafi Ouzan. Yair Alcobi was appointed on October 30, 2025. |
|
(2) |
For 2025, amounts reported in this column are based on the total compensation and the average of the total compensation reported for our CEO and Other NEOs, respectively in the Summary Compensation Table and adjusted as shown in the table below. Fair value of equity awards was computed in accordance with the Company’s methodology used for financial reporting purposes. |
|
(3) |
Pursuant to Item 402(v) of Regulation S-K, the Company used the same peer group used for purposes of Item 201(e) of Regulation S-K. The table below shows the companies that comprised the peer group. There were errors in the calculations of the peer group TSR that were reported in the prior year for 2022 and2021. The corrected values have been presented in this proxy statement and represent an increase in the 2022 peer group TSR of $1.48 or 1.4%, and an increase in the 2021 peer group TSR of $0.12 or 0.1% when compared to the figures presented in the prior year proxy statement. |
|
CTS Corp |
|
Luna Innovations Inc. |
|
inTEST Corporation |
|
Kyowa |
|
Spectris plc |
|
TT Electronics |
|
FARO Technologies Inc. |
|
ESCO Technologies Inc. |
|
(4) |
In accordance with SEC rules, the Company is required to include in the Pay versus Performance table the “most important” financial performance measure (as determined by the Company) used to link compensation actually paid to our named executive officers to Company performance for the most recently completed fiscal year. The Company determined Adjusted Net Earnings which is a metric included in our long-term incentive program, meets this requirement and therefore, we have included this financial performance measure in the Pay versus Performance table. For the fiscal years ended 2024 and 2023, a reconciliation of Adjusted Net Earnings to the nearest GAAP measure can be found in the Form 10-K. For the fiscal year ended 2022 and 2021, a reconciliation of Adjusted Net Earnings to the nearest GAAP measure can be found in our Form 10-K for the fiscal year ended December 31, 2023. |
|
CEO |
Average of Other NEOs |
|||||||
|
Total reported in 2025 Summary Compensation Table (SCT) |
$ | 2,279,041 | $ | 531,826 | ||||
|
Less: Value of Stock & Option Awards reported in SCT |
(1,300,661 | ) | $ | (163,745 | ) | |||
|
Less: Change in Pension Value and Non-Qualified Deferred Compensation Earnings in SCT |
— | — | ||||||
|
Plus: Pension Service Cost and impact of Pension Plan Amendments |
5,904 | — | ||||||
|
Plus: Year-End value of Awards Granted in Fiscal Year that are Unvested and Outstanding |
1,069,992 | $ | 512,243 | |||||
|
Plus: Change in Fair Value of Prior Year awards that are Outstanding and Unvested |
320,779 | $ | 118,723 | |||||
|
Plus: FMV of Awards Granted this Year and that Vested this year |
— | — | ||||||
|
Plus: Change in Fair Value (From Prior Year-End) of Prior Year awards that Vested this year |
242,855 | $ | 82,109 | |||||
|
Less: Prior Year Fair Value of Prior Year awards that failed to vest this year. |
— | — | ||||||
|
Total Adjustments |
339,173 | 549,330 | ||||||
|
"Compensation Actually Paid" for Fiscal Year 2025 |
$ | 2,617,910 | $ | 1,081,155 | ||||
|
CEO |
Average of Other NEOs |
|||||||
|
Total reported in 2025 Summary Compensation Table (SCT) |
$ | 2,279,041 | $ | 531,826 | ||||
|
Less: Value of Stock & Option Awards reported in SCT |
(1,300,661 | ) | $ | (163,745 | ) | |||
|
Less: Change in Pension Value and Non-Qualified Deferred Compensation Earnings in SCT |
— | — | ||||||
|
Plus: Pension Service Cost and impact of Pension Plan Amendments |
5,904 | — | ||||||
|
Plus: Year-End value of Awards Granted in Fiscal Year that are Unvested and Outstanding |
1,069,992 | $ | 512,243 | |||||
|
Plus: Change in Fair Value of Prior Year awards that are Outstanding and Unvested |
320,779 | $ | 118,723 | |||||
|
Plus: FMV of Awards Granted this Year and that Vested this year |
— | — | ||||||
|
Plus: Change in Fair Value (From Prior Year-End) of Prior Year awards that Vested this year |
242,855 | $ | 82,109 | |||||
|
Less: Prior Year Fair Value of Prior Year awards that failed to vest this year. |
— | — | ||||||
|
Total Adjustments |
339,173 | 549,330 | ||||||
|
"Compensation Actually Paid" for Fiscal Year 2025 |
$ | 2,617,910 | $ | 1,081,155 | ||||
Description of the Relationship Between Compensation Actually Paid to our Named Executive Officers and Company Performance
The charts below describe the relationship between compensation actually paid to our chief executive officer and to our other named executive officers (as calculated above) and our financial and stock performance for the indicated years. In addition, the first table below compares our cumulative total shareholder return ("TSR") and peer group cumulative TSR for the indicated years.
Company’s Most Important Financial Performance Measures
The following were the most important financial performance measures, as determined by the Company, that link the compensation actually paid to our CEO and Other NEOs to the Company’s performance for the most recently completed fiscal year.
|
Adjusted operating margin |
|
Adjusted EBITDA |
|
Cumulative adjusted net earnings |
|
Cumulative adjusted free cash |
Each of these financial performance measures are used in our incentive programs to determine the level of payout. For more information on each of these performance measures, see Annual Performance Cash Bonus and Equity Compensation beginning on page 20 of this Proxy Statement.