Pay vs Performance Disclosure
Dec. 31, 2022
May 24, 2022
Dec. 31, 2025
USD ($)
Dec. 31, 2024
USD ($)
Dec. 31, 2023
USD ($)
Dec. 31, 2022
USD ($)
Dec. 31, 2021
USD ($)
Pay Versus Performance
In accordance with SEC rules, we provide the following disclosure regarding executive “compensation actually paid” (“CAP”) and certain performance for the fiscal years listed below. You should refer to our CD&A for a complete description of how executive compensation relates to the Company’s performance and how the Compensation Committee makes its decisions on executive compensation matters.
Principal Executive Officer (“PEO”)(1) |
Non-PEO NEOs (2) |
Value of initial fixed $100 investment based on: |
Company metrics |
|||||||||||||||||||||||||||||||||||||
Summary compensation on table total (3) |
Compensation actually paid (4) |
Average summary compensation on table total ($) |
Average compensation actually paid ($) |
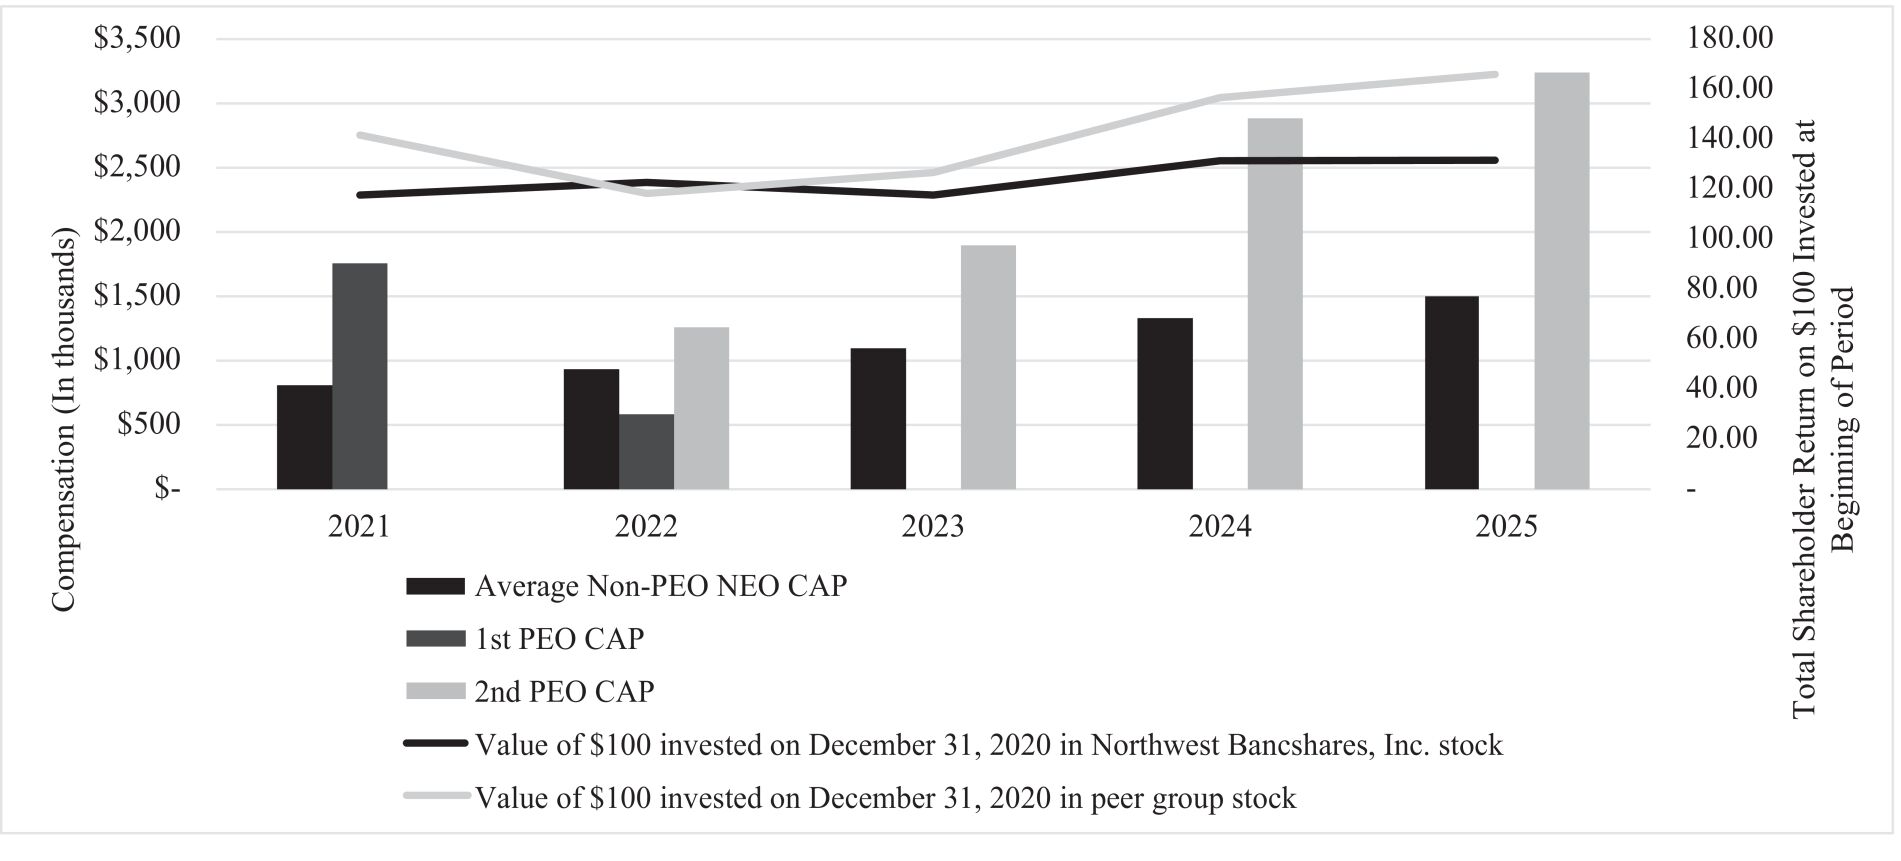
Total shareholder return ($)(6) |
Peer group total shareholder return ($)(7) |
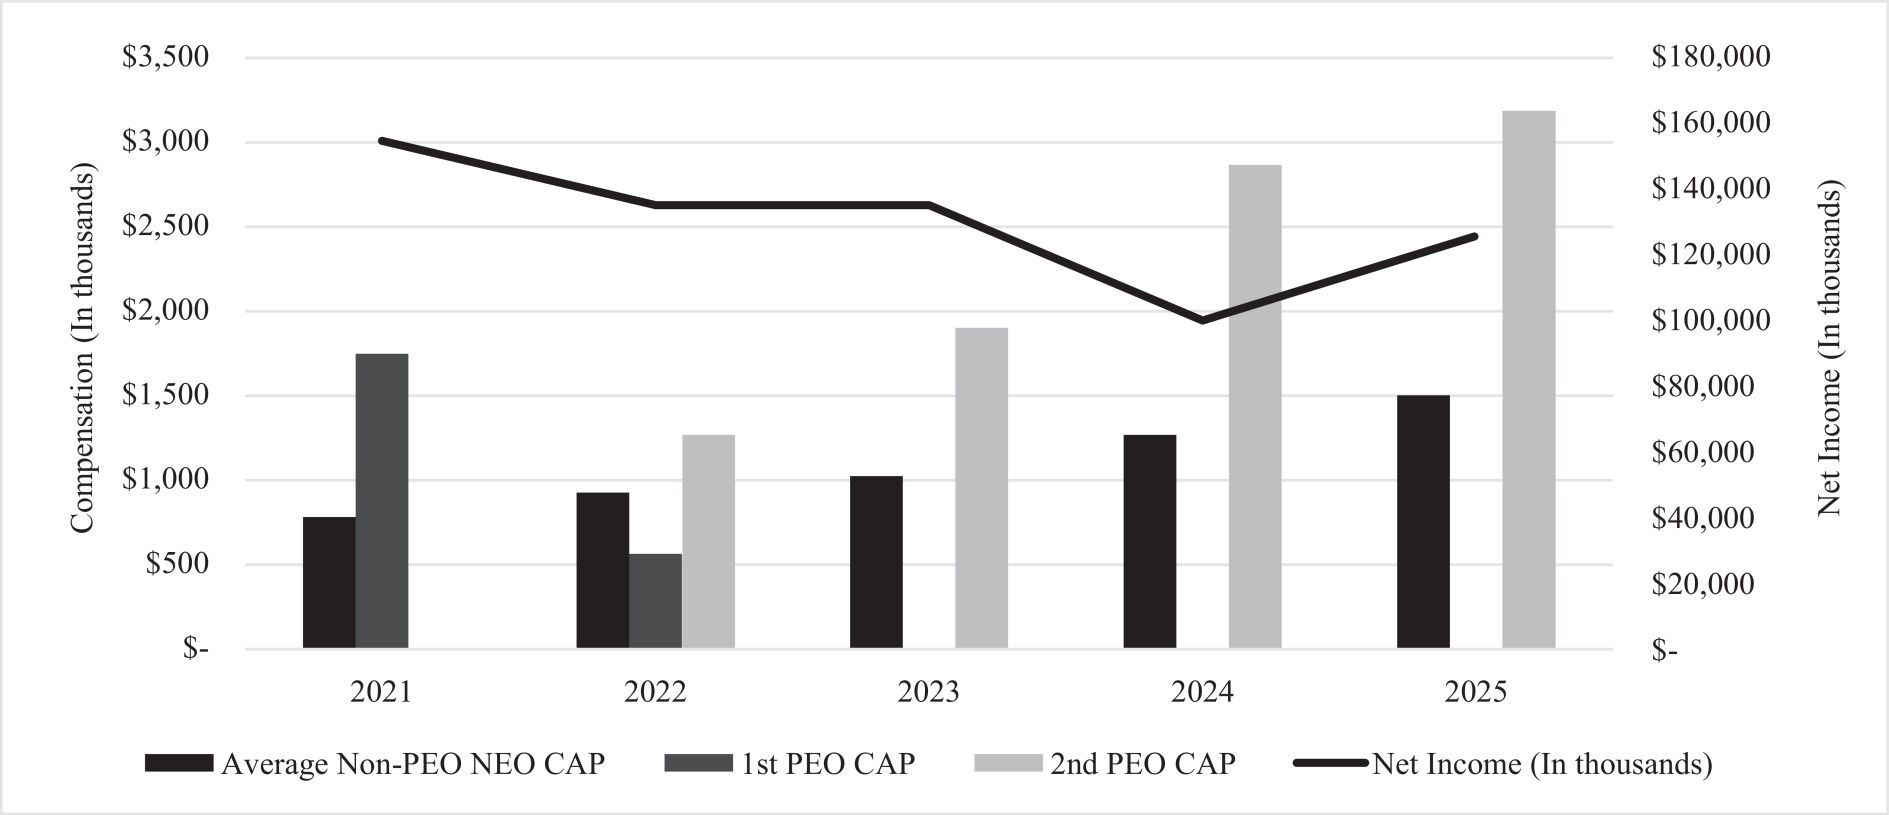
Net income (in thousands) ($)(8) |
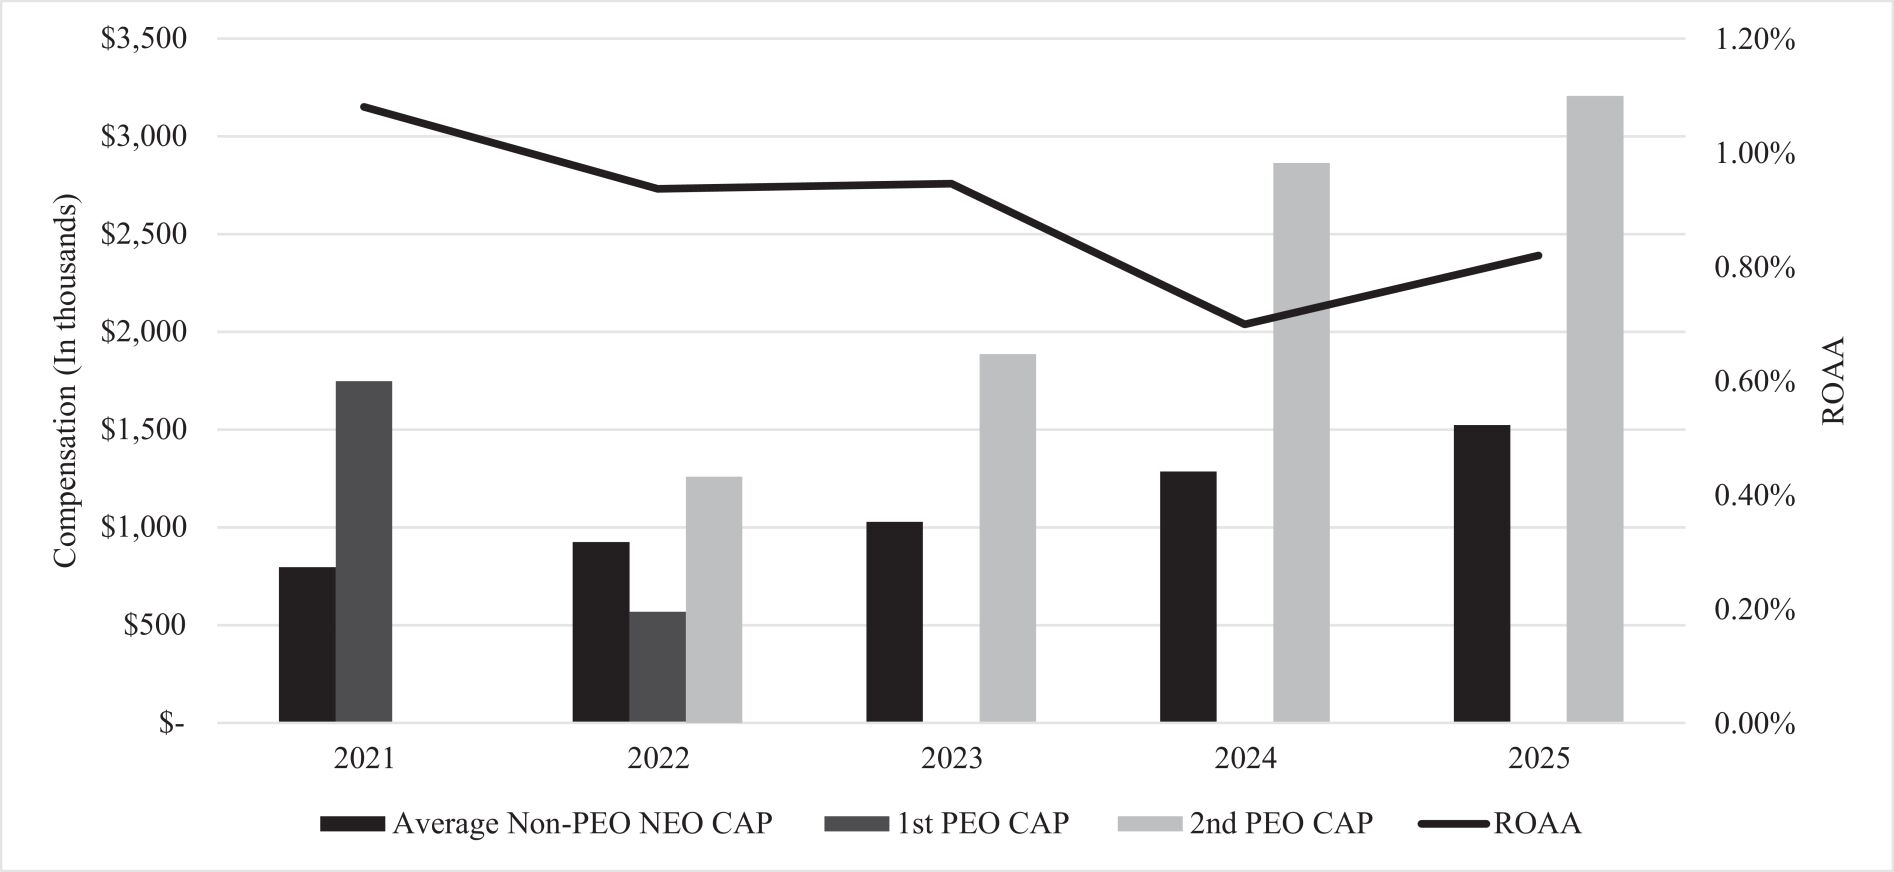
Return on average assets (ROAA”)(9) |
|||||||||||||||||||||||||||||||||
Year |
1st PEO ($) |
2nd PEO ($)(5) |
1st PEO ($) |
2nd PEO ($) |
||||||||||||||||||||||||||||||||||||
2025 |
— | 3,396,755 | — | 3,210,063 | 1,543,449 | 1,511,371 | 128.95 | 166.91 | 126,013 | 0.82 | % | |||||||||||||||||||||||||||||
2024 |
— | 2,662,273 | — | 2,879,712 | 1,190,164 | 1,287,225 | 108.85 | 141.59 | 100,278 | 0.70 | % | |||||||||||||||||||||||||||||
2023 |
— | 1,932,963 | — | 1,897,705 | 1,094,014 | 1,029,588 | 96.63 | 114.99 | 134,957 | 0.95 | % | |||||||||||||||||||||||||||||
2022 |
802,002 | 1,190,891 | 580,603 | 1,255,743 | 862,057 | 933,361 | 101.06 | 107.54 | 133,666 | 0.94 | % | |||||||||||||||||||||||||||||
2021 |
1,688,530 | — | 1,758,462 | — | 730,276 | 793,259 | 96.62 | 128.28 | 154,323 | 1.08 | % | |||||||||||||||||||||||||||||
| (1) | Mr. Seiffert served as Chairman, President and CEO prior to his death on May 24, 2022. At this time, Mr. Harvey was appointed interim President and CEO. On August 17, 2022, Mr. Torchio was appointed President and CEO. Given these events, the Company has disclosed Mr. Seiffert’s total compensation and compensation actually paid for the time he served as CEO in 2022, and the full year for 2021 as “1st PEO” and has disclosed Mr. Torchio’s total compensation and compensation actually paid as the “2nd PEO” for 2022 and subsequent years. Mr. Torchio’s compensation prior to his becoming our CEO is included in the non-PEO NEOs disclosure for 2021. Mr. Harvey’s total compensation and compensation actually paid is included in the non-PEO NEO disclosures for all years presented. |
| (2) | Non-PEO NEOs average calculation includes Messrs. Schosser, Harvey, Betchkal, DesMarteau and Watson for 2024; Messrs. Harvey, Betchkal, Golding and Watson for 2023; Messrs. Harvey, Golding, Reitzes and Watson for 2022; and Messrs. Harvey, Torchio, Golding and Reitzes for 2021. Mr. Harvey retired from the Company on December 31, 2024. Mr. Golding’s employment with the Company was terminated on June 17, 2024. Mr. Reitzes’ employment with the Company was terminated on June 9, 2023. |
| (3) | The dollar amounts reported in this column are the amounts of total compensation reported for each PEO for each corresponding year in the “Total” column of the Summary Compensation Table. |
| (4) | The amounts reported in these columns represent the amount of CAP to Mr. Torchio and the other NEOs as a group, as computed in accordance with Item 402(v) of Regulation S-K. The amounts do not reflect the actual amount of compensation earned by or paid to Mr. Torchio or to the other NEOs as a group during the applicable year. In accordance with the requirements of Item 402(v) of Regulation S-K, the following adjustments were made in calculating Mr. Torchio’s total compensation and the average total compensation for the other NEOs as a group for each year to determine the CAP: |
1st PEO |
2nd PEO |
Non-PEO NEOs |
||||||||||||||||||||||||||||||||||||||||||||||||||||||||||
Adjustments from Summary Compensation Table |
2025 |
2024 |
2023 |
2022 |
2021 |
2025 |
2024 |
2023 |
2022 |
2021 |
2025 |
2024 |
2023 |
2022 |
2021 |
|||||||||||||||||||||||||||||||||||||||||||||
| Deduction for change in actuarial present values reported under the “Change in Pension Value and Non-qualified Deferred Compensation Earnings” column in the Summary Compensation Table |
$ | — | — | — | — | (137,564 | ) | $ | (89,806 | ) | (95,792 | ) | (107,523 | ) | (13,422 | ) | — | $ | — | (10,872 | ) | (61,817 | ) | (5,165 | ) | (37,407 | ) | |||||||||||||||||||||||||||||||||
| Increase for service cost of pension plans | — | — | — | — | 125,912 | 88,321 | 97,784 | 107,191 | 34,469 | — | — | 18,988 | 35,572 | 34,476 | 49,157 | |||||||||||||||||||||||||||||||||||||||||||||
| Increase/deduction for prior service cost of pension plans | — | — | — | — | — | — | — | — | — | — | — | — | — | — | — | |||||||||||||||||||||||||||||||||||||||||||||
| Deduction for amounts reported under the “Stock Awards” and “Option Awards” columns in the Summary Compensation Table | — | — | — | (460,279 | ) | (196,620 | ) | (999,992 | ) | (999,848 | ) | (511,417 | ) | (151,159 | ) | — | (440,672 | ) | (291,128 | ) | (290,466 | ) | (163,187 | ) | (109,081 | ) | ||||||||||||||||||||||||||||||||||
| Increase based on fair value of awards granted during year that remain unvested as of year-end, determined as of year-end |
— | — | — | — | 165,456 | 998,962 | 1,157,959 | 521,964 | 176,755 | — | 443,171 | 360,131 | 292,849 | 187,724 | 92,029 | |||||||||||||||||||||||||||||||||||||||||||||
| Increase/deduction for change in fair value from prior year-end to current year-end of awards granted prior to year that were outstanding and unvested as of year-end |
— | — | — | — | 47,665 | (71,266 | ) | 72,404 | (34,149 | ) | 13,591 | — | (21,542 | ) | 28,005 | (29,268 | ) | 13,133 | 30,379 | |||||||||||||||||||||||||||||||||||||||||
Increase based on fair value of awards granted during year that vested during year, determined as of vesting date |
— | — | — | 273,656 | 36,252 | — | — | — | — | — | — | — | — | — | 19,836 | |||||||||||||||||||||||||||||||||||||||||||||
| Increase/deduction for change in fair value from prior year-end to vesting date of awards granted prior to year that vested during year |
— | — | — | (46,666 | ) | 7,331 | (24,106 | ) | (20,007 | ) | (19,238 | ) | (6,270 | ) | — | (13,035 | ) | (10,380 | ) | (18,337 | ) | (7,086 | ) | 4,978 | ||||||||||||||||||||||||||||||||||||
| Deduction of fair value of awards granted prior to year that were forfeited during year | — | — | — | — | — | (90,937 | ) | — | — | — | — | — | — | — | — | — | ||||||||||||||||||||||||||||||||||||||||||||
| Increase based on dividends or other earnings paid during year prior to vesting date of award | — | — | — | 11,890 | 21,500 | 2,132 | 4,939 | 7,914 | 10,888 | — | — | 2,316 | 7,041 | 11,409 | 13,092 | |||||||||||||||||||||||||||||||||||||||||||||
Total adjustments |
$ | — | — | — | (221,399 | ) | 69,932 | $ | (186,692 | ) | 217,439 | (35,258 | ) | 64,852 | — | $ | (32,078 | ) | 97,060 | (64,426 | ) | 71,304 | 62,983 | |||||||||||||||||||||||||||||||||||||
Fair values set forth in the table above are computed in accordance with FASB ASC 718 as of the end of the respective fiscal year, other than fair values of awards that vest in the covered year, which are valued as of the applicable vesting date or fair values of awards that were forfeited in the covered year, which are valued as of the last day of the year immediately preceding the covered year.
| (5) | Mr. Torchio was appointed as the CEO on August 20, 2022. The disclosure for 2022 includes salary of $270,769 for his service as the CEO and $258,779 for his service prior to becoming the CEO. |
| (6) | TSR is cumulative for the measurement periods beginning on December 31, 2019 and ending on December 31, 2024, calculated in accordance with Item 201(e) of Regulation S-K. |
| (7) | Peer group total shareholder return reflects the value of $100 investment in the Nasdaq Bank Index. |
| (8) | The dollar amounts reported represent the amount of net income as required to be reflected in the Company’s audited financial statements for the applicable year. |
| (9) | ROAA (GAAP) is defined as net income divided by average assets. |
Non-PEO
NEOs average calculation includes Messrs. Schosser, Harvey, Betchkal, DesMarteau and Watson for 2024; Messrs. Harvey, Betchkal, Golding and Watson for 2023; Messrs. Harvey, Golding, Reitzes and Watson for 2022; and Messrs. Harvey, Torchio, Golding and Reitzes for 2021. Mr. Harvey retired from the Company on December 31, 2024. Mr. Golding’s employment with the Company was terminated on June 17, 2024. Mr. Reitzes’ employment with the Company was terminated on June 9, 2023.
1st PEO |
2nd PEO |
Non-PEO NEOs |
||||||||||||||||||||||||||||||||||||||||||||||||||||||||||
Adjustments from Summary Compensation Table |
2025 |
2024 |
2023 |
2022 |
2021 |
2025 |
2024 |
2023 |
2022 |
2021 |
2025 |
2024 |
2023 |
2022 |
2021 |
|||||||||||||||||||||||||||||||||||||||||||||
| Deduction for change in actuarial present values reported under the “Change in Pension Value and Non-qualified Deferred Compensation Earnings” column in the Summary Compensation Table |
$ | — | — | — | — | (137,564 | ) | $ | (89,806 | ) | (95,792 | ) | (107,523 | ) | (13,422 | ) | — | $ | — | (10,872 | ) | (61,817 | ) | (5,165 | ) | (37,407 | ) | |||||||||||||||||||||||||||||||||
| Increase for service cost of pension plans | — | — | — | — | 125,912 | 88,321 | 97,784 | 107,191 | 34,469 | — | — | 18,988 | 35,572 | 34,476 | 49,157 | |||||||||||||||||||||||||||||||||||||||||||||
| Increase/deduction for prior service cost of pension plans | — | — | — | — | — | — | — | — | — | — | — | — | — | — | — | |||||||||||||||||||||||||||||||||||||||||||||
| Deduction for amounts reported under the “Stock Awards” and “Option Awards” columns in the Summary Compensation Table | — | — | — | (460,279 | ) | (196,620 | ) | (999,992 | ) | (999,848 | ) | (511,417 | ) | (151,159 | ) | — | (440,672 | ) | (291,128 | ) | (290,466 | ) | (163,187 | ) | (109,081 | ) | ||||||||||||||||||||||||||||||||||
| Increase based on fair value of awards granted during year that remain unvested as of year-end, determined as of year-end |
— | — | — | — | 165,456 | 998,962 | 1,157,959 | 521,964 | 176,755 | — | 443,171 | 360,131 | 292,849 | 187,724 | 92,029 | |||||||||||||||||||||||||||||||||||||||||||||
| Increase/deduction for change in fair value from prior year-end to current year-end of awards granted prior to year that were outstanding and unvested as of year-end |
— | — | — | — | 47,665 | (71,266 | ) | 72,404 | (34,149 | ) | 13,591 | — | (21,542 | ) | 28,005 | (29,268 | ) | 13,133 | 30,379 | |||||||||||||||||||||||||||||||||||||||||
Increase based on fair value of awards granted during year that vested during year, determined as of vesting date |
— | — | — | 273,656 | 36,252 | — | — | — | — | — | — | — | — | — | 19,836 | |||||||||||||||||||||||||||||||||||||||||||||
| Increase/deduction for change in fair value from prior year-end to vesting date of awards granted prior to year that vested during year |
— | — | — | (46,666 | ) | 7,331 | (24,106 | ) | (20,007 | ) | (19,238 | ) | (6,270 | ) | — | (13,035 | ) | (10,380 | ) | (18,337 | ) | (7,086 | ) | 4,978 | ||||||||||||||||||||||||||||||||||||
| Deduction of fair value of awards granted prior to year that were forfeited during year | — | — | — | — | — | (90,937 | ) | — | — | — | — | — | — | — | — | — | ||||||||||||||||||||||||||||||||||||||||||||
| Increase based on dividends or other earnings paid during year prior to vesting date of award | — | — | — | 11,890 | 21,500 | 2,132 | 4,939 | 7,914 | 10,888 | — | — | 2,316 | 7,041 | 11,409 | 13,092 | |||||||||||||||||||||||||||||||||||||||||||||
Total adjustments |
$ | — | — | — | (221,399 | ) | 69,932 | $ | (186,692 | ) | 217,439 | (35,258 | ) | 64,852 | — | $ | (32,078 | ) | 97,060 | (64,426 | ) | 71,304 | 62,983 | |||||||||||||||||||||||||||||||||||||
CAP versus Cumulative TSR and Peer Group Cumulative TSR
CAP versus Company Net Income
CAP versus Company ROAA
CAP versus Cumulative TSR and Peer Group Cumulative TSR
Performance Measures
The SEC’s rules require that the pay versus performance disclosure include an unranked list of three to seven performance measures that the Company considers to be its most important measures used to align compensation actually paid to the NEOs to a company’s performance. In our assessment, the most important financial performance measures used to link CAP, as calculated in accordance with the SEC rules, to our NEOs in 2025 to our performance were:
| • | ROAA; |
| • | ROAE; and |
| • | Efficiency ratio. |