Pay vs Performance Disclosure - USD ($)
Dec. 31, 2025
Dec. 31, 2024
Dec. 31, 2023
Dec. 31, 2022
Dec. 31, 2021
Pay Versus Performance
In accordance with SEC rules, this section provides information with respect to Compensation Actually Paid (“CAP”) to our NEOs and Company performance. This information does not necessarily align with how the Company, or the MDC Committee views the link between the Company’s performance and its NEO’s pay. CAP is an SEC-defined term and neither CAP nor the amount reported in the Summary Compensation Table (“SCT”) necessarily reflect the amounts earned, received, or realized by the NEOs. Unvested awards remain subject to vesting conditions and fluctuations in value based on changes in the price of our common stock, and the ultimate value realized by our NEOs from unvested equity awards will not be determined until the awards vest. In addition, a significant portion of CAP relates to changes in fair value of unvested awards over the course of each year. For a more detailed discussion of how we view our executive compensation structure, including alignment with our performance, see the Compensation Discussion and Analysis (“CD&A”).
Year | Summary Compensation Table Total for CEO(1) | Compensation Actually Paid to CEO(3,4) | Average Summary Compensation Table Total for Other NEOs(2) | Average Compensation Actually Paid to Other NEOs(3,4) | Value of Initial Fixed $100 Investment Based on(5) | Net Income (in millions)(6) | Revenue (in millions)(7) | |||||||||||||||||||
Total Shareholder Return | Peer Group Total Shareholder Return | |||||||||||||||||||||||||
2025 | $5,063,608 | $11,051,255 | $1,135,806 | $1,957,715 | $124 | $201 | $25.3 | $648.9 | ||||||||||||||||||
2024 | $2,909,301 | $6,901,739 | $1,064,125 | $2,025,656 | $71 | $190 | $10.1 | $624.6 | ||||||||||||||||||
2023 | $4,176,075 | $2,982,535 | $1,056,661 | $778,190 | $32 | $142 | ($53.3) | $600.5 | ||||||||||||||||||
2022 | $3,359,173 | $826,912 | $864,041 | $345,804 | $40 | $105 | ($115.0) | $606.3 | ||||||||||||||||||
2021 | $2,994,052 | $1,963,734 | $953,983 | $673,074 | $73 | $85 | $17.8 | $418.8 | ||||||||||||||||||
(1) | Ms. Selden was the CEO for each of the covered years. |
(2) | The other NEOs for each covered year were: In 2025, Mr. Codispoti, Mr. Fernandes, Mr. Arnold, Mr. Beckett, and Mr. Sunderland; in 2024, Mr. Sunderland, Mr. Beckett, Mr. Fernandes, and Mr. MacGibbon; in 2023, Mr. Sunderland, Mr. Beckett, Mr. Fernandes, Mr. MacGibbon, and Mr. Tognola; in 2022, Mr. Sunderland, Mr. Beckett, Mr. Wilkins, Mr. Tognola, Mr. Dyberg, and Mr. Slagle; and in 2021, Mr. Sunderland, Mr. Beckett, Dr. Dyke, Mr. Dyberg, and Dr. Smith. |
(3) | The following tables disclose the amounts deducted from and added to SCT total compensation for the applicable year pursuant to Item 402(v) of Regulation S-K to determine CAP: |
Adjustments made to NEO SCT to calculate CAP
Year | Reported SCT total | minus reported value of equity awards | plus, equity award adjustments | equals CAP | ||||||||||
CEO | ||||||||||||||
2025 | $5,063,608 | ($3,103,874) | $9,091,521 | $11,051,255 | ||||||||||
Other NEOs | ||||||||||||||
2025 | $1,135,806 | ($431,947) | $1,253,856 | $1,957,715 | ||||||||||
(4) | Adjustments made to NEO equity awards |
Year | Year-end FMV awards granted during the year | Year over year FMV change of outstanding and unvested awards as of year end | Year over year FMV change of awards granted in prior years that vested during the year | Total equity award adjustments | ||||||||||
CEO | ||||||||||||||
2025 | $6,388,456 | $12,088 | $2,690,978 | $9,091,521 | ||||||||||
Other NEOs | ||||||||||||||
2025 | $822,202 | $24,804 | $406,850 | $1,253,856 | ||||||||||
• | Fair market value (“FMV”) used to determine the equity award adjustments is consistent with the calculations used to account for share-based payments in the Company’s financial statements in accordance with GAAP, although the assumptions are materially different from those disclosed with respect to valuation at the time of grant including: |
• | RSUs: The FMV of RSU awards was calculated using the closing price of our common stock as of the last day of the applicable year or on the date of vesting, as applicable. |
• | PSUs: The number of “earned” units was calculated by multiplying the target units by the applicable performance achievement percentage for a given year. The FMV of PSU awards was calculated using the closing price of our common stock as of the last day of the applicable year or on the date of vesting, as applicable, multiplied by the number of “earned” units. |
• | Stock Option Awards: Option awards use a model consistent with the fair value methodology used to account for share-based payments in the Company’s financial statements in accordance with GAAP. The FMV value of the options was estimated using the Black-Scholes option pricing model that reflect for each award and valuation date, adjustments for expected volatility, risk-free interest rate, dividend yield, and expected term. |
(5) | Reflects Total Shareholder Return (“TSR”) for the Company and the Company’s customized peer group of companies as reported in the Company’s Annual Report on Form 10-K for the fiscal year ended December 31, 2025. Historical stock performance is not necessarily indicative of future stock performance. |
(6) | Represents the amount of net income reflected in our audited financial statements for each applicable fiscal year. For the purposes of this table, “net income” represents “net income available to common stockholders” as reported in the Company’s financial statements. |
(7) | SEC rules require us to designate a “company-selected measure” that in our assessment represents the most important financial performance measure (other than TSR, stock price, or net income) used by the Company to link the CAP of our NEOs, for the most recently completed fiscal year, to our performance. We selected revenue as the most important financial performance measurement due to the alignment with the Company’s long-term strategic goals, including its direct linkage to enrollments. Revenue is defined as the Company’s GAAP revenue as reported. |
(1) | Ms. Selden was the CEO for each of the covered years. |
(2) | The other NEOs for each covered year were: In 2025, Mr. Codispoti, Mr. Fernandes, Mr. Arnold, Mr. Beckett, and Mr. Sunderland; in 2024, Mr. Sunderland, Mr. Beckett, Mr. Fernandes, and Mr. MacGibbon; in 2023, Mr. Sunderland, Mr. Beckett, Mr. Fernandes, Mr. MacGibbon, and Mr. Tognola; in 2022, Mr. Sunderland, Mr. Beckett, Mr. Wilkins, Mr. Tognola, Mr. Dyberg, and Mr. Slagle; and in 2021, Mr. Sunderland, Mr. Beckett, Dr. Dyke, Mr. Dyberg, and Dr. Smith. |
(5) | Reflects Total Shareholder Return (“TSR”) for the Company and the Company’s customized peer group of companies as reported in the Company’s Annual Report on Form 10-K for the fiscal year ended December 31, 2025. Historical stock performance is not necessarily indicative of future stock performance. |
(3) | The following tables disclose the amounts deducted from and added to SCT total compensation for the applicable year pursuant to Item 402(v) of Regulation S-K to determine CAP: |
Adjustments made to NEO SCT to calculate CAP
Year | Reported SCT total | minus reported value of equity awards | plus, equity award adjustments | equals CAP | ||||||||||
CEO | ||||||||||||||
2025 | $5,063,608 | ($3,103,874) | $9,091,521 | $11,051,255 | ||||||||||
Other NEOs | ||||||||||||||
2025 | $1,135,806 | ($431,947) | $1,253,856 | $1,957,715 | ||||||||||
(4) | Adjustments made to NEO equity awards |
Year | Year-end FMV awards granted during the year | Year over year FMV change of outstanding and unvested awards as of year end | Year over year FMV change of awards granted in prior years that vested during the year | Total equity award adjustments | ||||||||||
CEO | ||||||||||||||
2025 | $6,388,456 | $12,088 | $2,690,978 | $9,091,521 | ||||||||||
Other NEOs | ||||||||||||||
2025 | $822,202 | $24,804 | $406,850 | $1,253,856 | ||||||||||
• | Fair market value (“FMV”) used to determine the equity award adjustments is consistent with the calculations used to account for share-based payments in the Company’s financial statements in accordance with GAAP, although the assumptions are materially different from those disclosed with respect to valuation at the time of grant including: |
• | RSUs: The FMV of RSU awards was calculated using the closing price of our common stock as of the last day of the applicable year or on the date of vesting, as applicable. |
• | PSUs: The number of “earned” units was calculated by multiplying the target units by the applicable performance achievement percentage for a given year. The FMV of PSU awards was calculated using the closing price of our common stock as of the last day of the applicable year or on the date of vesting, as applicable, multiplied by the number of “earned” units. |
• | Stock Option Awards: Option awards use a model consistent with the fair value methodology used to account for share-based payments in the Company’s financial statements in accordance with GAAP. The FMV value of the options was estimated using the Black-Scholes option pricing model that reflect for each award and valuation date, adjustments for expected volatility, risk-free interest rate, dividend yield, and expected term. |
Relationship Between CAP and Company and Peer Group TSR
The following graph compares the CAP to our CEO and the average CAP to our Other NEOs to our cumulative TSR and also compares our cumulative TSR and 2025 Annual Report customized peer group cumulative TSR. The cumulative TSR amounts in the graph assume an initial investment of $100 on December 31, 2020.
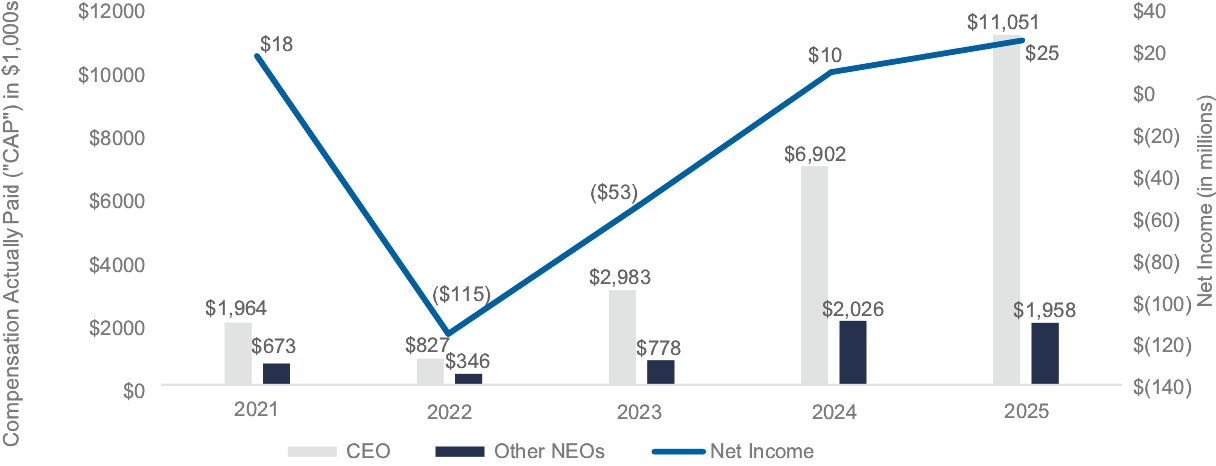
Relationship Between CAP and Company Financial Measures CAP versus Net Income
The following graph compares the CAP to our CEO and the average CAP to our Other NEOs to net income.
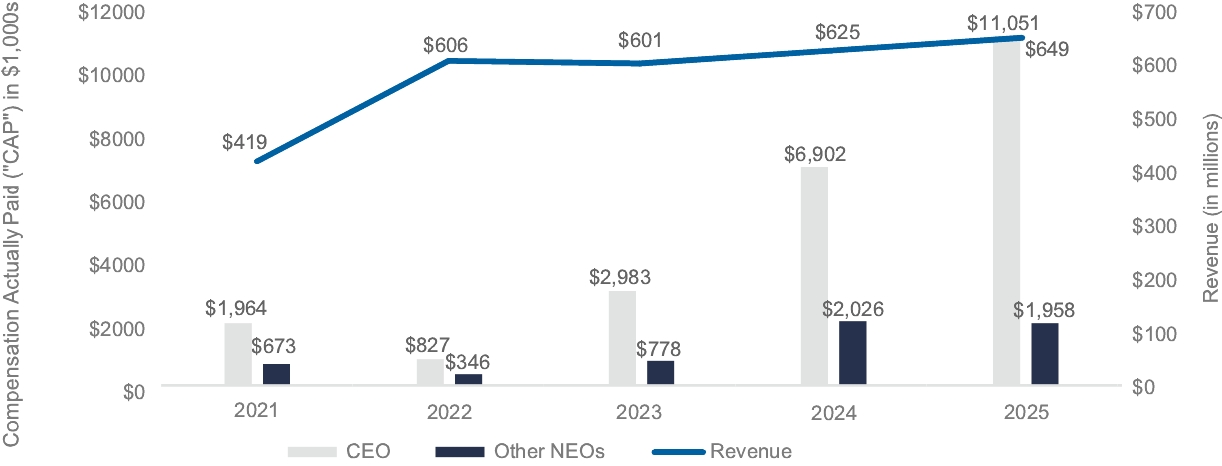
CAP versus Revenue
The following graph compares the CAP to our CEO and the average CAP to our Other NEOs to revenue.
Relationship Between CAP and Company and Peer Group TSR
The following graph compares the CAP to our CEO and the average CAP to our Other NEOs to our cumulative TSR and also compares our cumulative TSR and 2025 Annual Report customized peer group cumulative TSR. The cumulative TSR amounts in the graph assume an initial investment of $100 on December 31, 2020.
Most Important Performance Measures
The Company’s 2025 short-term annual incentive cash and long-term equity incentive compensation plans included the three measures listed below that the MDC Committee considers to be the most important measures to link CAP to Company performance. The order of the table below does not reflect any ranking of importance. Additional details regarding the 2025 incentive plan performance measures, including performance targets, payout opportunities, and weighting of each measure by NEO are further described in Compensation Discussion and Analysis within the sections titled “2025 Compensation Decisions — 2025 Annual Incentive Plan” and “2025 Compensation Decisions — 2025 Equity Incentives”.
2025 Most Important Performance Measures | ||
Revenue (financial) | ||
EPS (financial) | ||
Adjusted EBITDA (financial) | ||
(4) | Adjustments made to NEO equity awards |
Year | Year-end FMV awards granted during the year | Year over year FMV change of outstanding and unvested awards as of year end | Year over year FMV change of awards granted in prior years that vested during the year | Total equity award adjustments | ||||||||||
CEO | ||||||||||||||
2025 | $6,388,456 | $12,088 | $2,690,978 | $9,091,521 | ||||||||||
Other NEOs | ||||||||||||||
2025 | $822,202 | $24,804 | $406,850 | $1,253,856 | ||||||||||
• | Fair market value (“FMV”) used to determine the equity award adjustments is consistent with the calculations used to account for share-based payments in the Company’s financial statements in accordance with GAAP, although the assumptions are materially different from those disclosed with respect to valuation at the time of grant including: |
• | RSUs: The FMV of RSU awards was calculated using the closing price of our common stock as of the last day of the applicable year or on the date of vesting, as applicable. |
• | PSUs: The number of “earned” units was calculated by multiplying the target units by the applicable performance achievement percentage for a given year. The FMV of PSU awards was calculated using the closing price of our common stock as of the last day of the applicable year or on the date of vesting, as applicable, multiplied by the number of “earned” units. |
• | Stock Option Awards: Option awards use a model consistent with the fair value methodology used to account for share-based payments in the Company’s financial statements in accordance with GAAP. The FMV value of the options was estimated using the Black-Scholes option pricing model that reflect for each award and valuation date, adjustments for expected volatility, risk-free interest rate, dividend yield, and expected term. |