v3.26.1
Shareholder Report
6 Months Ended
Jan. 31, 2026
USD ($)
Holdings
Shareholder Report [Line Items]  
Document Type N-CSRS
Amendment Flag false
Registrant Name Tidal Trust II
Entity Central Index Key 0001924868
Entity Investment Company Type N-1A
Document Period End Date Jan. 31, 2026
Shareholder Report Annual or Semi-Annual semi-annual shareholder report
Grizzle Growth ETF  
Shareholder Report [Line Items]  
Fund Name Grizzle Growth ETF
Class Name Grizzle Growth ETF
Trading Symbol DARP
Security Exchange Name NYSEArca
Annual or Semi-Annual Statement [Text Block] This semi-annual shareholder report contains important information about the Grizzle Growth ETF (the "Fund") for the period August 1, 2025 to January 31, 2026.
Shareholder Report Annual or Semi-Annual semi-annual shareholder report
Additional Information [Text Block] You can find additional information about the Fund at www.etf.grizzle.com. You can also request this information by contacting us at 1-800-617-0004 or by writing to the Grizzle Growth ETF c/o U.S. Bank Global Fund Services, P.O. Box 701, Milwaukee, Wisconsin 53201-0701.
Additional Information Phone Number 1-800-617-0004
Additional Information Website www.etf.grizzle.com
Expenses [Text Block]

What were the Fund costs for the past six months?
(based on a hypothetical $10,000 investment)

Fund Name
Costs of a $10,000 investment
Costs paid as a percentage of a $10,000 investment
Grizzle Growth ETF
$44
0.75%*
*Costs paid as a percentage of a $10,000 investment is an annualized figure.
Expenses Paid, Amount $ 44
Expense Ratio, Percent 0.75% [1]
Net Assets $ 18,957,000
Holdings Count | Holdings 40
Advisory Fees Paid, Amount $ 41,659
Investment Company, Portfolio Turnover 32.00%
Additional Fund Statistics [Text Block]

Key Fund Statistics

(as of January 31, 2026)

Fund Size (Thousands)
$18,957
Number of Holdings
40
Total Advisory Fee
$41,659
Portfolio Turnover
32%


Holdings [Text Block]

Sector Breakdown
(% of Total Net Assets)

Sector
% of Total Net Assets
Technology
35.0%
Communications
34.1%
Industrial
16.4%
Basic Materials
8.8%
Energy
1.8%
Consumer, Non-cyclical
1.0%
Consumer, Cyclical
0.9%
Financial
0.7%
Cash & Other
1.3%
bar

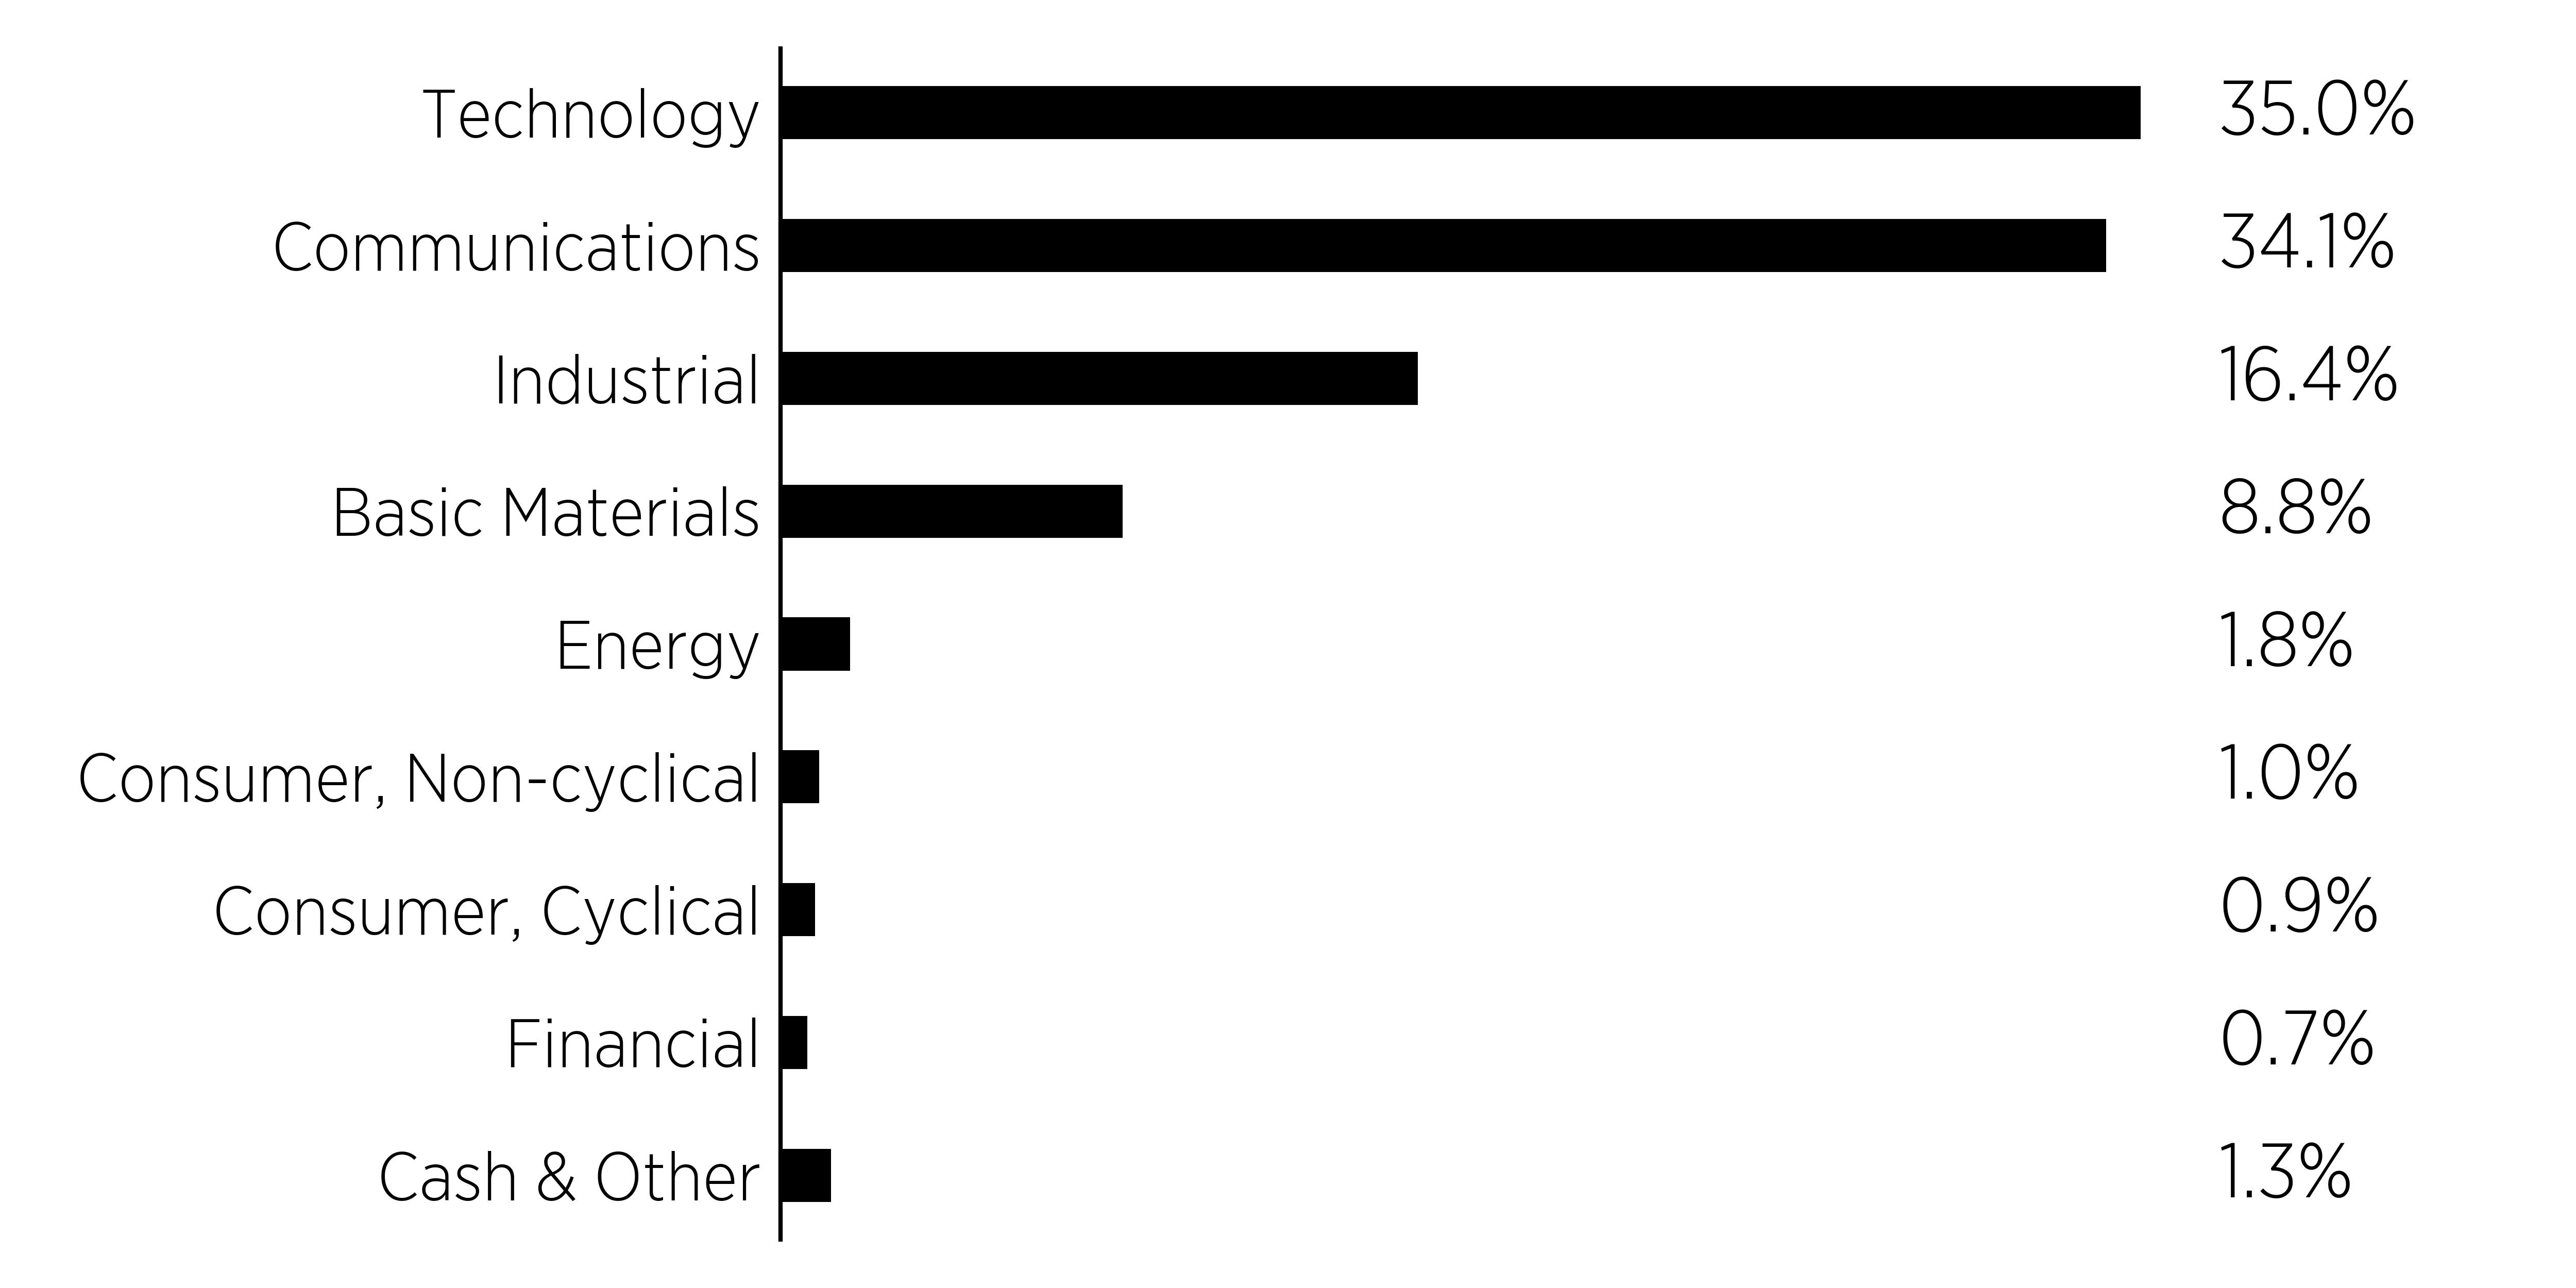
Percentages are based on total net assets. Cash & Cash Equivalents represents cash, short-term investments and liabilities in excess of other assets.

Largest Holdings [Text Block]

What did the Fund invest in?

(as of January 31, 2026)

Top 10 Holdings
(% of net assets)
Alphabet, Inc. - Class A
15.0
NVIDIA Corp.
10.3
Micron Technology, Inc.
7.6
Vertiv Holdings Co. - Class A
6.2
GE Vernova, Inc.
4.3
Amazon.com, Inc.
4.3
Arista Networks, Inc.
3.6
Coherent Corp.
3.6
Ciena Corp.
3.2
Meta Platforms, Inc. - Class A
3.1


[1] Costs paid as a percentage of a $10,000 investment is an annualized figure.