Pay vs Performance Disclosure - USD ($)
Dec. 31, 2025
Dec. 31, 2024
Pay Versus Performance
In accordance with rules adopted by the SEC pursuant to the Dodd-Frank Wall Street Reform and Consumer Protection Act of 2010, we provide the following disclosure regarding executive “compensation actually paid” (“CAP”), as calculated per the SEC disclosure rules, and certain measures of Company performance for the fiscal years listed below. As permitted under the rules applicable to smaller reporting companies, we are not including a peer group total shareholder return or company-selected measure, as contemplated under Item 402(v) of Regulation
S-K.
| Year (1) |
Summary Compensation Table Total for PEO ($) (2) |
Compensation Actually Paid to PEO ($) (3) |
Average Summary Compensation Table Total for Non-PEO NEOs ($) (2) |
Average Compensation Actually Paid to Non-PEO NEOs ($) (3) |
Value of Initial Fixed $100 Investment Based On Total Shareholder Return ($) (4) |
Net Income ($ in millions) | ||||||||||||||||||||||||
| 2025 |
$ | 2,238,470 | $ | 666,305 | $ | 984,646 | $ | 536,035 | $ | 18.48 | $ | (35.27 | ) | |||||||||||||||||
| 2024 |
$ | 2,084,873 | $ | 1,735,646 | $ | 888,091 | $ | 823,556 | $ | 83.15 | $ | (42.93 | ) | |||||||||||||||||
| (1) | Mr. Hutton has served as the Principal Executive Officer (“PEO”) for the entirety of 2024 and 2025. Our other named executive officers (“NEOs”) for the applicable years were Robin Harper Cowie and Kieran O’Kane. |
| (2) | Amounts reported in this column represent (i) the total compensation reported in the Summary Compensation Table for the applicable year in the case of Mr. Hutton and (ii) the average of the total compensation reported in the Summary Compensation Table for the applicable year for our other named executive officers reported for the applicable year other than Mr. Hutton. |
| (3) | To calculate CAP, adjustments were made to the amounts reported in the Summary Compensation Table for the applicable year. A reconciliation of the adjustments for Mr. Hutton, and for the average of the other named executive officers, is set forth following the footnotes to this table. |
| (4) | Pursuant to rules of the SEC, the comparison assumes $100 was invested on December 31, 2023 in our common stock. Historic stock price performance is not necessarily indicative of future stock price performance. |
2025 |
2024 | |||||||||||||||||||
Scott Hutton |
Average Non-PEO NEOs |
Scott Hutton |
Average Non-PEO NEOs | |||||||||||||||||
Total Compensation from Summary Compensation Table |
$ | 2,238,470 | $ | 984,646 | $ | 2,084,873 | $ | 888,091 | ||||||||||||
Adjustments for Equity Awards |
||||||||||||||||||||
Adjustment for grant date values in the Summary Compensation Table |
$ | (881,286 | ) | $ | (267,229 | ) | $ | (1,271,161 | ) | $ | (357,189 | ) | ||||||||
Year-end fair value of unvested awards granted in the current year |
$ | 230,947 | $ | 70,029 | $ | 755,703 | $ | 230,890 | ||||||||||||
Year-over-year difference of year-end fair values for unvested awards granted in prior years |
$ | (936,529 | ) | $ | (239,828 | ) | $ | (201,625 | ) | $ | (41,724 | ) | ||||||||
Fair values at vest date for awards granted and vested in current year |
$ | 313,406 | $ | 63,183 | $ | 367,841 | $ | 104,043 | ||||||||||||
Difference in fair values between prior year-end fair values and vest |
$ | (298,673 | ) | $ | (74,690 | ) | $ | 15 | $ | (555 | ) | |||||||||
Forfeitures during current year equal to prior year-end fair value |
$ | (30 | ) | $ | (76 | ) | $ | 0 | $ | 0 | ||||||||||
Dividends or dividend equivalents not otherwise included in total compensation |
$ | 0 | $ | 0 | $ | 0 | $ | 0 | ||||||||||||
Total Adjustments for Equity Awards |
$ | (690,879 | ) | $ | (181,382 | ) | $ | 921,934 | $ | 292,654 | ||||||||||
Compensation Actually Paid (as calculated) |
$ | 666,305 | $ | 536,035 | $ | 1,735,646 | $ | 823,556 | ||||||||||||
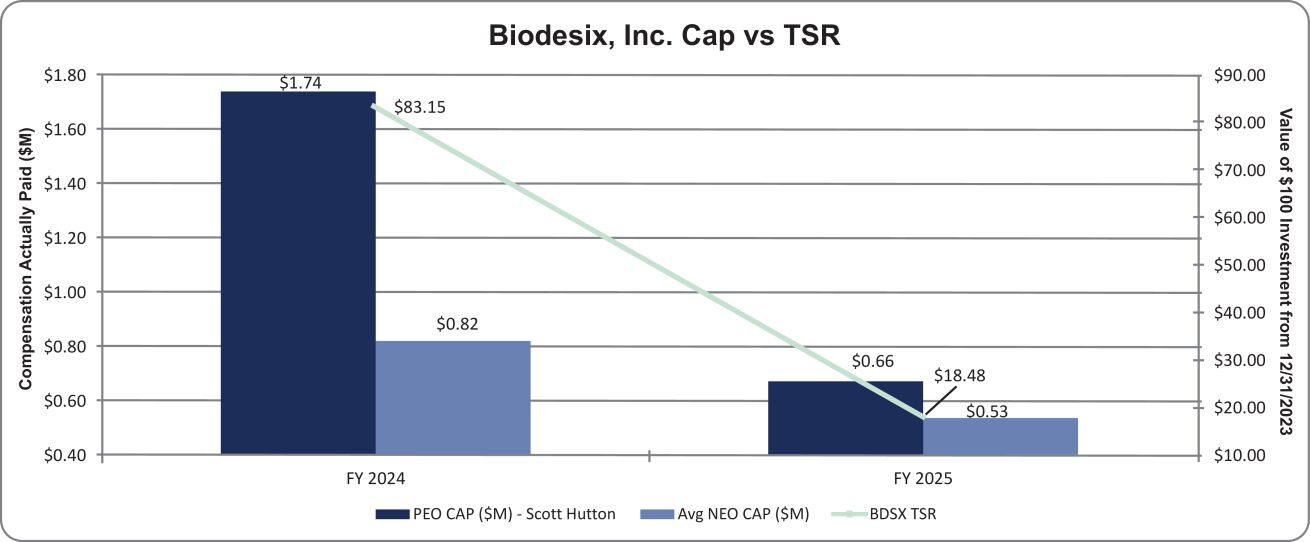
CAP and Cumulative TSR
CAP and Company Net Income
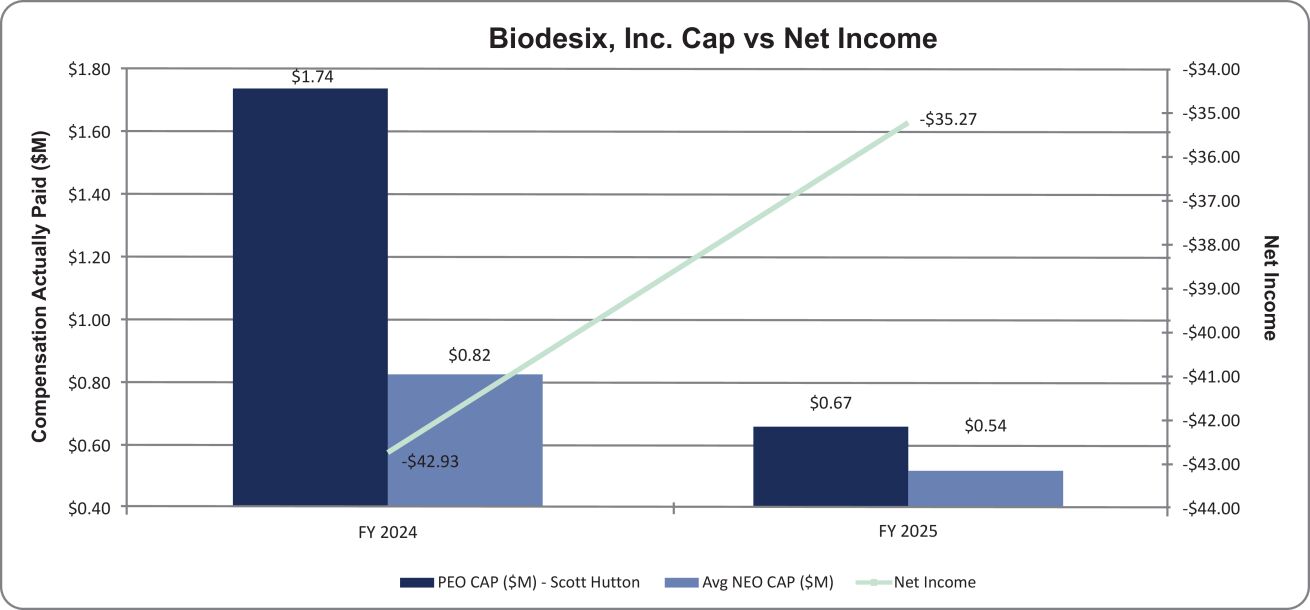
Relationship Between Pay and Performance
The illustrations below provide a graphical description of CAP (as calculated in accordance with the SEC rules) and the following measures:
| • | the Company’s cumulative Total Stockholder Return (“TSR”); and |
| • | the Company’s Net Income |