Pay vs Performance Disclosure - USD ($)
Dec. 31, 2025
Dec. 31, 2024
Dec. 31, 2023
Dec. 31, 2022
Dec. 31, 2021
Dec. 29, 2023
Dec. 30, 2022
PAY VERSUS PERFORMANCE
In accordance with rules adopted by the SEC pursuant to the Dodd-Frank Wall Street Reform and Consumer Protection Act of 2010 and Item 402(v) of Regulation S-K, we provide the following disclosure regarding executive compensation and Company performance for fiscal years listed below. The Compensation Committee did not consider the pay versus performance disclosure below in making its pay decisions for any of the fiscal years shown.
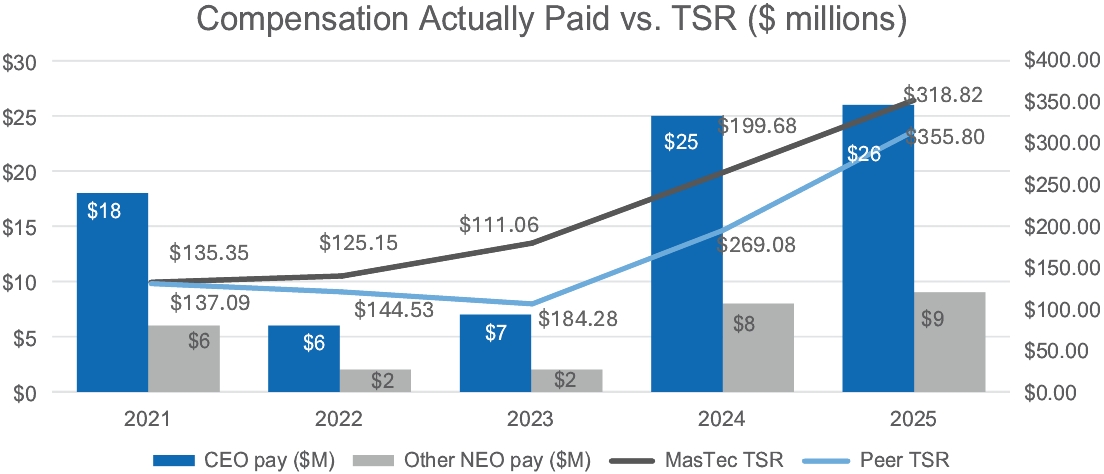
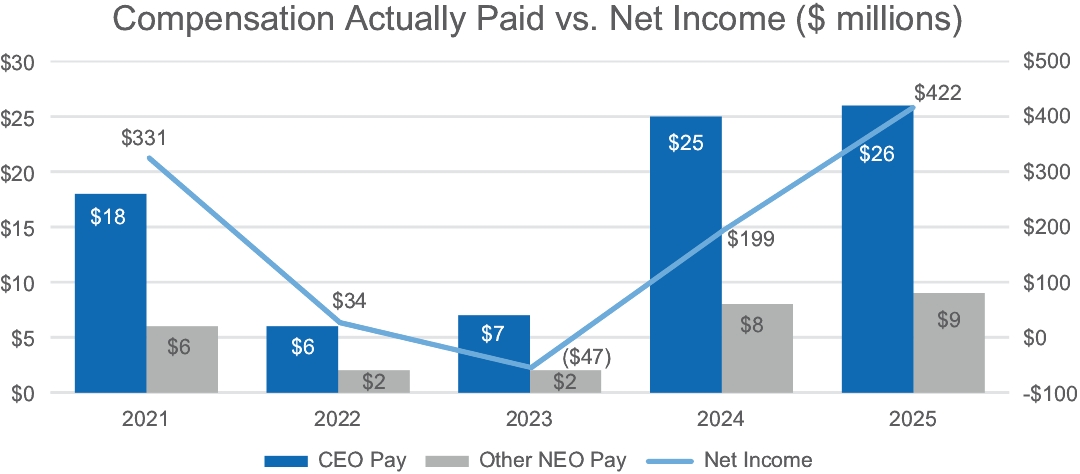
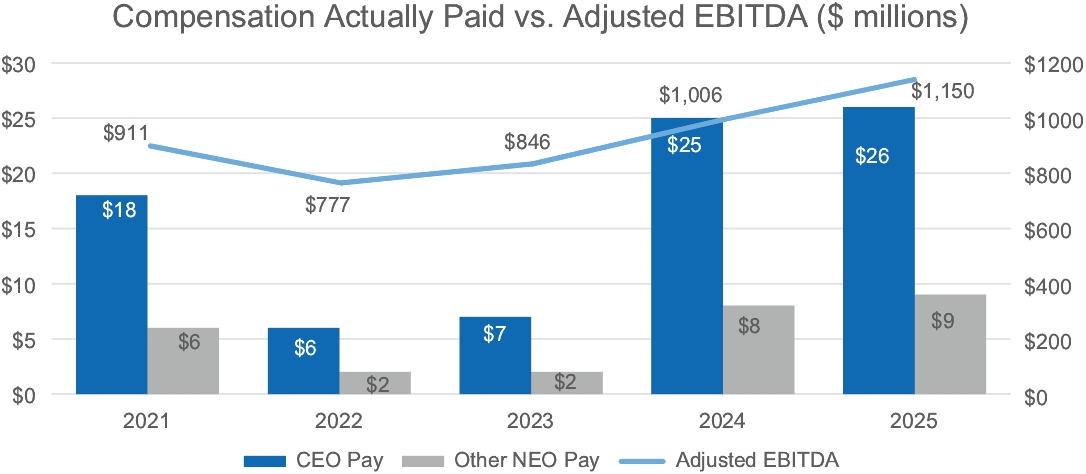
Year | SCT Total Compensation for CEO (1) | Compensation Actually Paid to CEO (2) | Average SCT Total Compensation for Other NEOs (1) | Average Compensation Actually Paid to Other NEOs (2) | Total Shareholder Return (Value of initial fixed $100 investment) (3) | Peer Group Total Shareholder Return (Value of initial fixed $100 investment) (3) (4) | Net Income ($M) | Adjusted EBITDA ($M) (5) | ||||||||||||||||||
2025 | $11,544,386 | $26,033,429 | $4,425,213 | $8,518,619 | $318.82 | $355.80 | $422.0 | $1,150.1 | ||||||||||||||||||
2024 | $10,797,857 | $25,439,988 | $4,057,406 | $7,957,425 | $199.68 | $269.08 | $199.4 | $1,005.6 | ||||||||||||||||||
2023 | $9,603,683 | $7,164,886 | $2,799,775 | $2,179,567 | $111.06 | $184.28 | ($47.3) | $846.4 | ||||||||||||||||||
2022 | $9,640,917 | $6,253,204 | $3,575,026 | $2,490,855 | $125.15 | $144.53 | $33.9 | $777.2 | ||||||||||||||||||
2021 | $9,122,897 | $18,004,904 | $3,501,026 | $6,340,351 | $135.35 | $137.09 | $330.7 | $910.8 | ||||||||||||||||||
(1) | The CEO for each of 2021, 2022, 2023, 2024 and 2025 was Jose R. Mas. The Other NEOs for each of 2021 and 2022 were Robert Apple, George Pita (CFO), and Alberto de Cardenas. The Other NEOs for 2023 were Robert E. Apple, Paul DiMarco (EVP and CFO), George Pita (who retired as CFO during 2023) and Alberto de Cardenas. The Other NEOs for 2024 and 2025 were Robert E. Apple, Paul DiMarco (EVP and CFO), and Alberto de Cardenas. |
(2) | Compensation Actually Paid reflects the exclusions and inclusions for the CEO and the Other NEOs set forth below. The amounts excluded represent the Stock Awards amounts from the applicable Summary Compensation Table. Amounts included are the aggregate of the following components, as applicable: (i) the fair value as of the end of the fiscal year of unvested equity awards granted in that year; (ii) the change in fair value during the year of equity awards granted in prior years that remained outstanding and unvested at the end of the year; (iii) the fair value, as of the vesting date, of equity awards granted in that year that also vested in that year; and (iv) the change in fair value during the year through the vesting date of equity awards granted in prior years that vested during that year, less (iv) the fair value at the end of the prior year of awards granted prior to the year that failed to meet applicable vesting conditions during the year. Equity values are calculated in accordance with FASB ASC Topic 718. |
CEO Adjustments to SCT
Adjustments to SCT | 2025 | 2024 | 2023 | 2022 | 2021 | ||||||||||||
Excluded: Stock awards reported in Summary Compensation Table for our CEO | $8,000,000 | $7,500,000 | $7,000,000 | $7,000,000 | $5,500,000 | ||||||||||||
Included: Change in fair value of current year equity for our CEO | $5,737,916 | $8,401,608 | $6,136,122 | $6,220,728 | $5,839,202 | ||||||||||||
Included: Change in fair value of prior year unvested equity for our CEO | $17,517,412 | $13,124,191 | ($1,865,349) | ($1,989,229) | $6,955,429 | ||||||||||||
Included: Change in fair value of prior award that vested in 2025 for our CEO | ($766,284) | $616,333 | $290,430 | ($619,212) | $1,587,377 | ||||||||||||
Other NEO Adjustments to SCT
Adjustments to SCT | 2025 | 2024 | 2023 | 2022 | 2021 | ||||||||||||
Excluded: Average Stock awards reported in Summary Compensation Table for our Other NEOs | $2,716,667 | $2,516,667 | $1,700,000 | $2,300,000 | $1,866,667 | ||||||||||||
Included: Change in fair value of current year equity for Other NEOs | $1,948,432 | $2,819,187 | $1,490,245 | $2,043,909 | $1,981,805 | ||||||||||||
Included: Change in fair value of prior year unvested equity for Other NEOs | $5,054,456 | $3,470,404 | ($478,367) | ($608,361) | $2,153,528 | ||||||||||||
Included: Change in fair value of prior award that vested in 2025 for Other NEOs | ($192,815) | $127,095 | $67,913 | ($219,719) | $570,659 | ||||||||||||
Change in fair value of stock is based upon closing share prices on December 31, 2021, of $92.28, on December 30, 2022, the last trading day of 2022, of $85.33, on December 29, 2023, the last trading day of 2023, of $75.72, on December 31, 2024, of $136.14 and on December 31, 2025 of $217.37. |
(3) | TSR is the change in stock price from the last trading day prior to the earliest year in the table through the last trading day of the applicable year in the table. The Peer Group TSR is the TSR of the group identified for the years measured, weighted according to the respective peer companies’ stock market capitalization at the beginning of each period for which the TSR is calculated. See page 36 for our Peer Group. |
(4) | Our Peer Group TSR value of initial fixed $100 investment is: $137.09 for 2021, $144.53 for 2022, $184.28 for 2023, $269.08 for 2024 and $355.80 for 2025. |
(5) | We determined adjusted EBITDA to be the “most important” financial performance measure used to link performance to Compensation Actually Paid to our CEO and Other NEOs in fiscal 2025, in accordance with Item 402(v) of Regulation S-K. Adjusted EBITDA is a non-GAAP financial measure. For a description of the rationale for our presentation of adjusted EBITDA and a reconciliation of net income to adjusted EBITDA, please see the Non-GAAP Reconciliations. |
(1) | The CEO for each of 2021, 2022, 2023, 2024 and 2025 was Jose R. Mas. The Other NEOs for each of 2021 and 2022 were Robert Apple, George Pita (CFO), and Alberto de Cardenas. The Other NEOs for 2023 were Robert E. Apple, Paul DiMarco (EVP and CFO), George Pita (who retired as CFO during 2023) and Alberto de Cardenas. The Other NEOs for 2024 and 2025 were Robert E. Apple, Paul DiMarco (EVP and CFO), and Alberto de Cardenas. |
(3) | TSR is the change in stock price from the last trading day prior to the earliest year in the table through the last trading day of the applicable year in the table. The Peer Group TSR is the TSR of the group identified for the years measured, weighted according to the respective peer companies’ stock market capitalization at the beginning of each period for which the TSR is calculated. See page 36 for our Peer Group. |
(4) | Our Peer Group TSR value of initial fixed $100 investment is: $137.09 for 2021, $144.53 for 2022, $184.28 for 2023, $269.08 for 2024 and $355.80 for 2025. |
(2) | Compensation Actually Paid reflects the exclusions and inclusions for the CEO and the Other NEOs set forth below. The amounts excluded represent the Stock Awards amounts from the applicable Summary Compensation Table. Amounts included are the aggregate of the following components, as applicable: (i) the fair value as of the end of the fiscal year of unvested equity awards granted in that year; (ii) the change in fair value during the year of equity awards granted in prior years that remained outstanding and unvested at the end of the year; (iii) the fair value, as of the vesting date, of equity awards granted in that year that also vested in that year; and (iv) the change in fair value during the year through the vesting date of equity awards granted in prior years that vested during that year, less (iv) the fair value at the end of the prior year of awards granted prior to the year that failed to meet applicable vesting conditions during the year. Equity values are calculated in accordance with FASB ASC Topic 718. |
CEO Adjustments to SCT
Adjustments to SCT | 2025 | 2024 | 2023 | 2022 | 2021 | ||||||||||||
Excluded: Stock awards reported in Summary Compensation Table for our CEO | $8,000,000 | $7,500,000 | $7,000,000 | $7,000,000 | $5,500,000 | ||||||||||||
Included: Change in fair value of current year equity for our CEO | $5,737,916 | $8,401,608 | $6,136,122 | $6,220,728 | $5,839,202 | ||||||||||||
Included: Change in fair value of prior year unvested equity for our CEO | $17,517,412 | $13,124,191 | ($1,865,349) | ($1,989,229) | $6,955,429 | ||||||||||||
Included: Change in fair value of prior award that vested in 2025 for our CEO | ($766,284) | $616,333 | $290,430 | ($619,212) | $1,587,377 | ||||||||||||
Change in fair value of stock is based upon closing share prices on December 31, 2021, of $92.28, on December 30, 2022, the last trading day of 2022, of $85.33, on December 29, 2023, the last trading day of 2023, of $75.72, on December 31, 2024, of $136.14 and on December 31, 2025 of $217.37. |
(2) | Compensation Actually Paid reflects the exclusions and inclusions for the CEO and the Other NEOs set forth below. The amounts excluded represent the Stock Awards amounts from the applicable Summary Compensation Table. Amounts included are the aggregate of the following components, as applicable: (i) the fair value as of the end of the fiscal year of unvested equity awards granted in that year; (ii) the change in fair value during the year of equity awards granted in prior years that remained outstanding and unvested at the end of the year; (iii) the fair value, as of the vesting date, of equity awards granted in that year that also vested in that year; and (iv) the change in fair value during the year through the vesting date of equity awards granted in prior years that vested during that year, less (iv) the fair value at the end of the prior year of awards granted prior to the year that failed to meet applicable vesting conditions during the year. Equity values are calculated in accordance with FASB ASC Topic 718. |
Other NEO Adjustments to SCT
Adjustments to SCT | 2025 | 2024 | 2023 | 2022 | 2021 | ||||||||||||
Excluded: Average Stock awards reported in Summary Compensation Table for our Other NEOs | $2,716,667 | $2,516,667 | $1,700,000 | $2,300,000 | $1,866,667 | ||||||||||||
Included: Change in fair value of current year equity for Other NEOs | $1,948,432 | $2,819,187 | $1,490,245 | $2,043,909 | $1,981,805 | ||||||||||||
Included: Change in fair value of prior year unvested equity for Other NEOs | $5,054,456 | $3,470,404 | ($478,367) | ($608,361) | $2,153,528 | ||||||||||||
Included: Change in fair value of prior award that vested in 2025 for Other NEOs | ($192,815) | $127,095 | $67,913 | ($219,719) | $570,659 | ||||||||||||
Change in fair value of stock is based upon closing share prices on December 31, 2021, of $92.28, on December 30, 2022, the last trading day of 2022, of $85.33, on December 29, 2023, the last trading day of 2023, of $75.72, on December 31, 2024, of $136.14 and on December 31, 2025 of $217.37. |
PERFORMANCE MEASURES
The following table lists the most important financial measures used by us to link compensation actually paid to our named executive officers for 2025 to company performance.
Financial Performance Measures | ||
Adjusted EBITDA | ||
Return on Invested Capital | ||
Three Year Revenue Growth | ||
Three Year Earnings per Share Growth | ||
(5) | We determined adjusted EBITDA to be the “most important” financial performance measure used to link performance to Compensation Actually Paid to our CEO and Other NEOs in fiscal 2025, in accordance with Item 402(v) of Regulation S-K. Adjusted EBITDA is a non-GAAP financial measure. For a description of the rationale for our presentation of adjusted EBITDA and a reconciliation of net income to adjusted EBITDA, please see the Non-GAAP Reconciliations. |