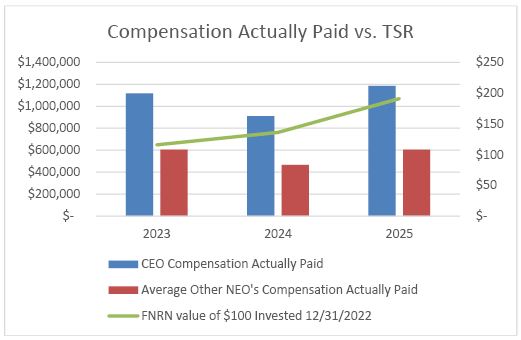
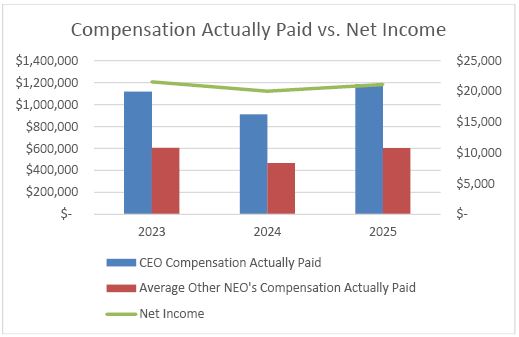
As required by Item 402(v) of Regulation S-K, we are providing the following information regarding the relationship between executive compensation and our financial performance for each of the last three completed years. In determining the “compensation actually paid” to our NEOs, we are required to make various adjustments to amounts that have been previously reported in the Summary Compensation Table (the “SCT”) in previous years to reflect the estimated value of equity awards as of the end of the fiscal year or, if earlier, the vesting date. Note that compensation for our NEOs other than our Chief Executive Officer (“CEO”) is reported as an average.
|
Year |
Summary Compensation Table (SCT) Total for CEO ($) (1) |
Compensation Actually Paid to CEO (2) ($) |
Average SCT Total for Non-CEO NEOs (1) ($) |
Average Compensation Actually Paid to Non-CEO NEOs (2) ($) |
Value of $100 Initial Fixed Investment Based on Total Shareholder Return (“TSR”) ($) |
Net Income ($) |
||||||||||||
|
2025 |
931,888 | 1,185,288 | 510,352 | 603,812 | 191 | 21,128 | ||||||||||||
|
2024 |
831,346 | 911,351 | 440,658 | 467,166 | 136 | 20,034 | ||||||||||||
|
2023 |
1,036,734 | 1,118,028 | 557,714 | 605,711 | 116 | 21,554 |
|
1. |
The CEO for 2025, 2024, and 2023 was Jeremiah Z. Smith. Other named executive officers for 2025 and 2024 include Brett Hamilton, Executive Vice President/Chief Credit Officer and Kevin Spink, Executive Vice President/Chief Financial Officer. Other named executive officers for 2023 include T. Joe Danelson, Executive Vice President/Chief Credit Officer and Kevin Spink, Executive Vice President/Chief Financial Officer. |
|
2. |
SEC rules require certain adjustments be made to the SCT totals to determine “compensation actually paid” as reported in the Pay versus Performance table. The following table details these adjustments more specifically: |
|
Year |
Executive |
SCT Total ($) |
Subtract Amount Reported in “Stock Awards” Column of SCT ($) |
Add Value of Outstanding and Unvested Equity Awards that were Granted in Current Year ($) |
Add (Subtract) Change In Value of Equity Awards Outstanding and Unvested at the end of the Current Year that were Granted in a Prior year ($) |
Add (Subtract) Change in Value of Equity Awards Vested in the Current Year that were Granted in a Prior Year ($) |
Subtract Value of Equity Awards that Failed to Meet Vesting Conditions ($) |
Compensation Actually Paid ($) |
||||||||||||||
|
2025 |
CEO |
931,888 | (139,300) | 196,392 | 194,617 | 1,691 | - | 1,185,288 | ||||||||||||||
|
Non-CEO NEOs |
510,352 | (59,700) | 84,168 | 68,402 | 590 | - | 603,812 | |||||||||||||||
|
2024 |
CEO |
831,346 | (159,993) | 192,897 | 48,759 | (1,658) | - | 911,351 | ||||||||||||||
|
Non-CEO NEOs |
440,658 | (63,417) | 74,670 | 15,671 | (416) | - | 467,166 | |||||||||||||||
|
2023 |
CEO |
1,036,734 | (135,928) | 142,310 | 64,049 | 10,863 | - | 1,118,028 | ||||||||||||||
|
Non-CEO NEOs |
557,714 | (80,374) | 84,147 | 36,898 | 7,326 | - | 605,711 |