Pay vs Performance Disclosure - USD ($)
Jan. 02, 2026
Jan. 03, 2025
Dec. 29, 2023
Dec. 30, 2022
Dec. 31, 2021
| Year | Summary Compensation Table total for PEO ($) (1) | Compensation actually paid to PEO ($) (2) | Average Summary Compensation Table total for non-PEO NEOs ($) (3) | Average compensation actually paid to non-PEO NEOs ($) (4) | Value (cumulative) of initial fixed $100 investment based on: | Net income (in millions) ($) | Annualized recurring revenue (in millions) ($) (6) | |||||||||||||||||||
| Total shareholder return ($) | Peer group total shareholder return ($) (5) | |||||||||||||||||||||||||
| 2025 | 19,129,944 | 26,495,081 | 4,033,752 | 5,057,362 | 117 | 258 | 424.0 | 2,392.3 | ||||||||||||||||||
| 2024 | 18,938,871 | 30,918,454 | 3,429,546 | 4,938,996 | 106 | 208 | 1,504.4 | 2,257.8 | ||||||||||||||||||
| 2023 | 14,954,642 | 15,018,601 | 2,790,762 | 2,373,641 | 80 | 152 | 311.3 | 1,982.3 | ||||||||||||||||||
| 2022 | 16,134,366 | (8,517,884) | 2,700,601 | (1,963,061) | 76 | 97 | 449.7 | 1,603.7 | ||||||||||||||||||
| 2021 | 13,956,821 | 27,444,349 | 3,551,936 | 9,812,718 | 131 | 135 | 492.7 | 1,409.1 | ||||||||||||||||||
| 2025 | 2024 | 2023 | 2022 | 2021 | ||||||||||||||||||||||
| Ronald J. Bisio | David G. Barnes | David G. Barnes | David G. Barnes | David G. Barnes | ||||||||||||||||||||||
| Chris Keating | Ronald J. Bisio | Ronald J. Bisio | Ronald J. Bisio | Steven W. Berglund | ||||||||||||||||||||||
| Phillip Sawarynski | Peter Large | Peter Large | Jennifer Lin | Manolis E. Kotzabasakis | ||||||||||||||||||||||
| Mark Schwartz | Phillip Sawarynski | Jennifer Lin | Darryl R. Matthews | Darryl R. Matthews | ||||||||||||||||||||||
| Mark Schwartz | Darryl R. Matthews | Manolis E. Kotzabasakis | ||||||||||||||||||||||||
| James Langley | ||||||||||||||||||||||||||
| (A) Pension Plans—Present Value: Deduct the aggregate change in the actuarial present value of the accumulated benefit under all defined benefit and actuarial pension plans | N/A | |||||||
| (B) Pension Plans—Service Costs: Add the aggregate of service cost and prior service cost for all defined benefit and actuarial pension plans | N/A | |||||||
| (C) Equity Awards | ||||||||
| (1) Deduct the amounts reported in the Summary Compensation Table under “Stock Awards” and “Option Awards”: | -15,542,501 | |||||||
| (i) Add the fair value as of the end of the year of all awards granted during the year that are outstanding and unvested as of the end of the year: | +17,903,471 | |||||||
| (ii) Add the amount equal to the change as of the end of the year (from the end of the prior year) in fair value of any awards granted in any prior year that are outstanding and unvested as of the end of the year: | +4,576,871 | |||||||
| (iii) Add, for awards that are granted and vest in the same year, the fair value as of the vesting date: | — | |||||||
| (iv) Add the amount equal to the change as of the vesting date (from the end of the prior year) in fair value of any awards granted in any prior year for which all applicable vesting conditions were satisfied at the end of or during the year: | +427,296 | |||||||
| (v) Subtract, for any awards granted in any prior year that fail to meet the applicable vesting conditions during the year, the amount equal to the fair value at the end of the prior year: | — | |||||||
| (vi) Add the dollar value of any dividends or other earnings paid on stock or option awards in the year prior to the vesting date that are not otherwise included in the total compensation for the year: | — | |||||||
| Total adjustments: | +7,365,137 | |||||||
| (A) Pension Plans—Present Value: Deduct the aggregate change in the actuarial present value of the accumulated benefit under all defined benefit and actuarial pension plans | N/A | |||||||
| (B) Pension Plans—Service Costs: Add the aggregate of service cost and prior service cost for all defined benefit and actuarial pension plans | N/A | |||||||
| (C) Equity Awards | ||||||||
| (1) Deduct the amounts reported in the Summary Compensation Table under “Stock Awards” and “Option Awards”: | -3,059,962 | |||||||
| (i) Add the fair value as of the end of the year of all awards granted during the year that are outstanding and unvested as of the end of the year: | +3,516,924 | |||||||
| (ii) Add the amount equal to the change as of the end of the year (from the end of the prior year) in fair value of any awards granted in any prior year that are outstanding and unvested as of the end of the year: | +613,466 | |||||||
| (iii) Add, for awards that are granted and vest in the same year, the fair value as of the vesting date: | +12,497 | |||||||
| (iv) Add the amount equal to the change as of the vesting date (from the end of the prior year) in fair value of any awards granted in any prior year for which all applicable vesting conditions were satisfied at the end of or during the year: | -59,315 | |||||||
| (v) Subtract, for any awards granted in any prior year that fail to meet the applicable vesting conditions during the year, the amount equal to the fair value at the end of the prior year: | — | |||||||
| (vi) Add the dollar value of any dividends or other earnings paid on stock or option awards in the year prior to the vesting date that are not otherwise included in the total compensation for the year: | — | |||||||
| Total adjustments: | +1,023,610 | |||||||
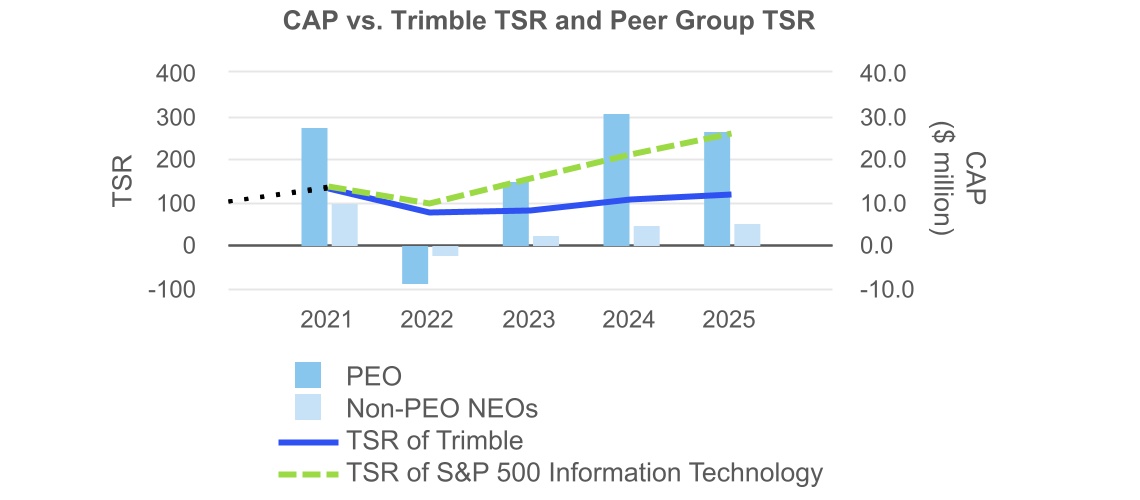
The following chart shows the relationship between the amounts calculated as compensation actually paid, for the PEO and for the non-PEO NEOs (averaged) and the cumulative total shareholder return of the Company and the peer group based on an initial $100 investment.
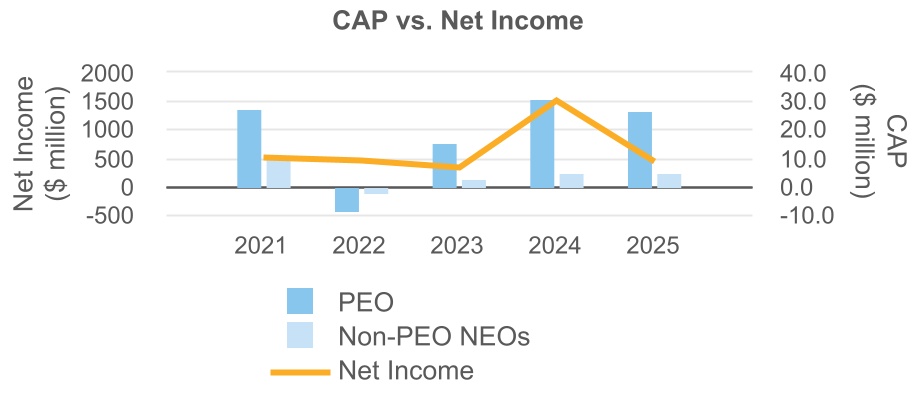
The following chart shows the relationship between the amounts calculated as compensation actually paid, for the PEO and for the non-PEO NEOs (averaged), and the Company’s net income.
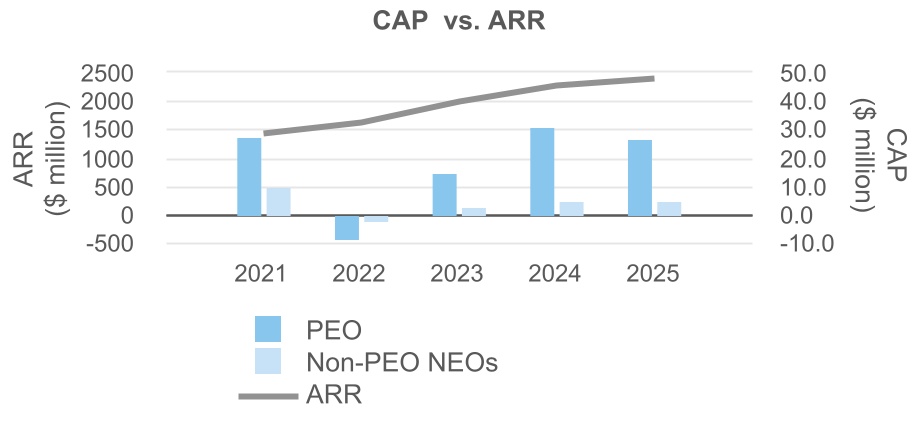
The following chart shows the relationship between the amounts calculated as compensation actually paid, for the PEO and for the non-PEO NEOs (averaged), and the Company’s annualized recurring revenue (ARR).
The following chart shows the relationship between the amounts calculated as compensation actually paid, for the PEO and for the non-PEO NEOs (averaged) and the cumulative total shareholder return of the Company and the peer group based on an initial $100 investment.
| Measure | Explanation | ||||
| Annualized recurring revenue | See Appendix A for an explanation of annualized recurring revenue | ||||
| Revenue | The Company’s revenue in a specified period | ||||
| Operating income | The Company’s operating income in a specified period | ||||
| Adjusted EBITDA | See Appendix A for an explanation of Adjusted EBITDA | ||||
| Total shareholder return | The total shareholder return of the Company’s stock over a specified period | ||||