Pay vs Performance Disclosure - USD ($)
Dec. 31, 2025
Dec. 31, 2024
Dec. 31, 2023
Pay Versus Performance
As required by the pay versus performance rules adopted by the SEC pursuant to the Dodd-Frank Wall Street Reform and Consumer Protection Act of 2010, as amended (the “Dodd-Frank Act”), we are providing the following information regarding the relationship between executive compensation and our financial performance for each of the last two completed fiscal years. In determining the compensation actually paid (“CAP”) to our Named Executive Officers, we are required to make various adjustments to amounts that are reported in the Summary Compensation Table, as the SEC’s valuation methods for this section differ from those required in the Summary Compensation Table.
We do not utilize net income (loss) or total stockholder return (“TSR”) in our executive compensation program. However, we do utilize several other performance measures to align executive compensation with our performance. As described in more detail in the section entitled “Narrative Disclosure to 2025 Summary Compensation Table,” part of the compensation that our Named Executive Officers are eligible to receive consists of annual performance-based cash bonuses, which are designed to provide appropriate incentives to our executives to achieve defined annual corporate goals and to reward our executives for individual achievement towards these goals. Additionally, we view RSUs, which are an integral part of our executive compensation program, as related to the Company’s performance although not directly tied to net income (loss) or TSR, because they provide incremental value only if the market price of our common stock increases, and if the executive officer continues in our employment over the vesting period. We believe that RSU grants provide a meaningful incentive for our executives to remain in our employment and enhance stockholder value over time.
Stockholders should refer to the philosophy, policies, and practices in this proxy statement for a complete description of how executive compensation relates to the Company’s performance measures and how the Compensation Committee makes it decisions related thereto. The Compensation Committee did not consider this SEC-required pay versus performance analysis and disclosure below in making its pay decisions for any of the years shown.
Pay Versus Performance Table
The following table provides the information required to be disclosed for our Named Executive Officers for each of the fiscal years ended December 31, 2025, December 31, 2024, and December 31, 2023 along with the financial information required to be disclosed for each fiscal year. We are a smaller reporting company, as defined in Rule 12b-2 under the Exchange Act, and have elected to provide in this proxy statement certain scaled disclosures permitted under the Exchange Act for smaller reporting companies.
Year | Summary Compensation Table Total for the Principal Executive Officer (“PEO”)(1) | Compensation actually paid to PEO(2)(3) | Average Summary Compensation Table Total for Non-PEO NEOs(4) | Average Compensation Actually Paid to Non-PEO NEOs(3)(4) | Value of Initial Fixed $100 Investment Based on TSR(5) | Net Loss (in $ ‘000s)(6) | ||||||||||||
2025 | $4,365,064 | $2,195,077 | $2,223,151 | $1,414,030 | $20 | ($38,998) | ||||||||||||
2024 | $2,430,610 | $1,827,289 | $1,120,852 | $660,930 | $14 | ($43,708) | ||||||||||||
2023 | $2,990,985 | ($1,941,901) | $1,261,044 | $199,563 | $26 | ($30,189) | ||||||||||||
(1) | The dollar amounts reported in this column are the amounts of total compensation reported in the “Total” column of the Summary Compensation Table for the 2023, 2024 and 2025 fiscal years for Mr. Sullivan who served as our PEO for the applicable year. For additional information, see “Executive Compensation-Summary Compensation Table.” |
(2) | The dollar amounted reported in this column represent the amount of CAP to our PEO, Mr. Sullivan, as computed in accordance with Item 402(v) of Regulation S-K. |
(3) | The following table reflects the adjustments made to compute CAP for each applicable year. |
(4) | The dollar amounts reported in this column represents the average of the amounts reported for our Non-PEO NEOs as a group in the “Total” column of the Summary Compensation Table in each applicable year. The Non-PEO NEOs in each applicable year were Messrs. Furlong, Pfanstiel and Macan. |
(5) | The amounts reported in this column reflect our cumulative TSR, assuming an initial fixed $100 investment in the Company for the period starting December 31, 2020 through the end of each listed fiscal year. Cumulative TSR is calculated by dividing the sum of the cumulative amount of dividends for the measured period, assuming dividend reinvestment, and the difference between the Company share price at the end and the beginning of the measured period by the Company’s share price at the beginning of the measured period. No dividends were paid on stock or option awards in 2023, 2024, and 2025. |
(6) | The dollar amounts reported represents the amount of net loss attributed to the Company’s stockholders as reflected in our audited financial statements of each applicable year. |
2025 | 2024 | 2023 | ||||||||||||||||
PEO $ | Non-PEO NEOs $ | PEO $ | Non-PEO NEOs $ | PEO $ | Non-PEO NEOs $ | |||||||||||||
Summary Compensation Table total | $4,365,064 | $2,223,151 | $2,430,610 | $1,120,852 | $2,990,985 | $1,261,044 | ||||||||||||
Adjustments | ||||||||||||||||||
(Subtraction): Stock Awards | $(3,208,750) | $(1,749,362) | ($1,503,000) | ($529,106) | ($1,601,700) | ($560,500) | ||||||||||||
Fair Value of Equity Awards | ||||||||||||||||||
Addition: Year-End Fair Value of Outstanding and Unvested Equity Awards Granted in the Covered Year | $1,098,256 | $778,544 | $1,207,500 | $193,200 | $826,500 | $275,500 | ||||||||||||
Addition: Change in Fair Value of Outstanding and Unvested Equity Awards Granted in the Prior Year | ($310,505) | ($18,402) | ($367,220) | ($184,536) | ($3,184,086) | ($602,009) | ||||||||||||
Addition: Change in Fair Value or Prior Year Equity Awards Vested in Covered Year | $251,011 | $180,098 | $59,399 | $60,520 | $973,599 | ($174,472) | ||||||||||||
Total Adjustments for Fair Value Equity Awards | ($2,169,987) | $(809,122) | ($603,321) | ($459,922) | ($4,932,886) | ($1,061,481) | ||||||||||||
Compensation Actually Paid | $2,195,077 | $1,414,030 | $1,827,289 | $660,930 | ($1,941,901) | $199,563 | ||||||||||||
(1) | The dollar amounts reported in this column are the amounts of total compensation reported in the “Total” column of the Summary Compensation Table for the 2023, 2024 and 2025 fiscal years for Mr. Sullivan who served as our PEO for the applicable year. For additional information, see “Executive Compensation-Summary Compensation Table.” |
(4) | The dollar amounts reported in this column represents the average of the amounts reported for our Non-PEO NEOs as a group in the “Total” column of the Summary Compensation Table in each applicable year. The Non-PEO NEOs in each applicable year were Messrs. Furlong, Pfanstiel and Macan. |
(6) | The dollar amounts reported represents the amount of net loss attributed to the Company’s stockholders as reflected in our audited financial statements of each applicable year. |
2025 | 2024 | 2023 | ||||||||||||||||
PEO $ | Non-PEO NEOs $ | PEO $ | Non-PEO NEOs $ | PEO $ | Non-PEO NEOs $ | |||||||||||||
Summary Compensation Table total | $4,365,064 | $2,223,151 | $2,430,610 | $1,120,852 | $2,990,985 | $1,261,044 | ||||||||||||
Adjustments | ||||||||||||||||||
(Subtraction): Stock Awards | $(3,208,750) | $(1,749,362) | ($1,503,000) | ($529,106) | ($1,601,700) | ($560,500) | ||||||||||||
Fair Value of Equity Awards | ||||||||||||||||||
Addition: Year-End Fair Value of Outstanding and Unvested Equity Awards Granted in the Covered Year | $1,098,256 | $778,544 | $1,207,500 | $193,200 | $826,500 | $275,500 | ||||||||||||
Addition: Change in Fair Value of Outstanding and Unvested Equity Awards Granted in the Prior Year | ($310,505) | ($18,402) | ($367,220) | ($184,536) | ($3,184,086) | ($602,009) | ||||||||||||
Addition: Change in Fair Value or Prior Year Equity Awards Vested in Covered Year | $251,011 | $180,098 | $59,399 | $60,520 | $973,599 | ($174,472) | ||||||||||||
Total Adjustments for Fair Value Equity Awards | ($2,169,987) | $(809,122) | ($603,321) | ($459,922) | ($4,932,886) | ($1,061,481) | ||||||||||||
Compensation Actually Paid | $2,195,077 | $1,414,030 | $1,827,289 | $660,930 | ($1,941,901) | $199,563 | ||||||||||||
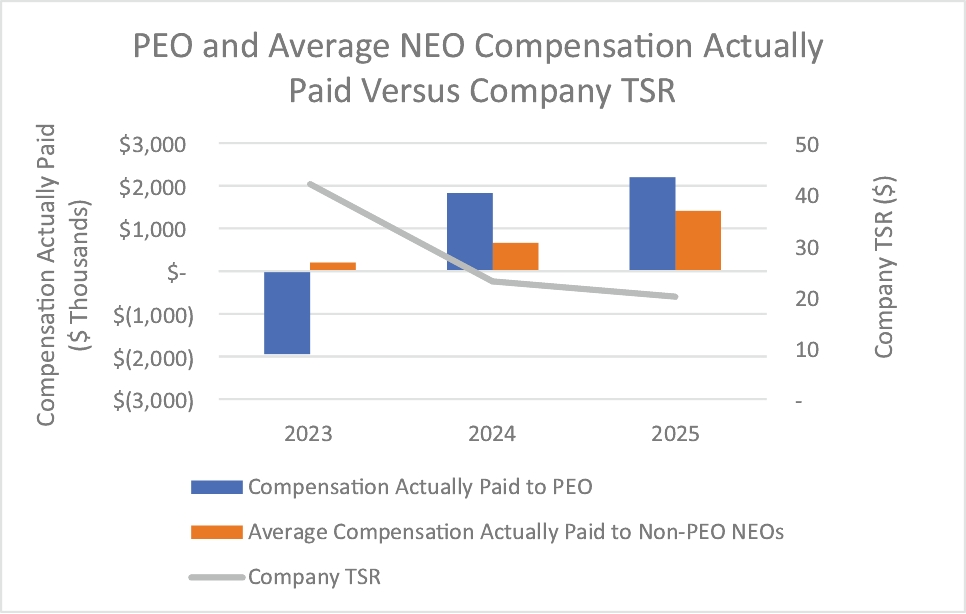
CAP and Cumulative TSR
The following chart sets forth the relationship between CAP to Mr. Sullivan, the average CAP to our Named Executive Officers as a group (excluding Mr. Sullivan), and the Company’s cumulative TSR over the two most recently completed fiscal years.
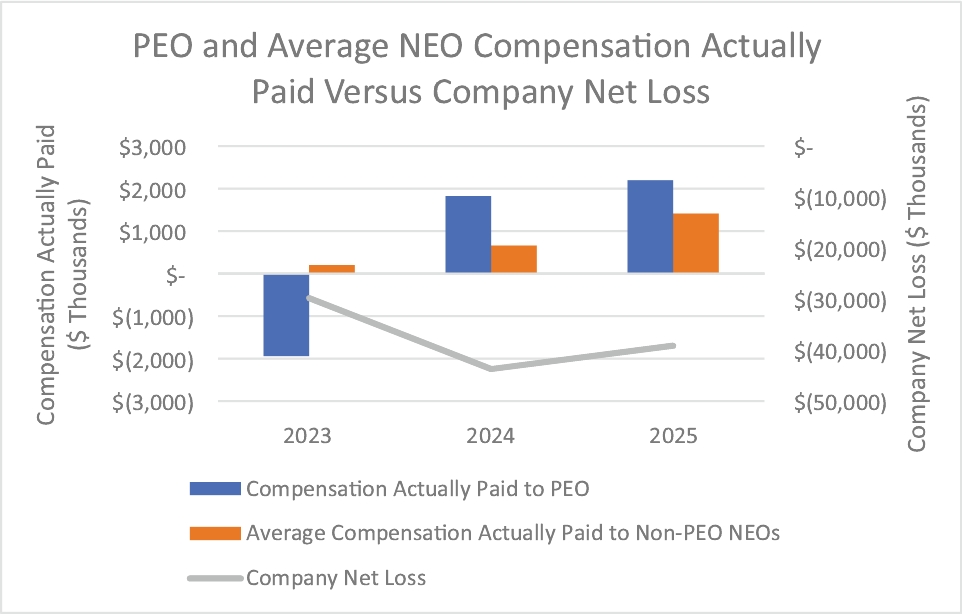
CAP and Net Income (Loss)
The following chart sets forth the relationship between CAP to Mr. Sullivan and the average CAP to our Named Executive Officers as a group (excluding Mr. Sullivan), and our net loss during the two most recently completed fiscal years.