— PAY VERSUS PERFORMANCE DISCLOSURE
As required by Section 953(a) of the Dodd-Frank Wall Street Reform and Consumer Protection Act, and Item 402(v) of Regulation S-K, we are providing the following information about the relationship between executive compensation actually paid to our Chief Executive Officer, who is referred to in the table below as our principal executive officer (“PEO”), and our other named executive officers, who are referred to in the table below as our Non-PEO NEOs, and certain financial performance of the Company. For further information concerning Company’s pay for performance philosophy and how the Company aligns executive compensation with the Company’s performance, refer to “Compensation Discussion and Analysis.”
The PEOs and Non-PEO NEOs included in this section refer to the following:
| Year | PEO | Non-PEO NEOs | ||
| 2025 | Current PEO: Kaes Van’t Hof Former PEO: Travis D. Stice |
Jere W. Thompson III, Teresa L. Dick, Daniel N. Wesson, Matt Zmigrosky | ||
| 2024 | Travis D. Stice | Kaes Van’t Hof, Teresa L. Dick, Daniel N. Wesson, Matt Zmigrosky | ||
| 2023 | Travis D. Stice | Kaes Van’t Hof, Teresa L. Dick, Daniel N. Wesson, Matt Zmigrosky | ||
| 2022 | Travis D. Stice | Kaes Van’t Hof, Teresa L. Dick, Daniel N. Wesson, Matt Zmigrosky | ||
| 2021 | Travis D. Stice | Kaes Van’t Hof, Teresa L. Dick, Russell Pantermuehl, Daniel N. Wesson |
| Value of Initial Fixed $100 Investment Based On: | ||||||||||||||||||||||||||||||||||||||||
| Year | Summary Compensation Table Total for Current PEO(1) | Compensation Actually Paid to Current PEO(2) | Summary Compensation Table Total for Former PEO(1) | Compensation Actually Paid to Former PEO(2) | Average Summary Compensation Table Total for Non-PEO NEOs(3) | Average Compensation Actually Paid to Non-PEO NEOs(4) | Total Shareholder Return(5) | Peer Group Total Shareholder Return(6) | Net Income (Loss) (in millions)(7) | Return on Average Capital Employed (“ROACE”)(8) | ||||||||||||||||||||||||||||||
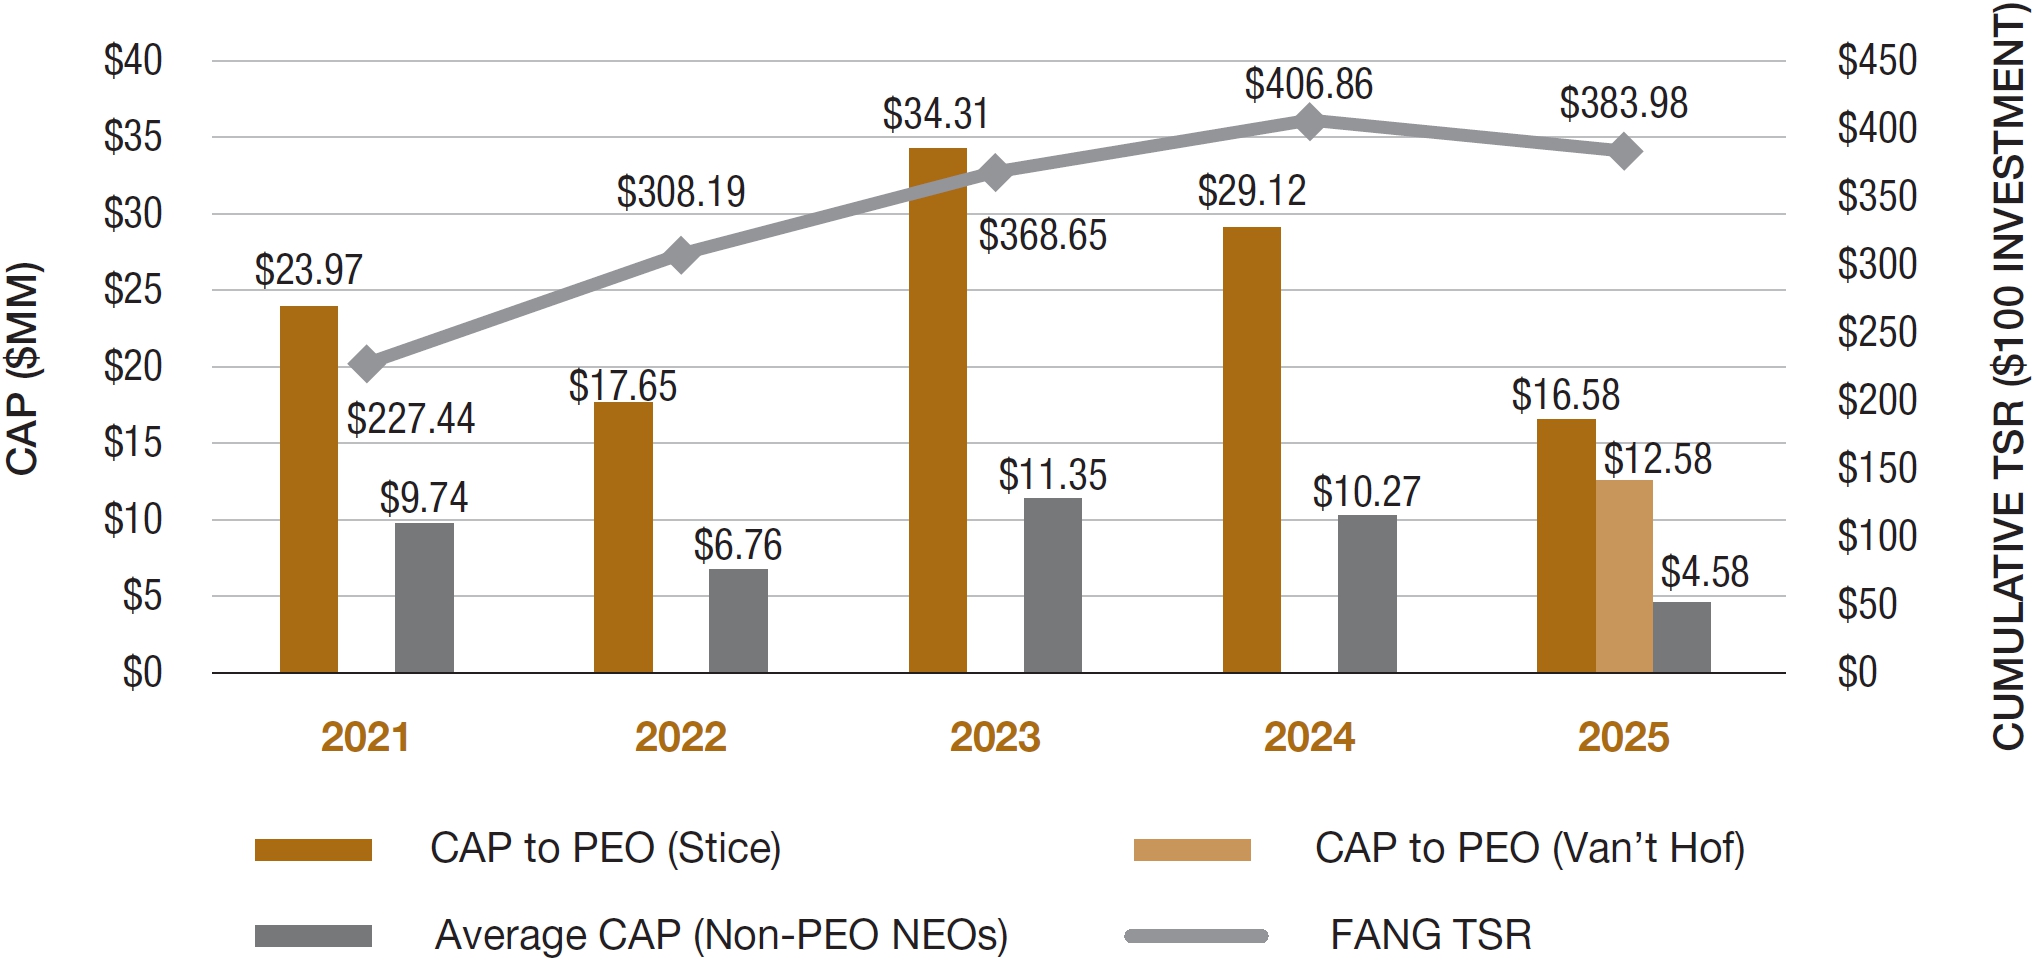
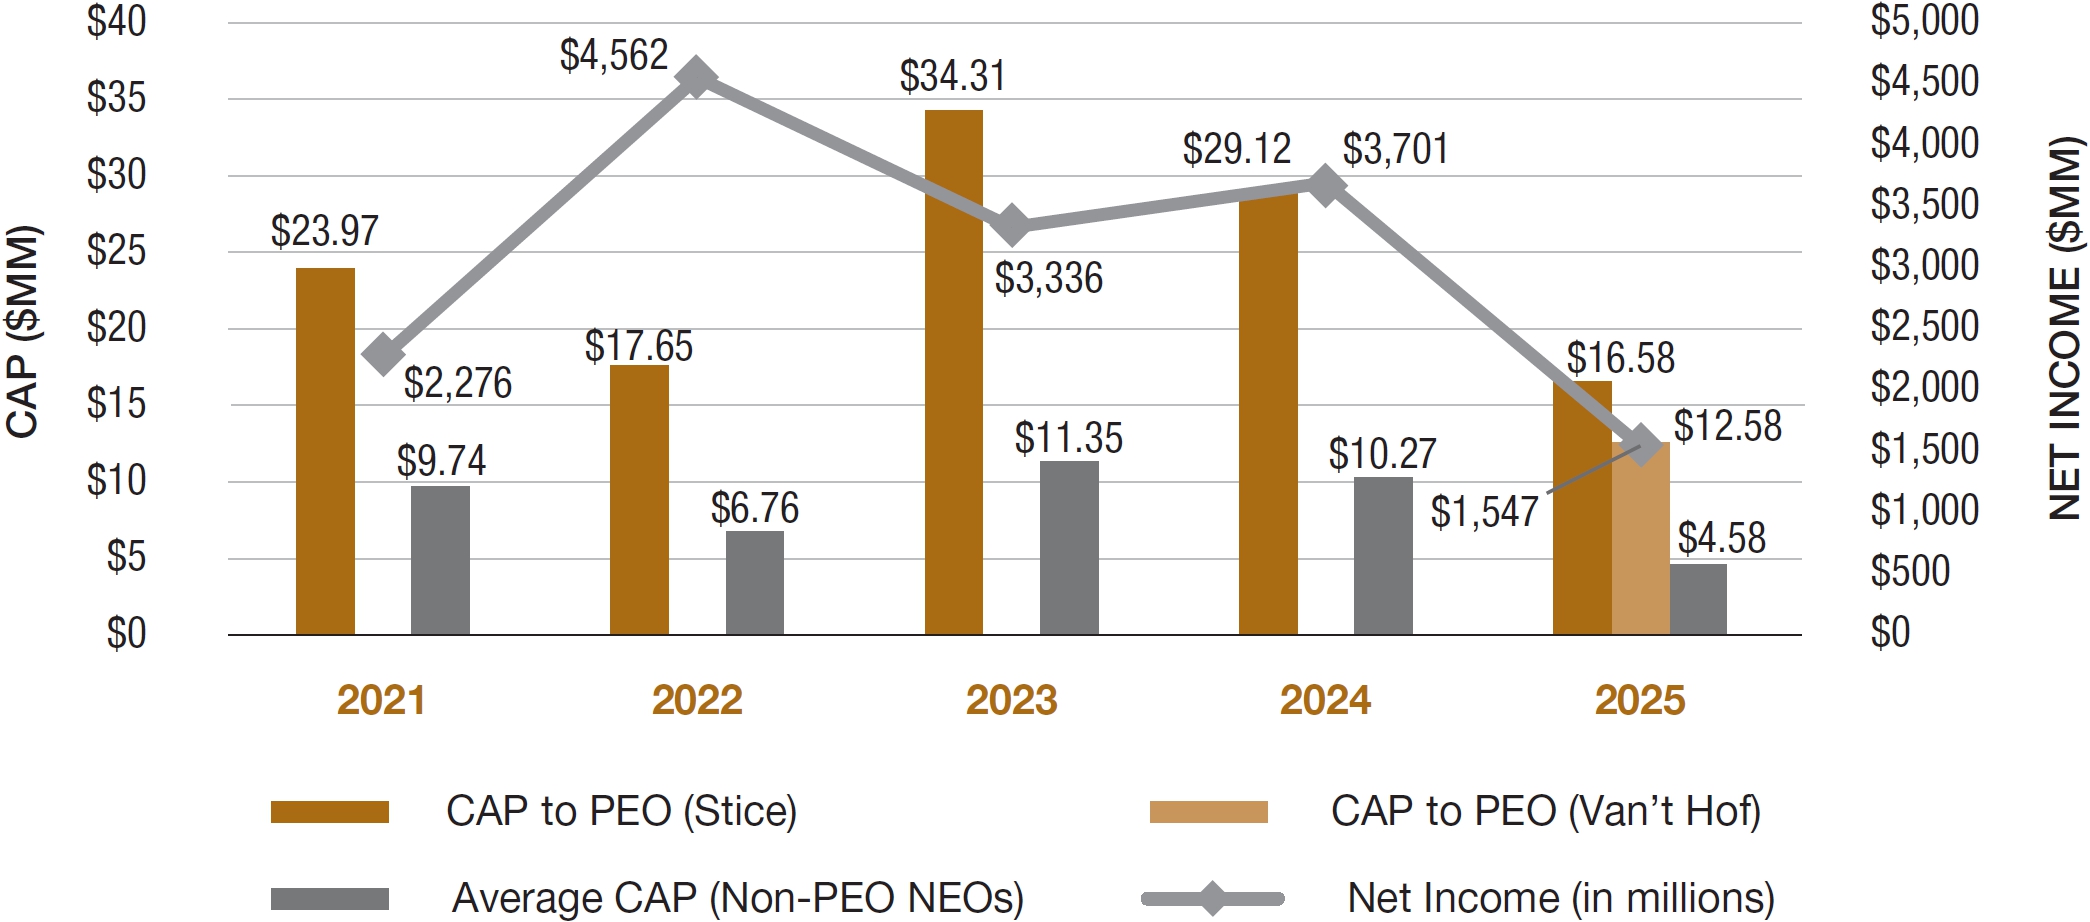
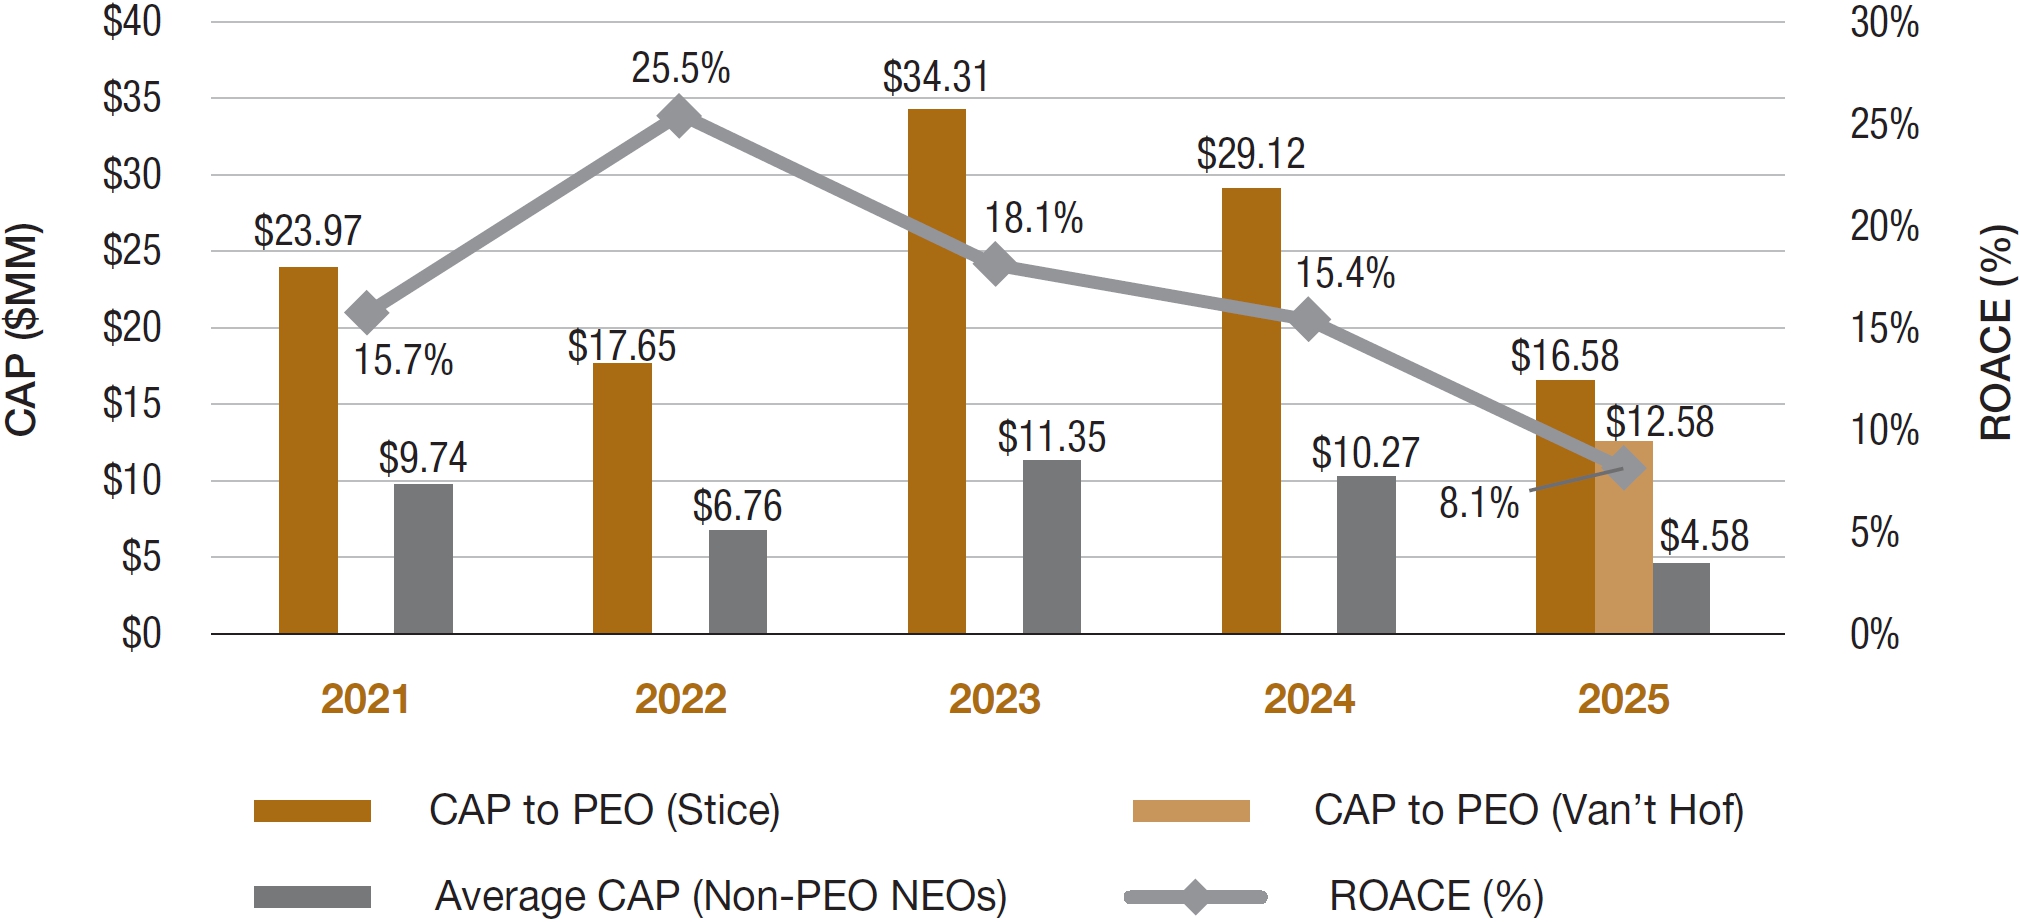
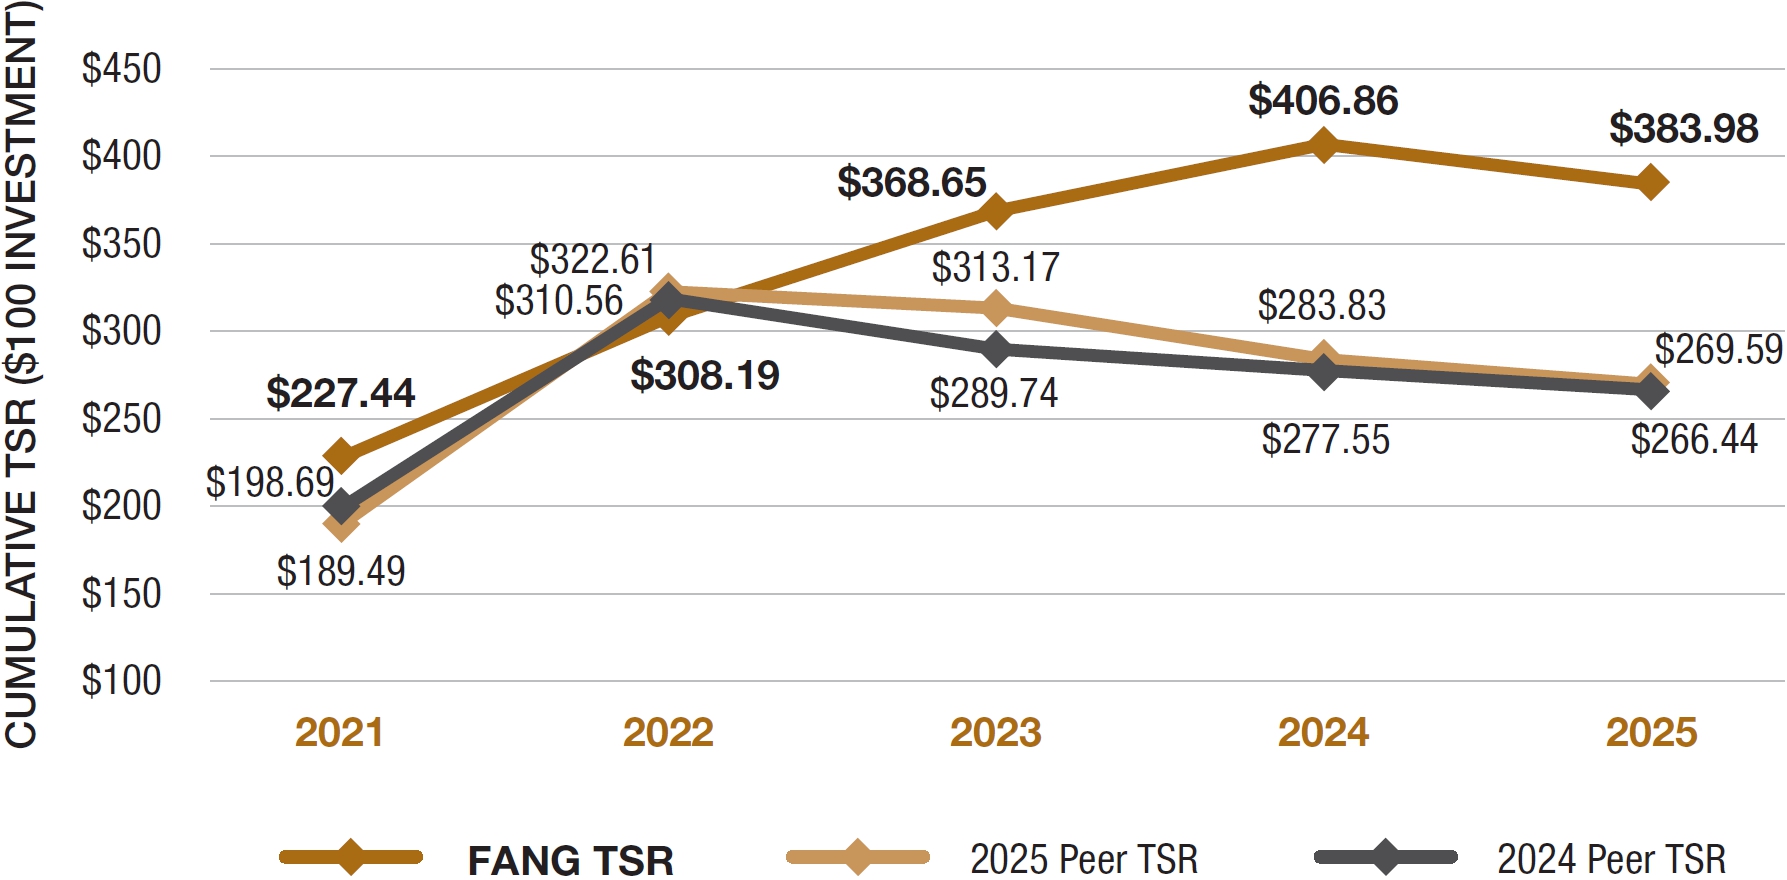
| 2025 | $ | 14,931,423 | $ | 12,578,377 | $ | 20,502,775 | $ | 16,582,404 | $ | 5,699,824 | $ | 4,577,975 | $ | 383.98 | $ | 269.59 | $ | 1,547 | 8.1 | % | ||||||||||||||||||||
| 2024 | $ | — | $ | — | $ | 21,324,079 | $ | 29,117,415 | $ | 7,500,390 | $ | 10,265,220 | $ | 406.86 | $ | 283.83 | $ | 3,701 | 15.4 | % | ||||||||||||||||||||
| 2023 | $ | — | $ | — | $ | 17,583,386 | $ | 34,309,377 | $ | 5,741,598 | $ | 11,353,994 | $ | 368.65 | $ | 313.17 | $ | 3,336 | 18.1 | % | ||||||||||||||||||||
| 2022 | $ | — | $ | — | $ | 17,152,470 | $ | 17,650,787 | $ | 4,942,355 | $ | 6,755,849 | $ | 308.19 | $ | 322.61 | $ | 4,562 | 25.5 | % | ||||||||||||||||||||
| 2021 | $ | — | $ | — | $ | 13,529,128 | $ | 23,965,903 | $ | 5,073,857 | $ | 9,737,527 | $ | 227.44 | $ | 189.49 | $ | 2,276 | 15.7 | % | ||||||||||||||||||||
The PEOs and Non-PEO NEOs included in this section refer to the following:
| Year | PEO | Non-PEO NEOs | ||
| 2025 | Current PEO: Kaes Van’t Hof Former PEO: Travis D. Stice |
Jere W. Thompson III, Teresa L. Dick, Daniel N. Wesson, Matt Zmigrosky | ||
| 2024 | Travis D. Stice | Kaes Van’t Hof, Teresa L. Dick, Daniel N. Wesson, Matt Zmigrosky | ||
| 2023 | Travis D. Stice | Kaes Van’t Hof, Teresa L. Dick, Daniel N. Wesson, Matt Zmigrosky | ||
| 2022 | Travis D. Stice | Kaes Van’t Hof, Teresa L. Dick, Daniel N. Wesson, Matt Zmigrosky | ||
| 2021 | Travis D. Stice | Kaes Van’t Hof, Teresa L. Dick, Russell Pantermuehl, Daniel N. Wesson |
| (1) | The dollar amounts reported are the amounts of total compensation reported in our Summary Compensation Table. |
| (2) | The dollar amounts reported represent the amount of “compensation actually paid,” as computed in accordance with SEC rules. The dollar amounts do not reflect the actual amount of compensation earned by or paid during the applicable year. In accordance with SEC rules, the following adjustments were made to total compensation to determine the compensation actually paid: |
| Year | Reported Summary Compensation Table Total for PEO | Deductions: Reported Value of Equity Awards(a) | Additions: Equity Award Adjustments(b) | Compensation Actually Paid to PEO | ||||||||||||
| Current PEO: | ||||||||||||||||
| 2025 | $ | 14,931,423 | $ | 11,101,462 | $ | 8,748,416 | $ | 12,578,377 | ||||||||
| Former PEO: | ||||||||||||||||
| 2025 | $ | 20,502,775 | $ | 16,600,783 | $ | 12,680,412 | $ | 16,582,404 | ||||||||
| (a) | The grant date fair value of equity awards represents the total of the amounts reported in the “Stock Awards” columns in the Summary Compensation Table for the applicable year. |
| (b) | The equity award adjustments for each applicable year include the addition (or subtraction, as applicable) of the following: (i) the year-end fair value of any equity awards granted in the applicable year that are outstanding and unvested as of the end of the year; (ii) the amount of change as of the end of the applicable year (from the end of the prior fiscal year) in fair value of any awards granted in prior years that are outstanding and unvested as of the end of the applicable year; (iii) for awards that are granted and vest in the same applicable year, the fair value as of the vesting date; (iv) for awards granted in prior years that vest in the applicable year, the amount equal to the change as of the vesting date (from the end of the prior fiscal year) in fair value; (v) for awards granted in prior years that are determined to fail to meet the applicable vesting conditions during the applicable year, a deduction for the amount equal to the fair value at the end of the prior fiscal year; and (vi) the dollar value of any dividends or other earnings paid on stock or option awards in the applicable year prior to the vesting date that are not otherwise reflected in the fair value of such award or included in any other component of total compensation for the applicable year. The valuation assumptions used to calculate fair values did not materially differ from those disclosed at the time of grant. The amounts deducted or added in calculating the equity award adjustments are as follows: |
| Year | Year End Fair Value of Current Year Equity Awards that Remain Unvested at Year-End | Change in Fair Value of Equity Awards Granted in Prior Years that are Unvested at Year-End | Fair Value as of Vesting Date of Equity Awards Granted and Vested in the Year | Change in Fair Value of Equity Awards Granted in Prior Years that Vested in the Year | Fair Value at the End of the Prior Year of Equity Awards that Failed to Meet Vesting Conditions in the Year | Value of Dividends or other Earnings Paid on Stock or Option Awards not Otherwise Reflected in Fair Value | Total Equity Award Adjustments | |||||||||||||||||||||
| Current PEO: | ||||||||||||||||||||||||||||
| 2025 | $ | 7,789,568 | $ | (1,236,155 | ) | $ | 1,041,542 | $ | 693,993 | $ | — | $ | 459,468 | $ | 8,748,416 | |||||||||||||
| Former PEO: | ||||||||||||||||||||||||||||
| 2025 | $ | 10,629,843 | $ | (1,987,114 | ) | $ | 1,786,234 | $ | 1,587,590 | $ | — | $ | 663,859 | $ | 12,680,412 | |||||||||||||
| (3) | The dollar amounts reported represent the average of the amounts reported for our Non-PEO NEOs as a group in the “Total” column of the Summary Compensation Table in each applicable year. |
| (4) | The dollar amounts reported represent the average amount of “compensation actually paid” to our Non-PEO NEOs, as computed in accordance with SEC rules. The dollar amounts do not reflect the actual average amount of compensation earned by or paid to our Non-PEO NEOs during the applicable year. In accordance with the SEC rules, the following adjustments were made to average total compensation for our Non-PEO NEOs for each year to determine the compensation actually paid, using the same methodology described above in Note 2: |
| Year | Average Reported Summary Compensation Table Total for Non-PEO NEOs | Deductions: Average Reported Value of Equity Awards | Additions: Average Equity Award Adjustments(a) | Average Compensation Actually Paid to Non-PEO NEOs | ||||||||||||
| 2025 | $ | 5,699,824 | $ | 4,105,038 | $ | 2,983,189 | $ | 4,577,975 | ||||||||
| (a) | The amounts deducted or added in calculating the total average equity award adjustments are as follows: |
| Year | Year End Fair Value of Current Year Equity Awards that Remain Unvested at Year-End | Change in Fair Value of Equity Awards Granted in Prior Years that are Unvested at Year-End | Fair Value as of Vesting Date of Equity Awards Granted and Vested in the Year | Change in Fair Value of Equity Awards Granted in Prior Years that Vested in the Year | Fair Value at the End of the Prior Year of Equity Awards that Failed to Meet Vesting Conditions in the Year | Value of Dividends or other Earnings Paid on Stock or Option Awards not Otherwise Reflected in Fair Value | Total Average Equity Award Adjustments | |||||||||||||||||||||
| 2025 | $ | 2,633,447 | $ | (572,947 | ) | $ | 384,763 | $ | 343,431 | $ | — | $ | 194,495 | $ | 2,983,189 | |||||||||||||
PAY VS. PERFORMANCE: NET INCOME ($MM)
PAY VS. PERFORMANCE: ROACE (%)
Financial Performance Measure
As described in greater detail in “Compensation – Compensation Discussion and Analysis,” the Company’s executive compensation program reflects a variable pay-for-performance philosophy. The metrics that the Company uses for both our long-term and short-term incentive awards are selected based on an objective of incentivizing our NEOs to increase the value of our enterprise for our stockholders. The most important financial performance measures used by the Company to link executive compensation actually paid to the Company’s NEOs, for the most recently completed fiscal year, to the Company’s performance are as follows:
| • | ROACE; | |
| • | Free Cash Flow (as defined and reconciled in Schedule A to this proxy statement); | |
| • | PDP F&D Cost (as defined in “Compensation Discussion and Analysis – Performance-Based Annual Incentive Bonus” above); and | |
| • | Relative Total Stockholder Return (as modified by an absolute TSR modifier) (as discussed in “Compensation Discussion and Analysis—Long-Term Equity Incentive Compensation—2025 Performance-Based and Time-Based Awards”). |
| [1] | The dollar amounts reported represent the average of the amounts reported for our Non-PEO NEOs as a group in the “Total” column of the Summary Compensation Table in each applicable year. |
| [2] | The dollar amounts reported represent the average amount of “compensation actually paid” to our Non-PEO NEOs, as computed in accordance with SEC rules. The dollar amounts do not reflect the actual average amount of compensation earned by or paid to our Non-PEO NEOs during the applicable year. In accordance with the SEC rules, the following adjustments were made to average total compensation for our Non-PEO NEOs for each year to determine the compensation actually paid, using the same methodology described above in Note 2: |
| [3] | Cumulative TSR is calculated by dividing the sum of the cumulative amount of dividends for the four-year period included in this table, assuming dividend reinvestment, and the difference between the Company’s share price at the end and the beginning of the measurement period by the Company’s share price at the beginning of the measurement period. |
| [4] | Represents the weighted peer group TSR, weighted according to the respective companies’ stock market capitalization at December 31, 2020. The peer group used for this purpose in 2024 consisted of the following companies: APA Corporation, Coterra Energy, Inc., Devon Energy Corporation, EOG Resources, Inc., Marathon Oil Corporation, Ovintiv Inc. and Permian Resources Corporation. The peer group used for this purpose in 2023 consists of the following companies: APA Corporation, Coterra Energy, Inc., Devon Energy Corporation, EOG Resources, Inc., Hess Corporation, Marathon Oil Corporation, Ovintiv Inc. and Pioneer Natural Resources Company. The peer group used for this purpose in 2022 consisted of the following companies: APA Corporation, Continental Resources, Inc., Coterra Energy, Inc., Devon Energy Corporation, EOG Resources, Inc., Hess Corporation, Marathon Oil Corporation, Ovintiv Inc. and Pioneer Natural Resources Company. In 2025, Marathon Oil Corporation was removed from the 2025 peer group due to its acquisition by ConocoPhillips in November 2024. ConocoPhillips and Occidental Petroleum Corp were added to the 2025 peer group. After the removal of Marathon Oil Corporation, Continental Resources, Inc., Hess Corporation and Pioneer Natural Resources Company, and the addition of ConocoPhillips, Occidental Petroleum Corp and Permian Resources Corporation, the 2022 peer group, 2023 peer group, 2024 peer group and 2025 peer group are made up of the same companies. |
| [5] | The dollar amounts reported represent the amount of net income reflected in the Company’s audited financial statements for the applicable year. |
| [6] | ROACE (%) is a non-GAAP financial measure. See Schedule A for the definition of this non-GAAP financial measure and its reconciliation to the most directly comparable GAAP measure, and for other important financial information. For 2024, the calculation of ROACE has been further adjusted to exclude the effects of the Endeavor Merger as shown in Schedule A. |
| [7] | The amounts deducted or added in calculating the total average equity award adjustments are as follows: |
| [8] | The dollar amounts reported are the amounts of total compensation reported in our Summary Compensation Table. |
| [9] | The dollar amounts reported represent the amount of “compensation actually paid,” as computed in accordance with SEC rules. The dollar amounts do not reflect the actual amount of compensation earned by or paid during the applicable year. In accordance with SEC rules, the following adjustments were made to total compensation to determine the compensation actually paid: |
| [10] | The grant date fair value of equity awards represents the total of the amounts reported in the “Stock Awards” columns in the Summary Compensation Table for the applicable year. |
| [11] | The equity award adjustments for each applicable year include the addition (or subtraction, as applicable) of the following: (i) the year-end fair value of any equity awards granted in the applicable year that are outstanding and unvested as of the end of the year; (ii) the amount of change as of the end of the applicable year (from the end of the prior fiscal year) in fair value of any awards granted in prior years that are outstanding and unvested as of the end of the applicable year; (iii) for awards that are granted and vest in the same applicable year, the fair value as of the vesting date; (iv) for awards granted in prior years that vest in the applicable year, the amount equal to the change as of the vesting date (from the end of the prior fiscal year) in fair value; (v) for awards granted in prior years that are determined to fail to meet the applicable vesting conditions during the applicable year, a deduction for the amount equal to the fair value at the end of the prior fiscal year; and (vi) the dollar value of any dividends or other earnings paid on stock or option awards in the applicable year prior to the vesting date that are not otherwise reflected in the fair value of such award or included in any other component of total compensation for the applicable year. The valuation assumptions used to calculate fair values did not materially differ from those disclosed at the time of grant. The amounts deducted or added in calculating the equity award adjustments are as follows: |