Pay vs Performance Disclosure - USD ($)
|
12 Months Ended |
Dec. 31, 2025 |
Dec. 31, 2024 |
Dec. 31, 2023 |
Dec. 31, 2022 |
Dec. 31, 2021 |
| Pay vs Performance Disclosure |
|
|
|
|
|
| Pay vs Performance Disclosure, Table |
| | | | | | | | | | | | | | | | | | | | | | | | | | | | | | | | Value of Initial Fixed $100 Investment Based on: | | | | Year | Summary Compensation Table Total for PEO (1) | Compensation Actually Paid to PEO
(2) | Average Summary Compensation Table Total for Non-PEO NEOs (3) | Average Compensation Actually Paid to NEOs
(2) | Total Shareholder Return | Peer Group Total Shareholder Return
(4) | Net Income Attributable to the Company
(in thousands)
(5) | Company Selected Measure
Net Sales (in thousands) (5) | | 2025 | $ | 5,945,970 | | $ | 3,212,939 | | $ | 2,145,146 | | $ | 1,295,311 | | $ | 74.41 | | $ | 170.48 | | $ | 384,841 | | $ | 2,534,269 | | | 2024 | 4,780,362 | | 2,340,513 | | 1,756,723 | | 1,099,108 | | 90.09 | | 149.07 | | 404,488 | | 2,313,314 | | | 2023 | 7,111,530 | | 12,940,505 | | 2,810,684 | | 4,035,955 | | 100.90 | | 101.94 | | 428,403 | | 2,300,845 | | | 2022 | 4,508,367 | | 571,286 | | 1,514,556 | | 551,000 | | 82.86 | | 63.17 | | 318,757 | | 1,918,958 | | | 2021 | 3,661,366 | | 3,978,785 | | 1,421,813 | | 1,523,590 | | 104.14 | | 148.83 | | 360,797 | | 1,731,170 | |
|
|
|
|
|
| Company Selected Measure Name |
Net Sales
|
|
|
|
|
| Named Executive Officers, Footnote |
Amounts represent compensation reported in the Summary Compensation Table for our CEO, Steve Downing, for the respective years shown. Non-PEO NEOs included in the Average Calculations for each year presented are: Neil Boehm, Kevin Nash, Matt Chiodo, and Scott Ryan.
|
|
|
|
|
| Peer Group Issuers, Footnote |
The peer group used for purposes of this disclosure is the Russell 3000 Automobiles and Parts Supersector Index, which we also utilize in the stock performance graph provided in our annual report pursuant to Item 201(e) of Regulation S-K. For purposes of disclosure in our 2023 proxy statement, we used the Dow Jones Auto Index (the "Prior Peer Group"). We believe the Russell 3000 Automobiles and Parts Supersector Index is a better comparative index than the Prior Peer Group due to the limited number of companies used in the Prior Peer Group and the Company's outsized impact on the performance of the Prior Peer Group. The 2023 retention grant was based on the TSR of the Russell 3000 Automobiles and Parts Supersector. The TSR for the Prior Peer Group for each respective year reported in the table is as follows: $117.51 as of December 31, 2020; $142.18 as of December 31, 2021; $104.59 as of December 31, 2022; $104.54 as of December 31, 2023; and $81.90 as of December 31, 2024.
|
|
|
|
|
| PEO Total Compensation Amount |
$ 5,945,970
|
$ 4,780,362
|
$ 7,111,530
|
$ 4,508,367
|
$ 3,661,366
|
| PEO Actually Paid Compensation Amount |
$ 3,212,939
|
2,340,513
|
12,940,505
|
571,286
|
3,978,785
|
| Adjustment To PEO Compensation, Footnote |
Compensation Actually Paid ("CAP") amounts include total compensation per the Summary Compensation Table, adjusted as set forth in the table below, as determined in accordance with applicable SEC rules. For awards with dividend rights, these amounts are paid in Company shares once the underlying award vests and are incorporated as applicable in the table below. The dollar amounts reflected in the table above do not reflect the actual amount of compensation earned by or paid to our CEO during the applicable year. For information regarding the decisions made by our Compensation Committee and the Board in regard to the CEO's compensation for each fiscal year, please see the Compensation Discussion and Analysis section of the Proxy Statements reporting pay for the fiscal years covered in the table above. | | | | | | | | | | | | | | | | | | | | | | | | | | | | | | | | | | 2025 | 2024 | 2023 | 2022 | 2021 | | PEO | Average for Non-PEO NEOs | PEO | Average for Non-PEO NEOs | PEO | Average for Non-PEO NEOs | PEO | Average for Non-PEO NEOs | PEO | Average for Non-PEO NEOs | | Summary Compensation Table Total Compensation ($) | 5,945,970 | | 2,145,146 | | 4,780,362 | | 1,756,723 | | 7,111,530 | | 2,810,684 | | 4,508,367 | | 1,514,556 | | 3,661,366 | | 1,421,813 | | | Less: Stock and Option Award Values Reported in Summary Compensation Table for the Covered Year ($) | (3,741,489) | | (1,031,433) | | (2,931,383) | | (787,506) | | (4,418,429) | | (1,525,194) | | (2,865,225) | | (696,593) | | (2,132,006) | | (709,037) | | | Plus: Fair Value for Stock and Option Awards Granted in the Covered Year ($) | 3,594,610 | | 990,972 | | 2,422,263 | | 650,751 | | 7,314,339 | | 2,058,941 | | 2,532,729 | | 615,757 | | 2,128,952 | | 708,021 | | | Change in Fair Value of Outstanding Unvested Stock and Option Awards from Prior Years ($) | (2,186,345) | | (712,202) | | (2,042,966) | | (558,216) | | 3,823,698 | | 973,959 | | (2,803,562) | | (665,677) | | 298,465 | | 91,118 | | | Change in Fair Value of Stock and Option Awards from Prior Years that Vested in the Covered Year ($) | (399,807) | | (97,172) | | 112,237 | | 37,356 | | (357,629) | | (126,852) | | (434,402) | | (123,166) | | 22,008 | | 11,675 | | | Less: Fair Value of Stock and Option Awards Forfeited during the Covered Year ($) | — | | — | | — | | — | | (533,004) | | (155,583) | | (366,621) | | (93,877) | | — | | — | | | | | | | | | | | | | | | | | | | | | | | | | Compensation Actually Paid ($) | 3,212,939 | | 1,295,311 | | 2,340,513 | | 1,099,108 | | 12,940,505 | | 4,035,955 | | 571,286 | | 551,000 | | 3,978,785 | | 1,523,590 | |
|
|
|
|
|
| Non-PEO NEO Average Total Compensation Amount |
$ 2,145,146
|
1,756,723
|
2,810,684
|
1,514,556
|
1,421,813
|
| Non-PEO NEO Average Compensation Actually Paid Amount |
$ 1,295,311
|
1,099,108
|
4,035,955
|
551,000
|
1,523,590
|
| Adjustment to Non-PEO NEO Compensation Footnote |
Compensation Actually Paid ("CAP") amounts include total compensation per the Summary Compensation Table, adjusted as set forth in the table below, as determined in accordance with applicable SEC rules. For awards with dividend rights, these amounts are paid in Company shares once the underlying award vests and are incorporated as applicable in the table below. The dollar amounts reflected in the table above do not reflect the actual amount of compensation earned by or paid to our CEO during the applicable year. For information regarding the decisions made by our Compensation Committee and the Board in regard to the CEO's compensation for each fiscal year, please see the Compensation Discussion and Analysis section of the Proxy Statements reporting pay for the fiscal years covered in the table above. | | | | | | | | | | | | | | | | | | | | | | | | | | | | | | | | | | 2025 | 2024 | 2023 | 2022 | 2021 | | PEO | Average for Non-PEO NEOs | PEO | Average for Non-PEO NEOs | PEO | Average for Non-PEO NEOs | PEO | Average for Non-PEO NEOs | PEO | Average for Non-PEO NEOs | | Summary Compensation Table Total Compensation ($) | 5,945,970 | | 2,145,146 | | 4,780,362 | | 1,756,723 | | 7,111,530 | | 2,810,684 | | 4,508,367 | | 1,514,556 | | 3,661,366 | | 1,421,813 | | | Less: Stock and Option Award Values Reported in Summary Compensation Table for the Covered Year ($) | (3,741,489) | | (1,031,433) | | (2,931,383) | | (787,506) | | (4,418,429) | | (1,525,194) | | (2,865,225) | | (696,593) | | (2,132,006) | | (709,037) | | | Plus: Fair Value for Stock and Option Awards Granted in the Covered Year ($) | 3,594,610 | | 990,972 | | 2,422,263 | | 650,751 | | 7,314,339 | | 2,058,941 | | 2,532,729 | | 615,757 | | 2,128,952 | | 708,021 | | | Change in Fair Value of Outstanding Unvested Stock and Option Awards from Prior Years ($) | (2,186,345) | | (712,202) | | (2,042,966) | | (558,216) | | 3,823,698 | | 973,959 | | (2,803,562) | | (665,677) | | 298,465 | | 91,118 | | | Change in Fair Value of Stock and Option Awards from Prior Years that Vested in the Covered Year ($) | (399,807) | | (97,172) | | 112,237 | | 37,356 | | (357,629) | | (126,852) | | (434,402) | | (123,166) | | 22,008 | | 11,675 | | | Less: Fair Value of Stock and Option Awards Forfeited during the Covered Year ($) | — | | — | | — | | — | | (533,004) | | (155,583) | | (366,621) | | (93,877) | | — | | — | | | | | | | | | | | | | | | | | | | | | | | | | Compensation Actually Paid ($) | 3,212,939 | | 1,295,311 | | 2,340,513 | | 1,099,108 | | 12,940,505 | | 4,035,955 | | 571,286 | | 551,000 | | 3,978,785 | | 1,523,590 | |
|
|
|
|
|
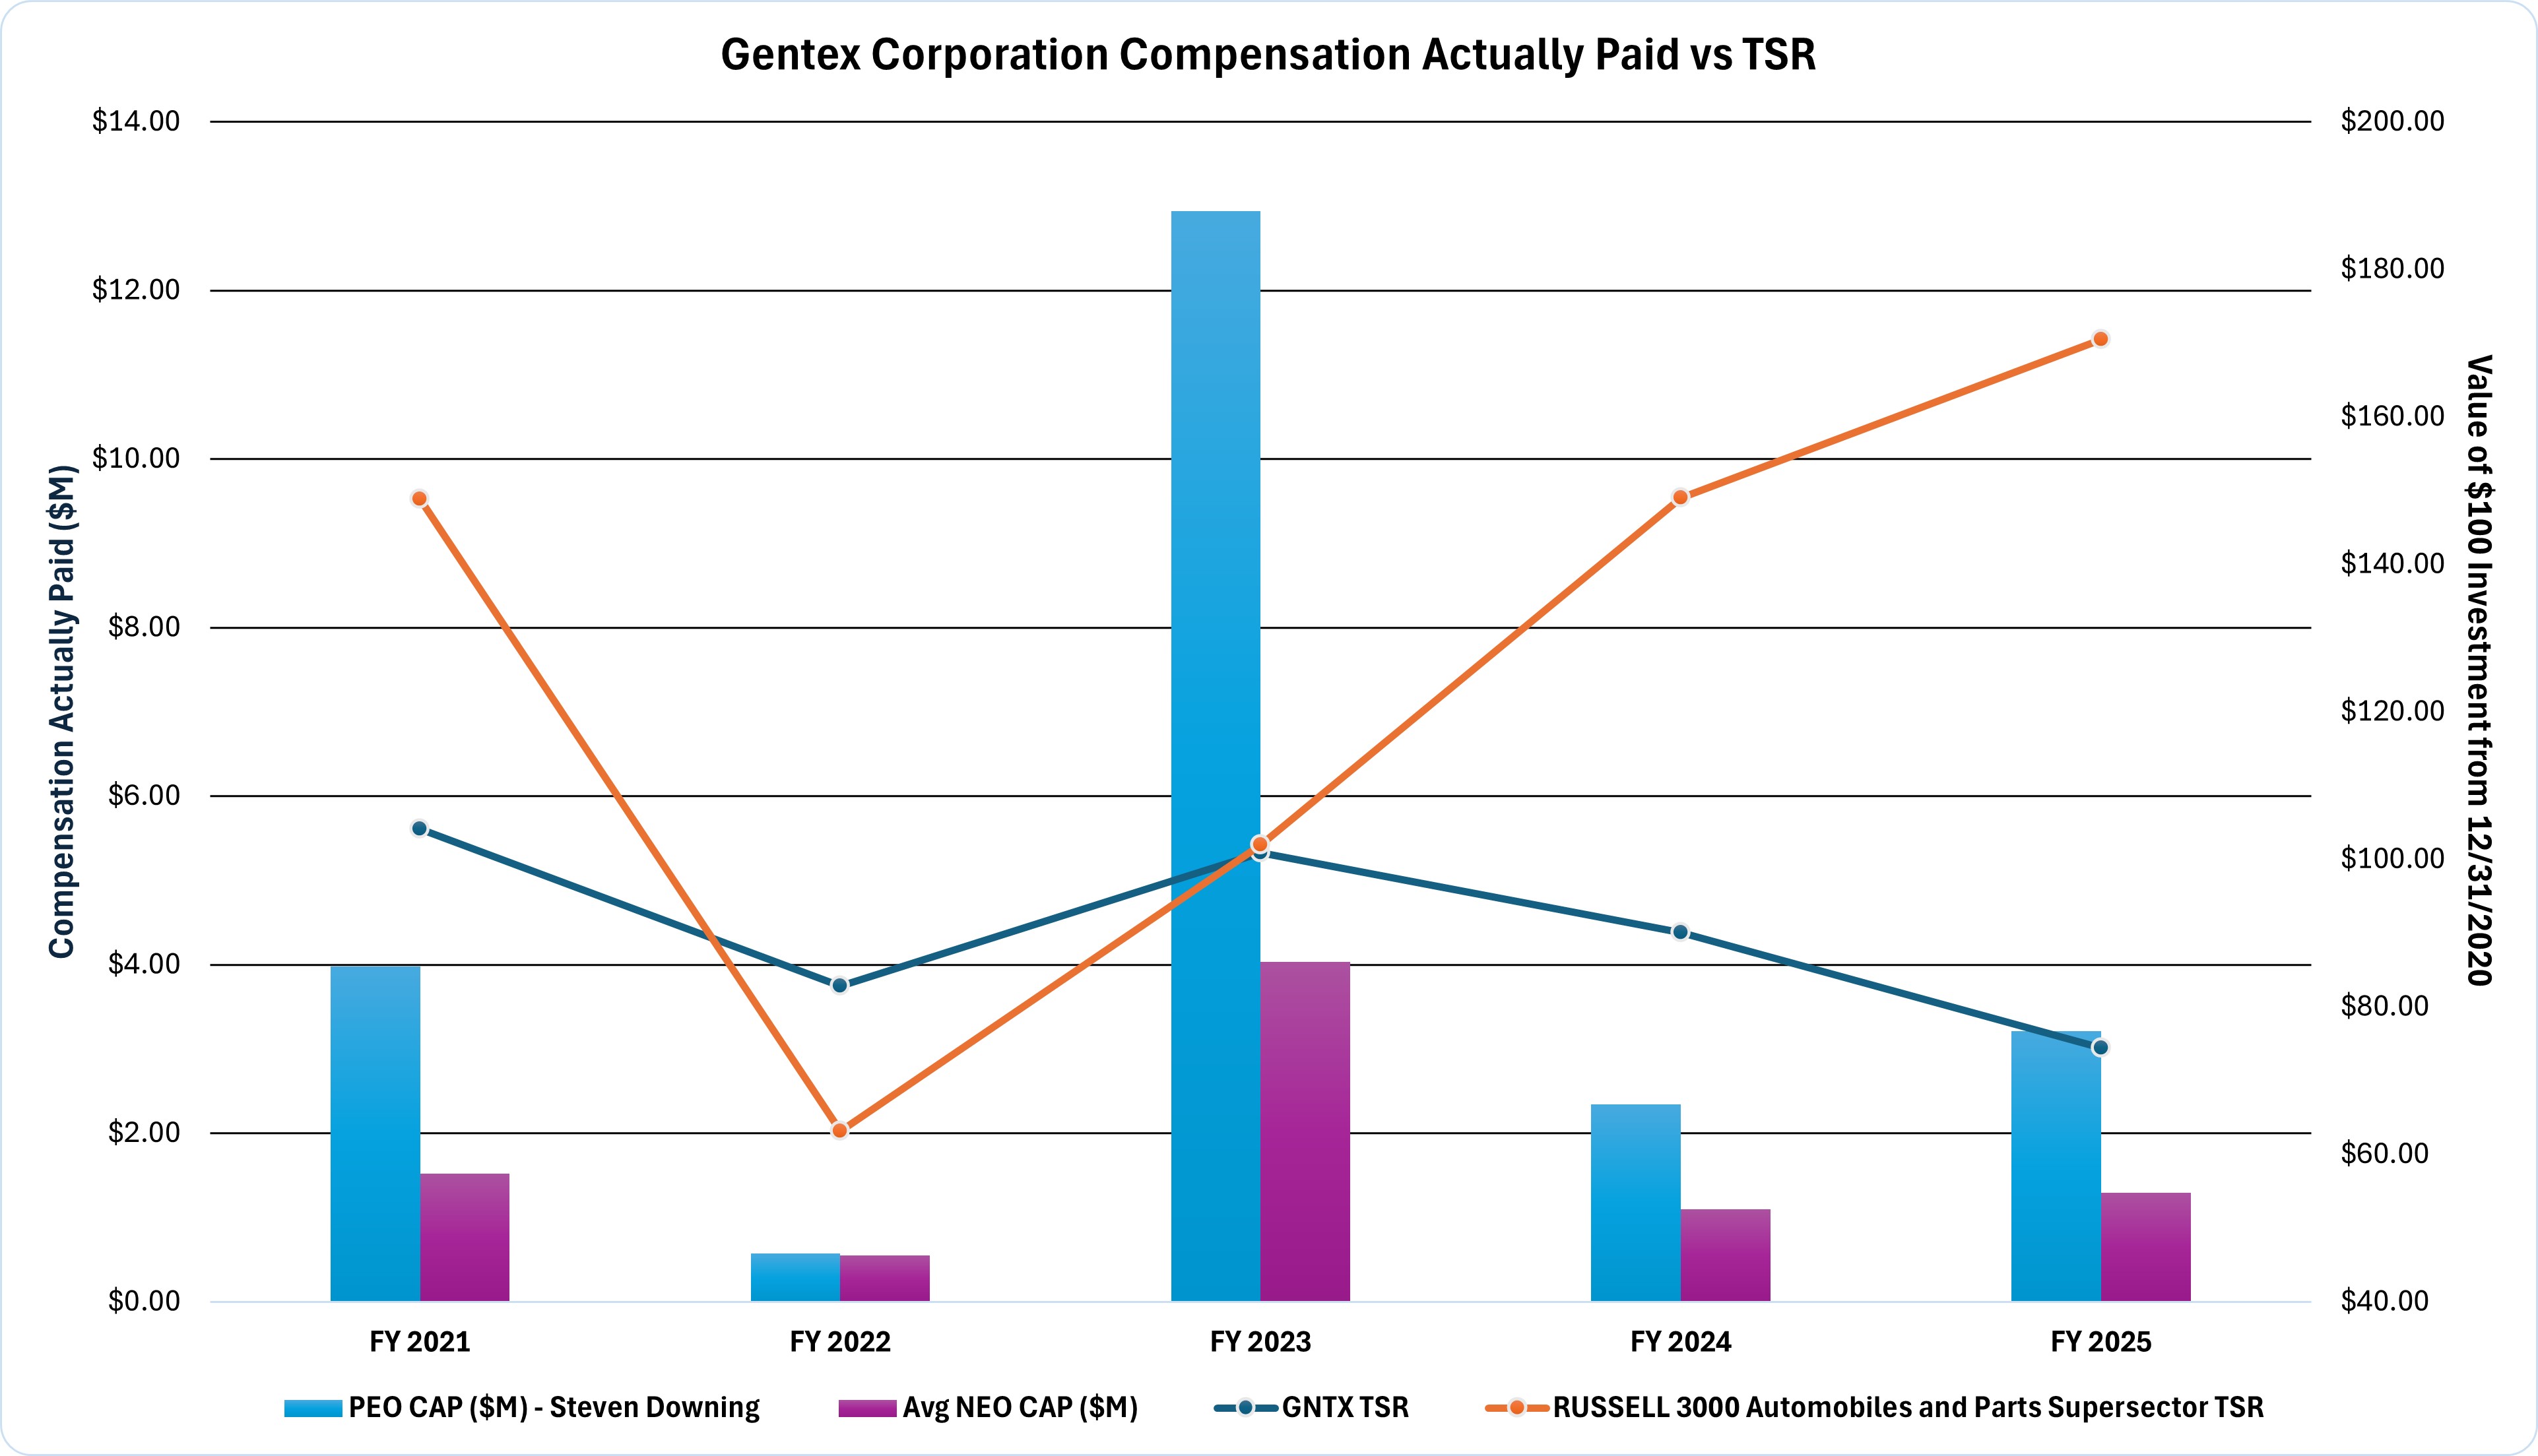
| Compensation Actually Paid vs. Total Shareholder Return |
The graphs below describe the relationship between pay and performance by comparing compensation actually paid to our CEO, as well as average compensation actually paid to our other NEOs, to our cumulative TSR, peer group TSR, net income, and net sales.
|
|
|
|
|
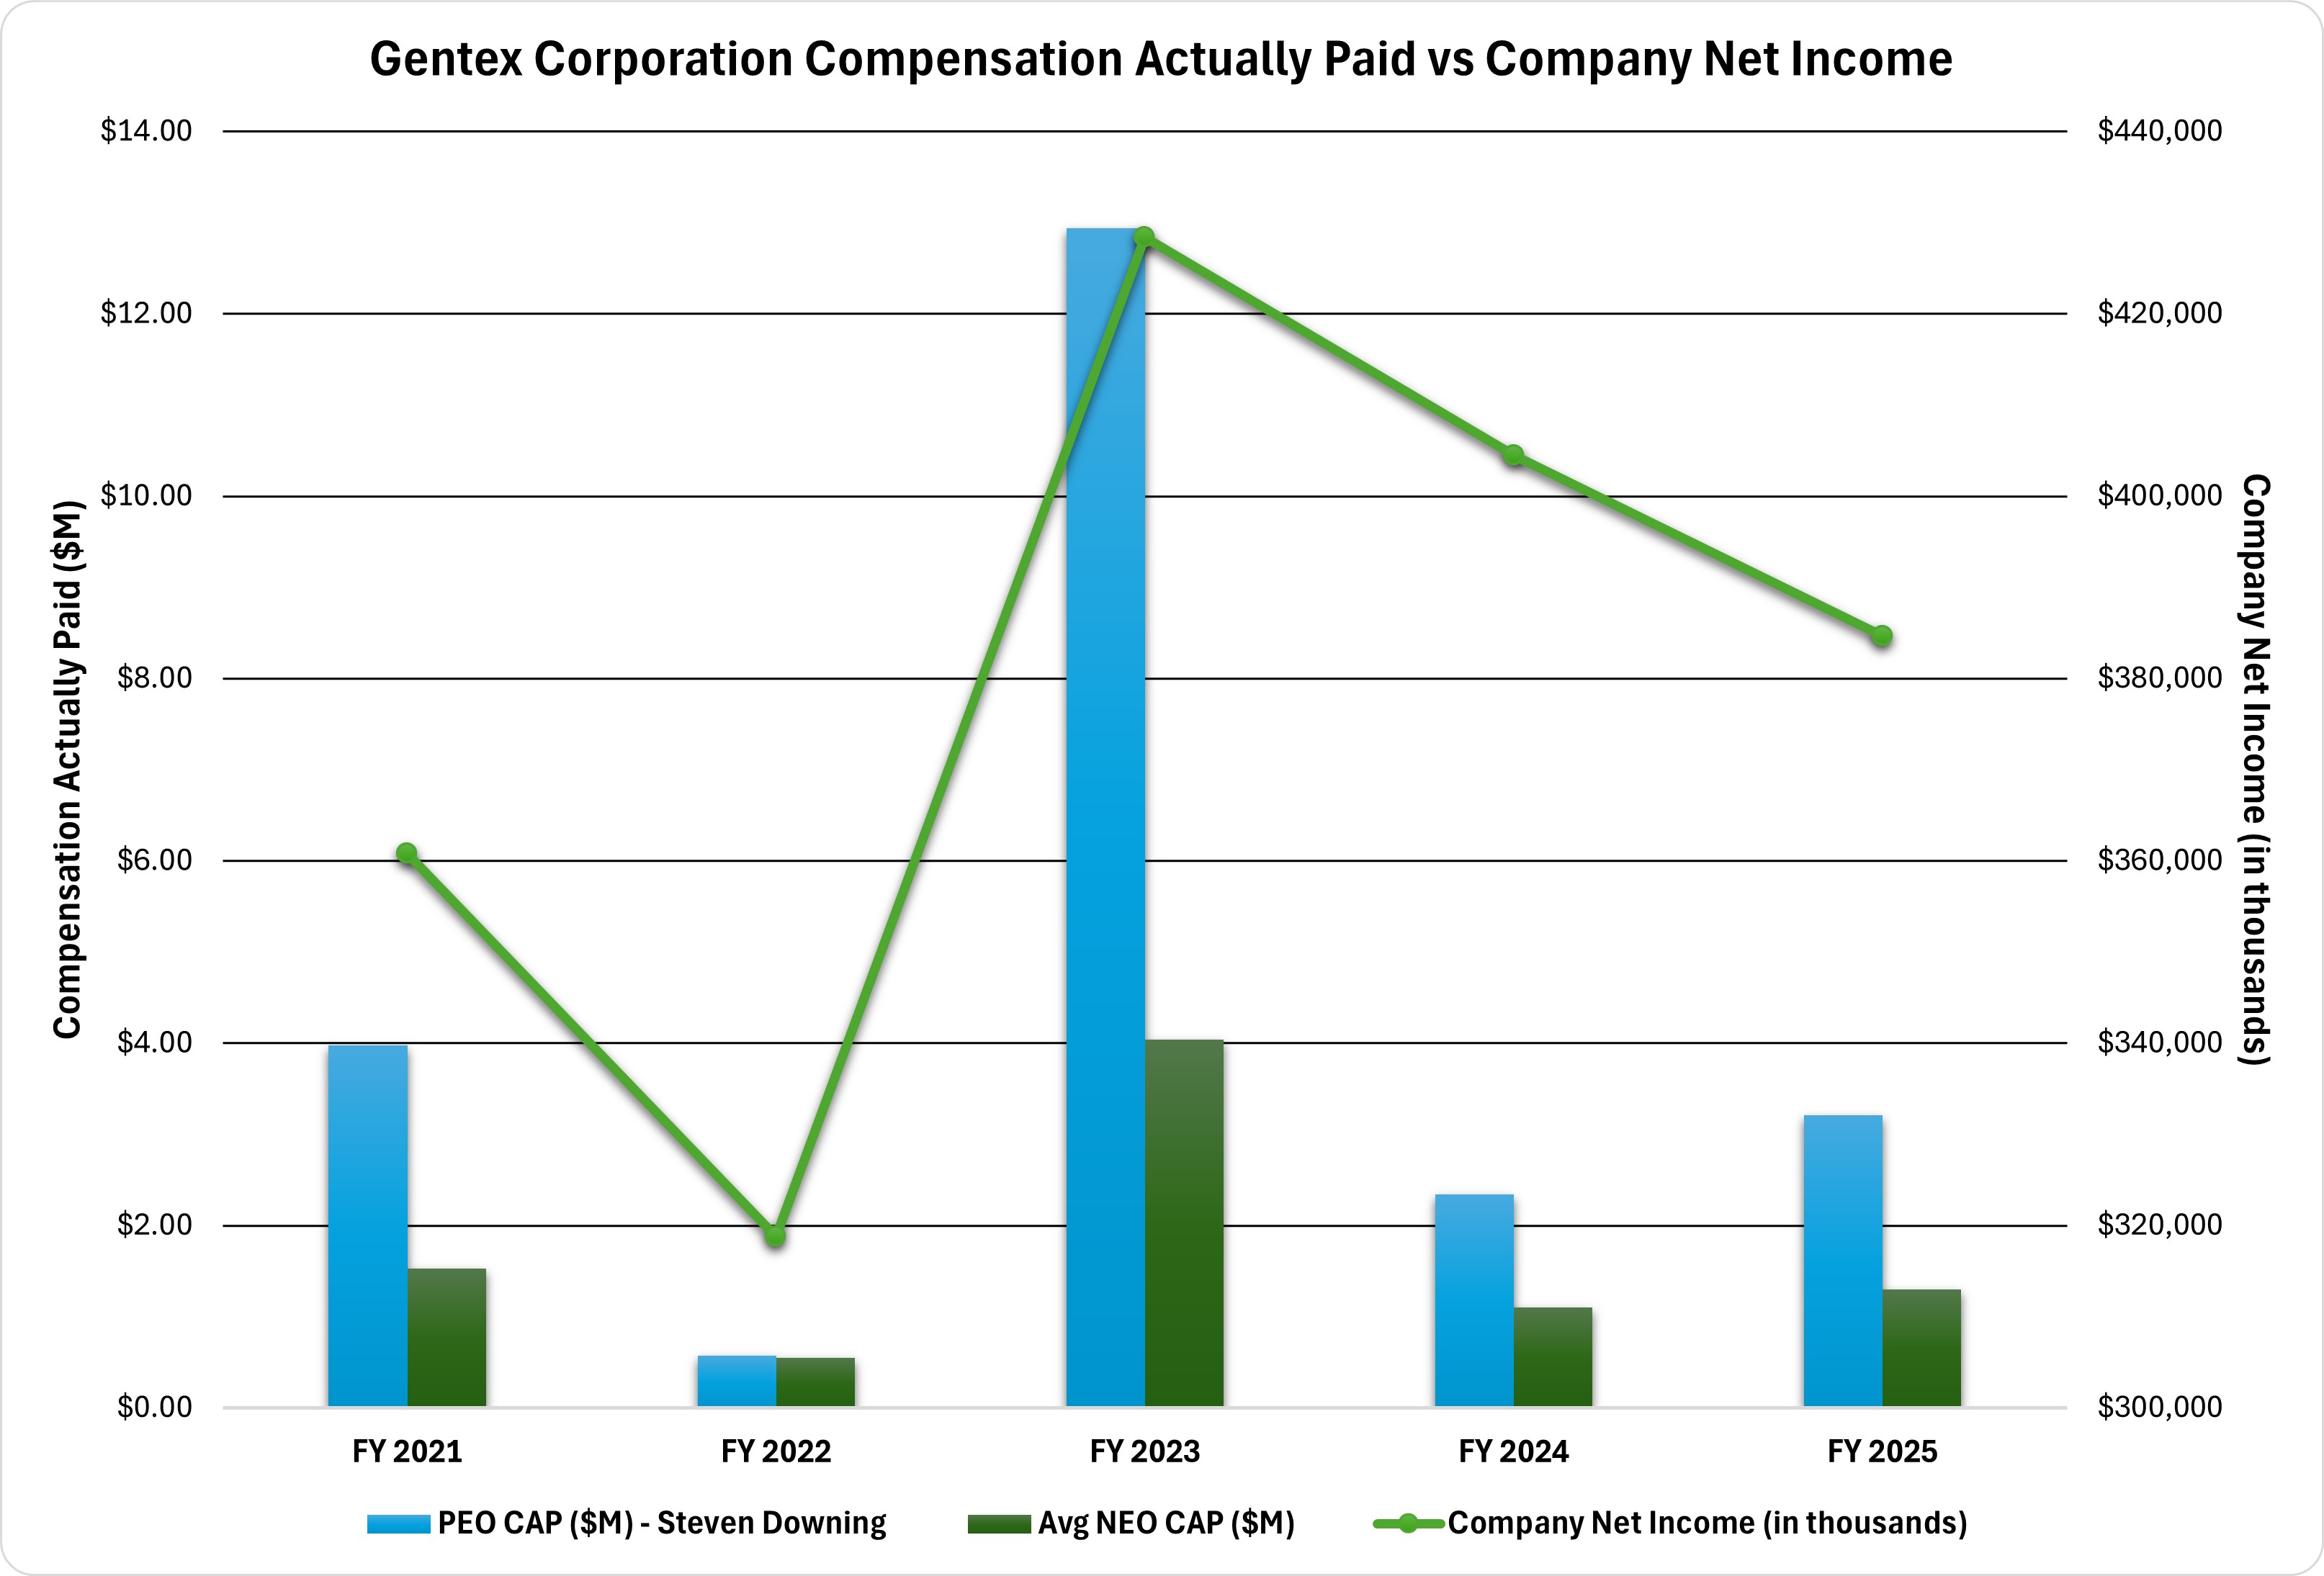
| Compensation Actually Paid vs. Net Income |
The graphs below describe the relationship between pay and performance by comparing compensation actually paid to our CEO, as well as average compensation actually paid to our other NEOs, to our cumulative TSR, peer group TSR, net income, and net sales.
|
|
|
|
|
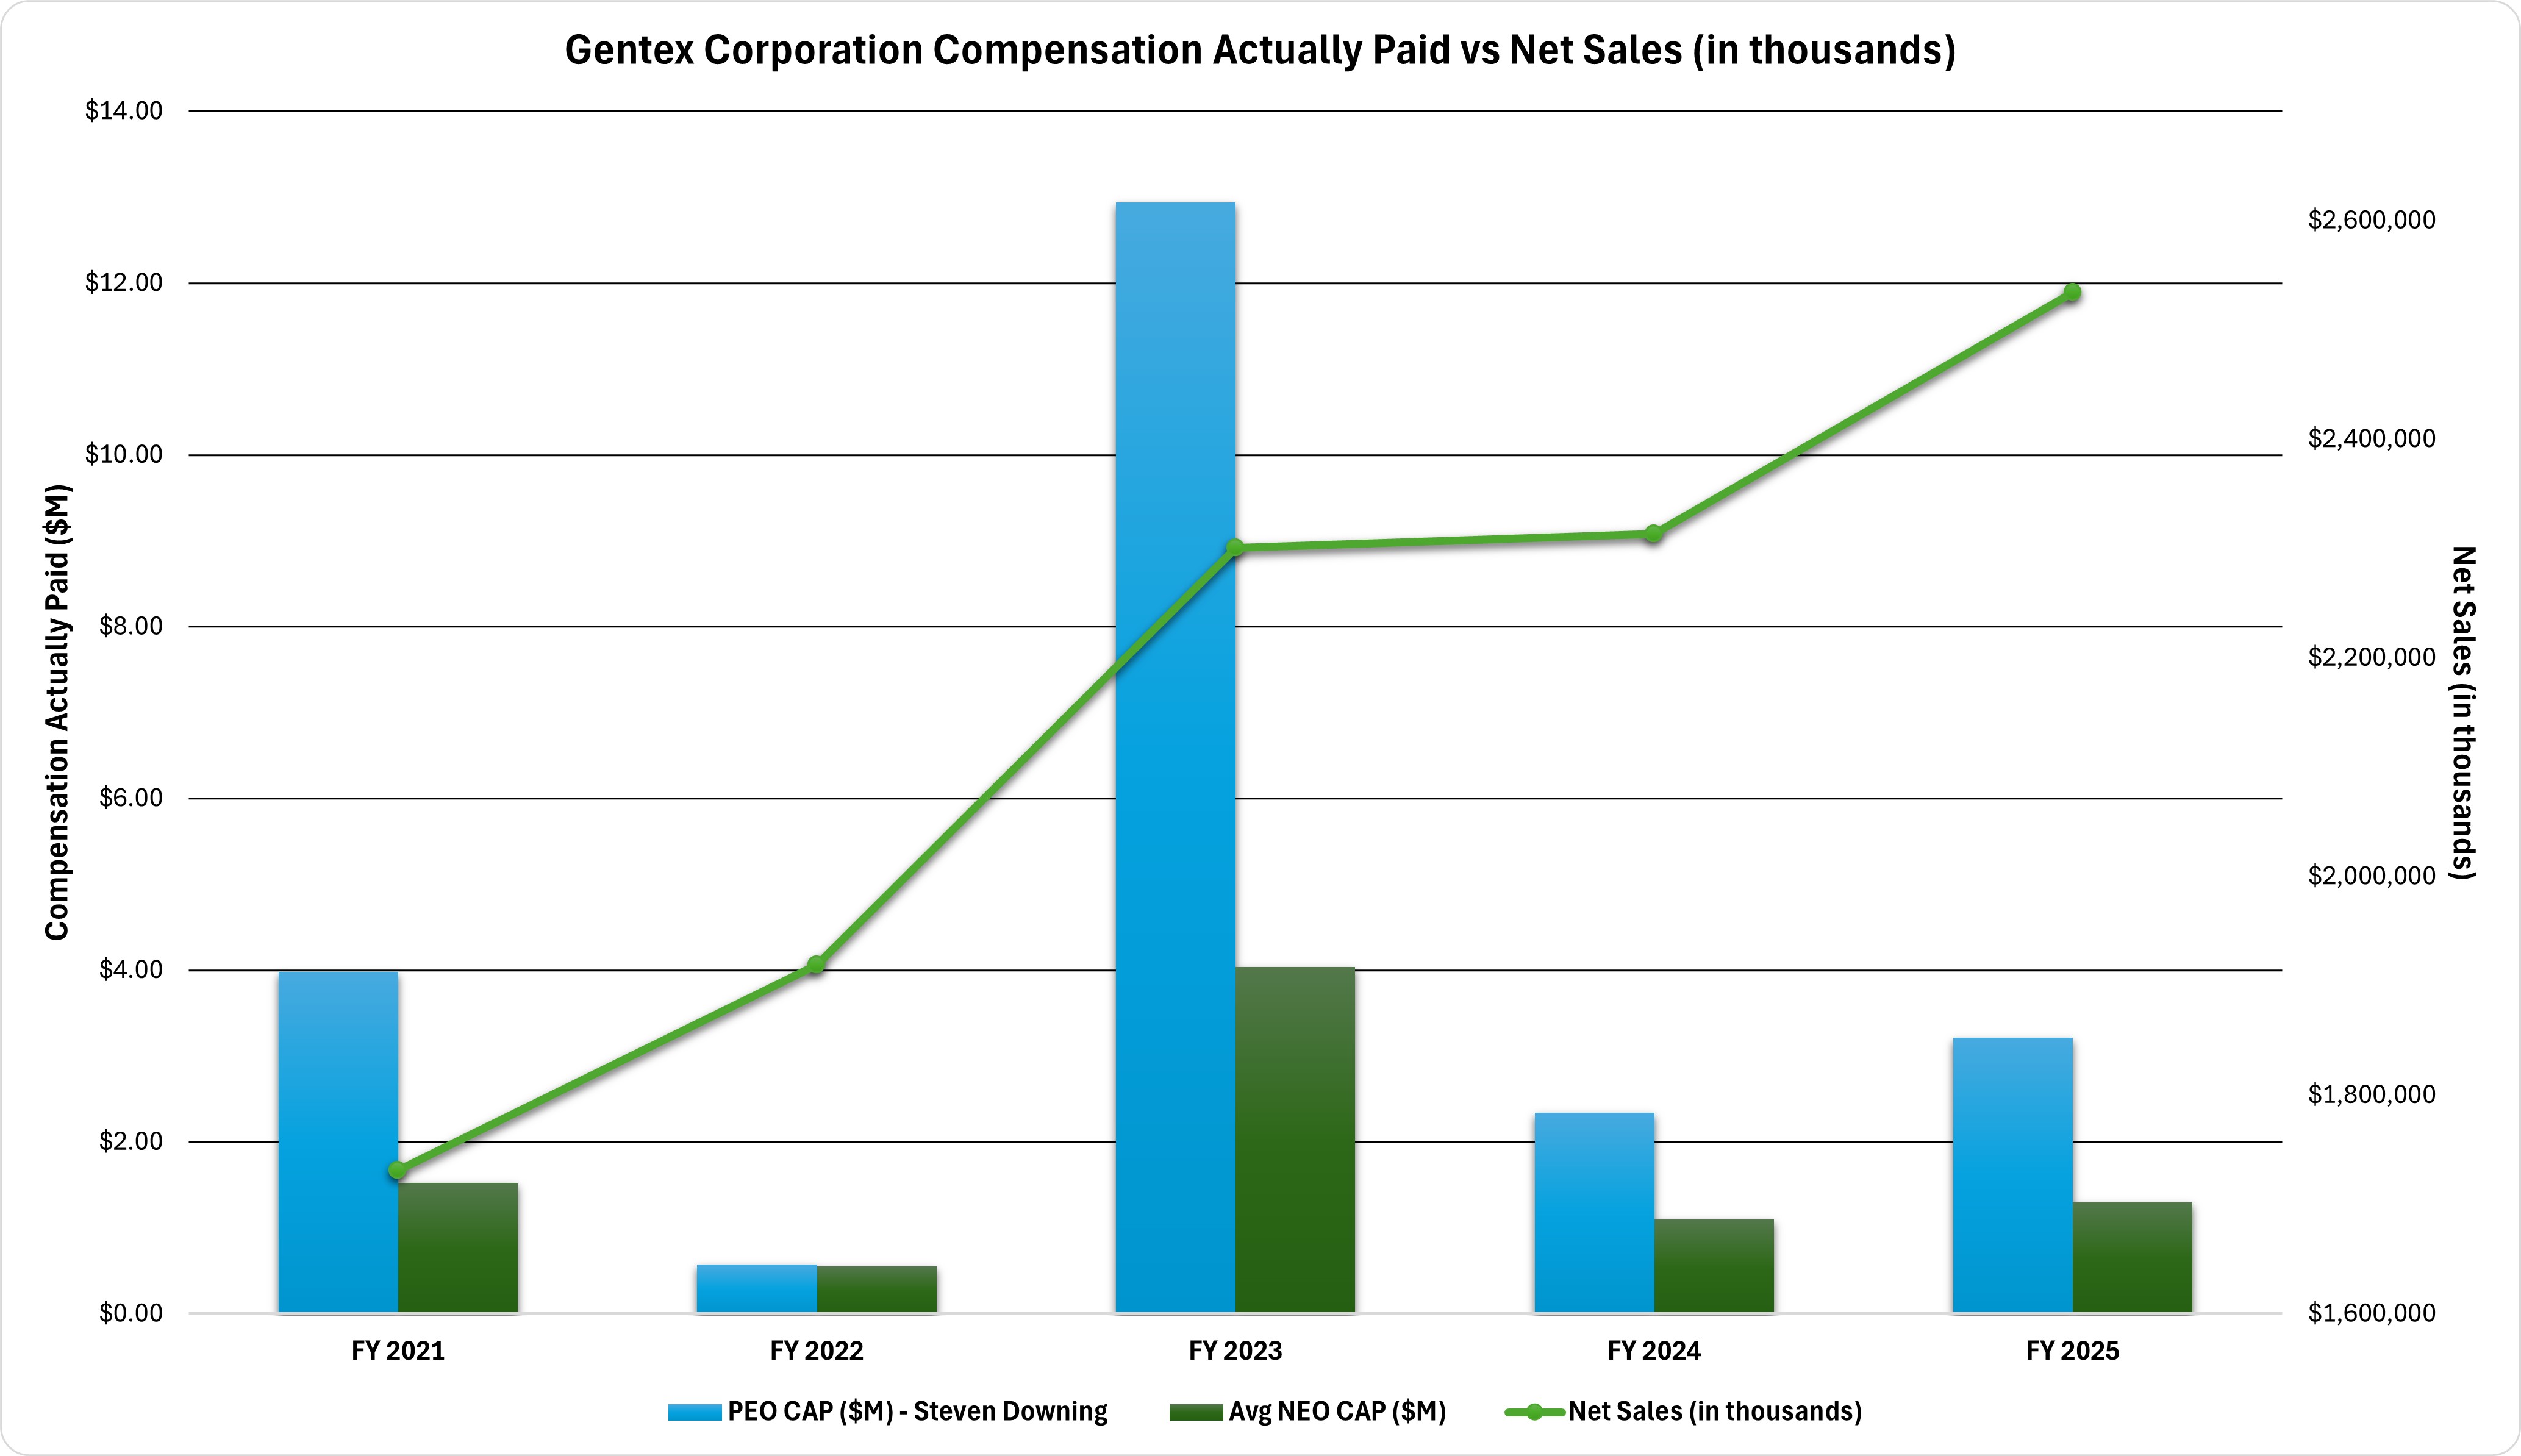
| Compensation Actually Paid vs. Company Selected Measure |
The graphs below describe the relationship between pay and performance by comparing compensation actually paid to our CEO, as well as average compensation actually paid to our other NEOs, to our cumulative TSR, peer group TSR, net income, and net sales.
|
|
|
|
|
| Total Shareholder Return Vs Peer Group |
The graphs below describe the relationship between pay and performance by comparing compensation actually paid to our CEO, as well as average compensation actually paid to our other NEOs, to our cumulative TSR, peer group TSR, net income, and net sales.
|
|
|
|
|
| Tabular List, Table |
| | | | | | | Measure | Description | | EBITDA | Earnings before Interest, Taxes, Depreciation, and Amortization. | | ROIC | Return On Invested Capital | | Operating Income | GAAP Operating Income compared to target | | Earnings Per Diluted Share | GAAP Earnings Per Diluted Share compared to target |
|
|
|
|
|
| Total Shareholder Return Amount |
$ 74.41
|
90.09
|
100.90
|
82.86
|
104.14
|
| Peer Group Total Shareholder Return Amount |
170.48
|
149.07
|
101.94
|
63.17
|
148.83
|
| Net Income (Loss) |
$ 384,841,000
|
$ 404,488,000
|
$ 428,403,000
|
$ 318,757,000
|
$ 360,797,000
|
| Company Selected Measure Amount |
2,534,269,000
|
2,313,314,000
|
2,300,845,000
|
1,918,958,000
|
1,731,170,000
|
| PEO Name |
Steve Downing
|
|
|
|
|
| Additional 402(v) Disclosure |
Net Sales is selected as the most important performance measurement for the current year, which together with Net Income, are presented in the table.
|
|
|
|
|
| Measure:: 1 |
|
|
|
|
|
| Pay vs Performance Disclosure |
|
|
|
|
|
| Name |
EBITDA
|
|
|
|
|
| Measure:: 2 |
|
|
|
|
|
| Pay vs Performance Disclosure |
|
|
|
|
|
| Name |
ROIC
|
|
|
|
|
| Measure:: 3 |
|
|
|
|
|
| Pay vs Performance Disclosure |
|
|
|
|
|
| Name |
Operating Income
|
|
|
|
|
| Measure:: 4 |
|
|
|
|
|
| Pay vs Performance Disclosure |
|
|
|
|
|
| Name |
Earnings Per Diluted Share
|
|
|
|
|
| PEO | Aggregate Grant Date Fair Value of Equity Award Amounts Reported in Summary Compensation Table |
|
|
|
|
|
| Pay vs Performance Disclosure |
|
|
|
|
|
| Adjustment to Compensation, Amount |
$ (3,741,489)
|
$ (2,931,383)
|
$ (4,418,429)
|
$ (2,865,225)
|
$ (2,132,006)
|
| PEO | Year-end Fair Value of Equity Awards Granted in Covered Year that are Outstanding and Unvested |
|
|
|
|
|
| Pay vs Performance Disclosure |
|
|
|
|
|
| Adjustment to Compensation, Amount |
3,594,610
|
2,422,263
|
7,314,339
|
2,532,729
|
2,128,952
|
| PEO | Year-over-Year Change in Fair Value of Equity Awards Granted in Prior Years That are Outstanding and Unvested |
|
|
|
|
|
| Pay vs Performance Disclosure |
|
|
|
|
|
| Adjustment to Compensation, Amount |
(2,186,345)
|
(2,042,966)
|
3,823,698
|
(2,803,562)
|
298,465
|
| PEO | Change in Fair Value as of Vesting Date of Prior Year Equity Awards Vested in Covered Year |
|
|
|
|
|
| Pay vs Performance Disclosure |
|
|
|
|
|
| Adjustment to Compensation, Amount |
(399,807)
|
112,237
|
(357,629)
|
(434,402)
|
22,008
|
| PEO | Prior Year End Fair Value of Equity Awards Granted in Any Prior Year that Fail to Meet Applicable Vesting Conditions During Covered Year |
|
|
|
|
|
| Pay vs Performance Disclosure |
|
|
|
|
|
| Adjustment to Compensation, Amount |
0
|
0
|
(533,004)
|
(366,621)
|
0
|
| Non-PEO NEO | Aggregate Grant Date Fair Value of Equity Award Amounts Reported in Summary Compensation Table |
|
|
|
|
|
| Pay vs Performance Disclosure |
|
|
|
|
|
| Adjustment to Compensation, Amount |
(1,031,433)
|
(787,506)
|
(1,525,194)
|
(696,593)
|
(709,037)
|
| Non-PEO NEO | Year-end Fair Value of Equity Awards Granted in Covered Year that are Outstanding and Unvested |
|
|
|
|
|
| Pay vs Performance Disclosure |
|
|
|
|
|
| Adjustment to Compensation, Amount |
990,972
|
650,751
|
2,058,941
|
615,757
|
708,021
|
| Non-PEO NEO | Year-over-Year Change in Fair Value of Equity Awards Granted in Prior Years That are Outstanding and Unvested |
|
|
|
|
|
| Pay vs Performance Disclosure |
|
|
|
|
|
| Adjustment to Compensation, Amount |
(712,202)
|
(558,216)
|
973,959
|
(665,677)
|
91,118
|
| Non-PEO NEO | Change in Fair Value as of Vesting Date of Prior Year Equity Awards Vested in Covered Year |
|
|
|
|
|
| Pay vs Performance Disclosure |
|
|
|
|
|
| Adjustment to Compensation, Amount |
(97,172)
|
37,356
|
(126,852)
|
(123,166)
|
11,675
|
| Non-PEO NEO | Prior Year End Fair Value of Equity Awards Granted in Any Prior Year that Fail to Meet Applicable Vesting Conditions During Covered Year |
|
|
|
|
|
| Pay vs Performance Disclosure |
|
|
|
|
|
| Adjustment to Compensation, Amount |
$ 0
|
$ 0
|
$ (155,583)
|
$ (93,877)
|
$ 0
|