Pay vs Performance Disclosure - USD ($)
Dec. 31, 2025
Dec. 31, 2024
Dec. 31, 2023
Dec. 31, 2022
Dec. 31, 2021
PAY VERSUS PERFORMANCE
As required by Item 402(v) of Regulation S-K, we are providing the following table and related disclosures. The information contained in this section shall not be deemed incorporated by reference in any filing under the Securities Act of 1933, as amended, or the Exchange Act.
PAY VERSUS PERFORMANCE TABLE
The following table sets forth the compensation information of our Principal Executive Officer (PEO) and the average compensation for our other named executive officers (non-PEO NEOs), along with the total shareholder return and net income for each of fiscal year 2025, 2024, 2023, 2022 and 2021. For further information regarding our executive compensation programs, please refer to the section entitled “Compensation Discussion and Analysis.”
Year | Summary Compensation Table Total for PEO(1) | Compensation Actually Paid to PEO(2) | Average Summary Compensation Table Total for non-PEO NEOs(1) | Average Compensation Actually Paid to non-PEO NEOs(3) | Value of Initial Fixed $100 Investment Based On: | Net Income | Company- Selected Measure(5) | |||||||||||||||||||
Total Shareholder Return(4) | Peer Group Total Shareholder Return(4) | |||||||||||||||||||||||||
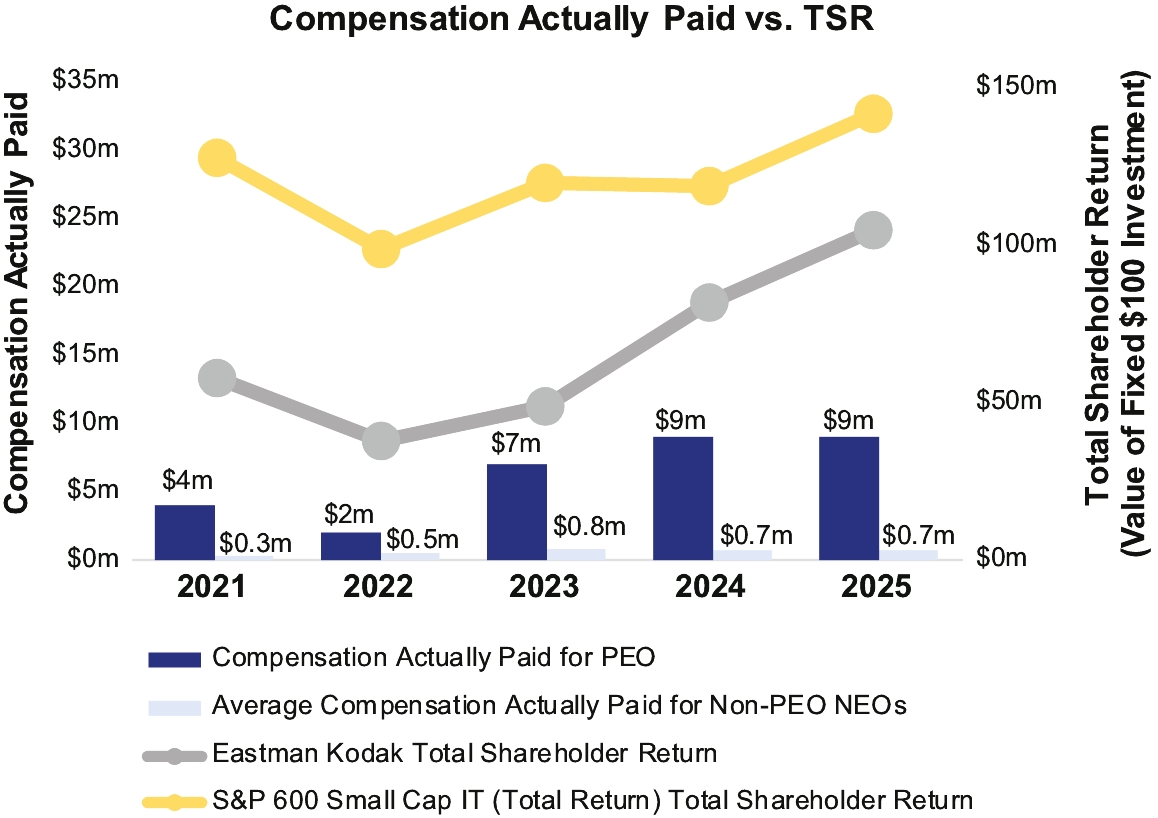
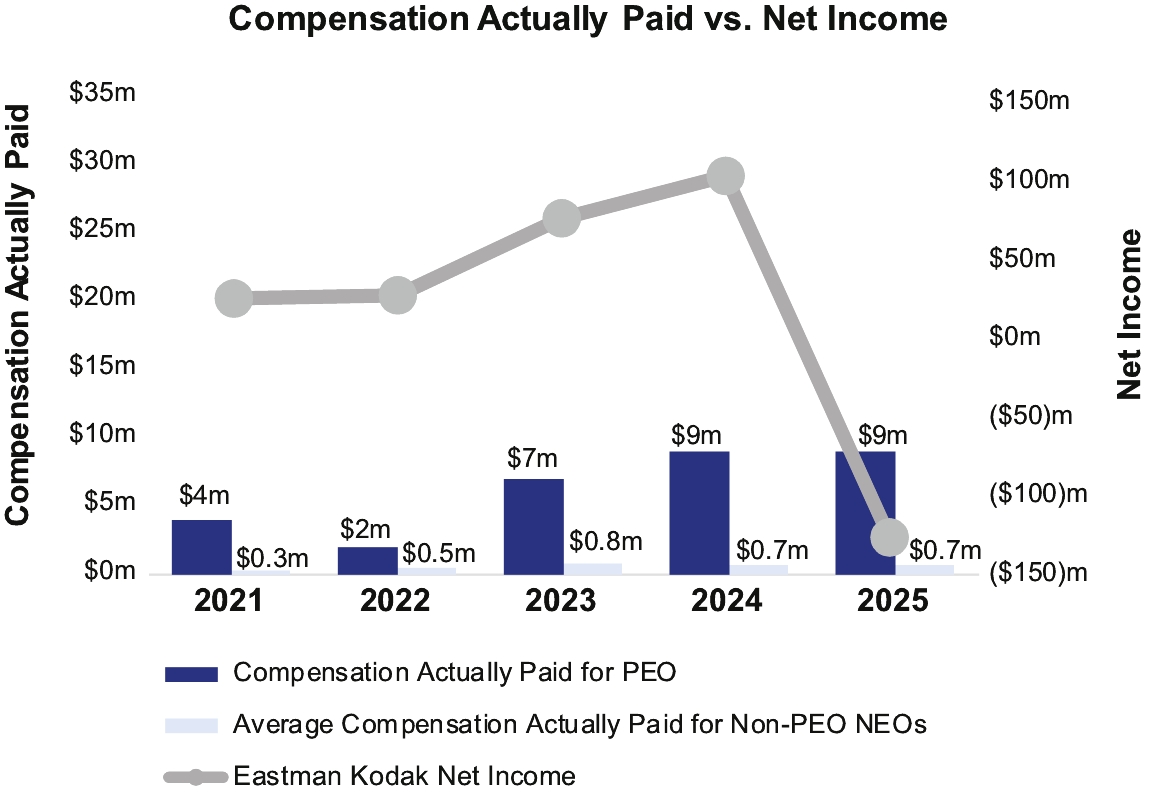
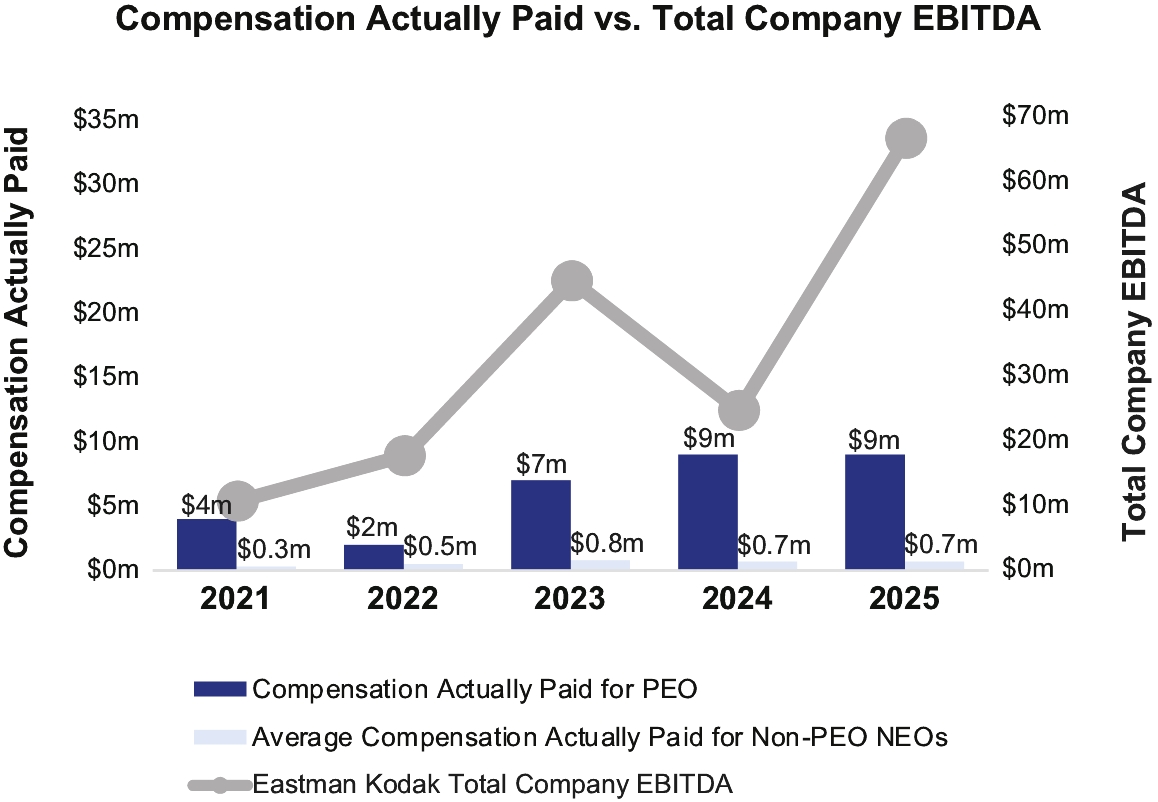
2025 | $6,824,970 | $8,828,564 | $598,309 | $666,147 | $104 | $141 | ($128,000,000) | $62,000,000 | ||||||||||||||||||
2024 | $6,232,547 | $9,196,190 | $571,616 | $738,240 | $81 | $118 | $102,000,000 | $26,000,000 | ||||||||||||||||||
2023 | $7,064,526 | $7,108,443 | $1,145,422 | $791,988 | $48 | $119 | $80,000,000 | $45,000,000 | ||||||||||||||||||
2022 | $2,703,120 | $1,862,776 | $478,669 | $464,672 | $37 | $98 | $26,000,000 | $18,000,000 | ||||||||||||||||||
2021 | $6,042,091 | $4,167,196 | $459,305 | $343,204 | $57 | $127 | $24,000,000 | $11,000,000 | ||||||||||||||||||
(1) | Our PEO for 2020 through 2025 was James V. Continenza. The individuals comprising our non-PEO NEOs for each year were as follows: |
2021 | 2022 | 2023 | 2024 | 2025 | ||||||||||
David E. Bullwinkle | David E. Bullwinkle | David E. Bullwinkle | David E. Bullwinkle | David E. Bullwinkle | ||||||||||
John O’Grady | Terry R. Taber | Terry R. Taber | Terry R. Taber | Terry R. Taber | ||||||||||
Randy D. Vandagriff | Roger W. Byrd | Roger W. Byrd | Roger W. Byrd | |||||||||||
Roger W. Byrd | Richard T. Michaels | Richard T. Michaels | Richard T. Michaels | |||||||||||
John O’Grady | ||||||||||||||
(2) | The dollar amounts reported in this column represent the amount of “compensation actually paid” to the PEO in 2025, 2024, 2023, 2022, and 2021, as computed in accordance with Item 402(v) of Regulation S-K. Equity compensation fair value was calculated based on assumptions determined in accordance with FASB ASC Topic 718. The dollar amounts do not necessarily reflect the actual amount of compensation earned by or paid to the PEO during the applicable fiscal years. |
PEO Compensation Actually Paid Detail | |||||||||||||||||
Compensation Actually Paid Detail | |||||||||||||||||
Compensation Element | 2021 | 2022 | 2023 | 2024 | 2025 | ||||||||||||
Summary Compensation Table (SCT) Reported Total Compensation | $6,042,091 | $2,703,120 | $7,064,526 | $6,232,547 | $6,824,970 | ||||||||||||
Aggregate SCT Reported Equity Compensation (-) | ($5,000,000) | ($1,428,000) | ($3,760,150) | ($3,904,340) | ($2,500,004) | ||||||||||||
Year-End Fair Value of Awards Granted During the FY & Outstanding (+) | $1,404,000 | $915,000 | $3,467,123 | $3,548,201 | $2,807,451 | ||||||||||||
Year-Over-Year Change in Fair Value of Awards Granted During Previous FYs & Outstanding (+/-) | $0 | ($326,000) | $255,000 | $1,849,432 | $1,240,553 | ||||||||||||
PEO Compensation Actually Paid Detail | |||||||||||||||||
Compensation Actually Paid Detail | |||||||||||||||||
Compensation Element | 2021 | 2022 | 2023 | 2024 | 2025 | ||||||||||||
Vesting Date Fair Value of Awards Granted & Vested During the Covered FY (+) | $1,724,000 | $0 | $0 | $974,191 | $0 | ||||||||||||
Year-Over-Year Change in Fair Value of Awards Granted During Previous FYs & Vested During Covered FY (+/-) | $0 | $8,000 | $94,000 | $537,722 | $492,965 | ||||||||||||
Prior FYE Value of Awards Determined to Fail to Meet Vesting Conditions During Covered FY (-) | $0 | $0 | $0 | $0 | $0 | ||||||||||||
Aggregate Change in the Actuarial Present Value of the Accumulated Benefits under Actuarial Pension Plans Reported in the SCT (-) | ($26,324) | ($278,604) | ($307,860) | ($81,691) | ($78,450) | ||||||||||||
Actuarially Determined Service Costs for Services Rendered During the Fiscal Year (+) | $23,429 | $33,524 | $36,928 | $40,128 | $41,080 | ||||||||||||
Cost/Credit of Benefits Granted During the Covered FY Attributed to Services Rendered in Periods Prior to an Amendment/Initiation (+) | $0 | $235,736 | $258,876 | $0 | $0 | ||||||||||||
Compensation Actually Paid Determination | $4,167,196 | $1,862,776 | $7,108,443 | $9,196,190 | $8,828,564 | ||||||||||||
(3) | The dollar amounts reported in this column represent the average amount of “compensation actually paid” to the non-PEO NEOs in 2025,2024, 2023, 2022, and 2021, as computed in accordance with Item 402(v) of Regulation S-K. Equity compensation fair value was calculated based on assumptions determined in accordance with FASB ASC Topic 718. The dollar amounts do not necessarily reflect the actual average amount of compensation earned by or paid to the non-PEO NEOs during the applicable fiscal years. |
Average Non-PEO NEOs Compensation Actually Paid Detail | |||||||||||||||||
Compensation Actually Paid Detail | |||||||||||||||||
Compensation Element | 2021 | 2022 | 2023 | 2024 | 2025 | ||||||||||||
Summary Compensation Table (SCT) Reported Total Compensation | $459,305 | $478,669 | $1,145,422 | $571,616 | $598,309 | ||||||||||||
Aggregate SCT Reported Equity Compensation (-) | $0 | $0 | ($593,152) | ($13,680) | $0 | ||||||||||||
Year-End Fair Value of Awards Granted During the FY & Outstanding (+) | $0 | $0 | $255,000 | $0 | $0 | ||||||||||||
Year-Over-Year Change in Fair Value of Awards Granted During Previous FYs & Outstanding (+/-) | ($54,935) | ($12,962) | $1,063 | $182,226 | $116,914 | ||||||||||||
Vesting Date Fair Value of Awards Granted & Vested During the Covered FY (+) | $0 | $0 | $0 | $13,680 | $0 | ||||||||||||
Year-Over-Year Change in Fair Value of Awards Granted During Previous FYs & Vested During Covered FY (+/-) | ($59,086) | $1,059 | $6,755 | $15,975 | ($1,533) | ||||||||||||
Prior FYE Value of Awards Determined to Fail to Meet Vesting Conditions During Covered FY (-) | $0 | $0 | $0 | $0 | $0 | ||||||||||||
Aggregate Change in the Actuarial Present Value of the Accumulated Benefits under Actuarial Pension Plans Reported in the SCT (-) | ($25,053) | ($100,835) | ($142,140) | ($69,386) | ($85,087) | ||||||||||||
Average Non-PEO NEOs Compensation Actually Paid Detail | |||||||||||||||||
Compensation Actually Paid Detail | |||||||||||||||||
Compensation Element | 2021 | 2022 | 2023 | 2024 | 2025 | ||||||||||||
Actuarially Determined Service Costs for Services Rendered During the Fiscal Year (+) | $22,974 | $27,382 | $33,415 | $37,808 | $37,543 | ||||||||||||
Cost/Credit of Benefits Granted During the Covered FY Attributed to Services Rendered in Periods Prior to an Amendment/Initiation (+) | $0 | $71,360 | $85,626 | $0 | $0 | ||||||||||||
Compensation Actually Paid Determination | $343,204 | $464,672 | $791,988 | $738,240 | $666,147 | ||||||||||||
(4) | Cumulative total shareholder return (TSR) calculated based on an assumed $100 investment as of December 31, 2020. Peer Group TSR reflects the TSR of the S&P Small Cap 600 IT (total return). |
(5) | In 2025, the Company used annual Company EBITDA as a financial performance metric associated with annual bonus amounts; therefore, annual Company EBITDA is the Company-selected measure. Note, for fiscal years 2021 - 2024, compensation was pursuant to contractual obligations and no financial measures were used to link compensation to the Company’s performance. See “Financial Performance Measures” below. |
(1) | Our PEO for 2020 through 2025 was James V. Continenza. The individuals comprising our non-PEO NEOs for each year were as follows: |
2021 | 2022 | 2023 | 2024 | 2025 | ||||||||||
David E. Bullwinkle | David E. Bullwinkle | David E. Bullwinkle | David E. Bullwinkle | David E. Bullwinkle | ||||||||||
John O’Grady | Terry R. Taber | Terry R. Taber | Terry R. Taber | Terry R. Taber | ||||||||||
Randy D. Vandagriff | Roger W. Byrd | Roger W. Byrd | Roger W. Byrd | |||||||||||
Roger W. Byrd | Richard T. Michaels | Richard T. Michaels | Richard T. Michaels | |||||||||||
John O’Grady | ||||||||||||||
(4) | Cumulative total shareholder return (TSR) calculated based on an assumed $100 investment as of December 31, 2020. Peer Group TSR reflects the TSR of the S&P Small Cap 600 IT (total return). |
(2) | The dollar amounts reported in this column represent the amount of “compensation actually paid” to the PEO in 2025, 2024, 2023, 2022, and 2021, as computed in accordance with Item 402(v) of Regulation S-K. Equity compensation fair value was calculated based on assumptions determined in accordance with FASB ASC Topic 718. The dollar amounts do not necessarily reflect the actual amount of compensation earned by or paid to the PEO during the applicable fiscal years. |
PEO Compensation Actually Paid Detail | |||||||||||||||||
Compensation Actually Paid Detail | |||||||||||||||||
Compensation Element | 2021 | 2022 | 2023 | 2024 | 2025 | ||||||||||||
Summary Compensation Table (SCT) Reported Total Compensation | $6,042,091 | $2,703,120 | $7,064,526 | $6,232,547 | $6,824,970 | ||||||||||||
Aggregate SCT Reported Equity Compensation (-) | ($5,000,000) | ($1,428,000) | ($3,760,150) | ($3,904,340) | ($2,500,004) | ||||||||||||
Year-End Fair Value of Awards Granted During the FY & Outstanding (+) | $1,404,000 | $915,000 | $3,467,123 | $3,548,201 | $2,807,451 | ||||||||||||
Year-Over-Year Change in Fair Value of Awards Granted During Previous FYs & Outstanding (+/-) | $0 | ($326,000) | $255,000 | $1,849,432 | $1,240,553 | ||||||||||||
PEO Compensation Actually Paid Detail | |||||||||||||||||
Compensation Actually Paid Detail | |||||||||||||||||
Compensation Element | 2021 | 2022 | 2023 | 2024 | 2025 | ||||||||||||
Vesting Date Fair Value of Awards Granted & Vested During the Covered FY (+) | $1,724,000 | $0 | $0 | $974,191 | $0 | ||||||||||||
Year-Over-Year Change in Fair Value of Awards Granted During Previous FYs & Vested During Covered FY (+/-) | $0 | $8,000 | $94,000 | $537,722 | $492,965 | ||||||||||||
Prior FYE Value of Awards Determined to Fail to Meet Vesting Conditions During Covered FY (-) | $0 | $0 | $0 | $0 | $0 | ||||||||||||
Aggregate Change in the Actuarial Present Value of the Accumulated Benefits under Actuarial Pension Plans Reported in the SCT (-) | ($26,324) | ($278,604) | ($307,860) | ($81,691) | ($78,450) | ||||||||||||
Actuarially Determined Service Costs for Services Rendered During the Fiscal Year (+) | $23,429 | $33,524 | $36,928 | $40,128 | $41,080 | ||||||||||||
Cost/Credit of Benefits Granted During the Covered FY Attributed to Services Rendered in Periods Prior to an Amendment/Initiation (+) | $0 | $235,736 | $258,876 | $0 | $0 | ||||||||||||
Compensation Actually Paid Determination | $4,167,196 | $1,862,776 | $7,108,443 | $9,196,190 | $8,828,564 | ||||||||||||
(3) | The dollar amounts reported in this column represent the average amount of “compensation actually paid” to the non-PEO NEOs in 2025,2024, 2023, 2022, and 2021, as computed in accordance with Item 402(v) of Regulation S-K. Equity compensation fair value was calculated based on assumptions determined in accordance with FASB ASC Topic 718. The dollar amounts do not necessarily reflect the actual average amount of compensation earned by or paid to the non-PEO NEOs during the applicable fiscal years. |
Average Non-PEO NEOs Compensation Actually Paid Detail | |||||||||||||||||
Compensation Actually Paid Detail | |||||||||||||||||
Compensation Element | 2021 | 2022 | 2023 | 2024 | 2025 | ||||||||||||
Summary Compensation Table (SCT) Reported Total Compensation | $459,305 | $478,669 | $1,145,422 | $571,616 | $598,309 | ||||||||||||
Aggregate SCT Reported Equity Compensation (-) | $0 | $0 | ($593,152) | ($13,680) | $0 | ||||||||||||
Year-End Fair Value of Awards Granted During the FY & Outstanding (+) | $0 | $0 | $255,000 | $0 | $0 | ||||||||||||
Year-Over-Year Change in Fair Value of Awards Granted During Previous FYs & Outstanding (+/-) | ($54,935) | ($12,962) | $1,063 | $182,226 | $116,914 | ||||||||||||
Vesting Date Fair Value of Awards Granted & Vested During the Covered FY (+) | $0 | $0 | $0 | $13,680 | $0 | ||||||||||||
Year-Over-Year Change in Fair Value of Awards Granted During Previous FYs & Vested During Covered FY (+/-) | ($59,086) | $1,059 | $6,755 | $15,975 | ($1,533) | ||||||||||||
Prior FYE Value of Awards Determined to Fail to Meet Vesting Conditions During Covered FY (-) | $0 | $0 | $0 | $0 | $0 | ||||||||||||
Aggregate Change in the Actuarial Present Value of the Accumulated Benefits under Actuarial Pension Plans Reported in the SCT (-) | ($25,053) | ($100,835) | ($142,140) | ($69,386) | ($85,087) | ||||||||||||
Average Non-PEO NEOs Compensation Actually Paid Detail | |||||||||||||||||
Compensation Actually Paid Detail | |||||||||||||||||
Compensation Element | 2021 | 2022 | 2023 | 2024 | 2025 | ||||||||||||
Actuarially Determined Service Costs for Services Rendered During the Fiscal Year (+) | $22,974 | $27,382 | $33,415 | $37,808 | $37,543 | ||||||||||||
Cost/Credit of Benefits Granted During the Covered FY Attributed to Services Rendered in Periods Prior to an Amendment/Initiation (+) | $0 | $71,360 | $85,626 | $0 | $0 | ||||||||||||
Compensation Actually Paid Determination | $343,204 | $464,672 | $791,988 | $738,240 | $666,147 | ||||||||||||
Compensation Actually Paid versus TSR
Compensation Actually Paid versus Net Income
Compensation Actually Paid versus Total Company EBITDA
Compensation Actually Paid versus TSR
Financial Performance Measures(1)
Annual Company EBITDA
Annual AM&C Revenue
(1) | Our Compensation, Nominating and Governance Committee (the Committee) reviews a variety of Company-wide and individual factors, as well as peer practices, when considering compensation actions with respect to our executive officers. Any equity award issuances over the five most recently completed fiscal years have been made in the form of PSUs, RSUs or stock options with vesting dependent upon continued employment and the compensation value ultimately realized by our executive officers remains subject to significant variation over time (e.g., forfeiture of unvested awards prior to vesting, variation in stock price prior to award monetization). Prior to fiscal year 2025, all compensation issued by us during the four most recently completed fiscal years had been pursuant to contractual obligations. In 2025, we implemented the Management Bonus Plan for the Functional Group (MPF) and an individual bonus plan for Dr. Taber. Both plans used specific financial metrics – MPF used annual Company EBITDA and Dr. Taber’s used annual AM&C revenue. |