v3.26.1
Pay vs Performance Disclosure - USD ($)
12 Months Ended
Jan. 05, 2025
Dec. 31, 2025
Dec. 31, 2025
Dec. 31, 2024
Dec. 31, 2023
Pay vs Performance Disclosure          
Pay vs Performance Disclosure, Table    

Pay Versus Performance DISCLOSURE

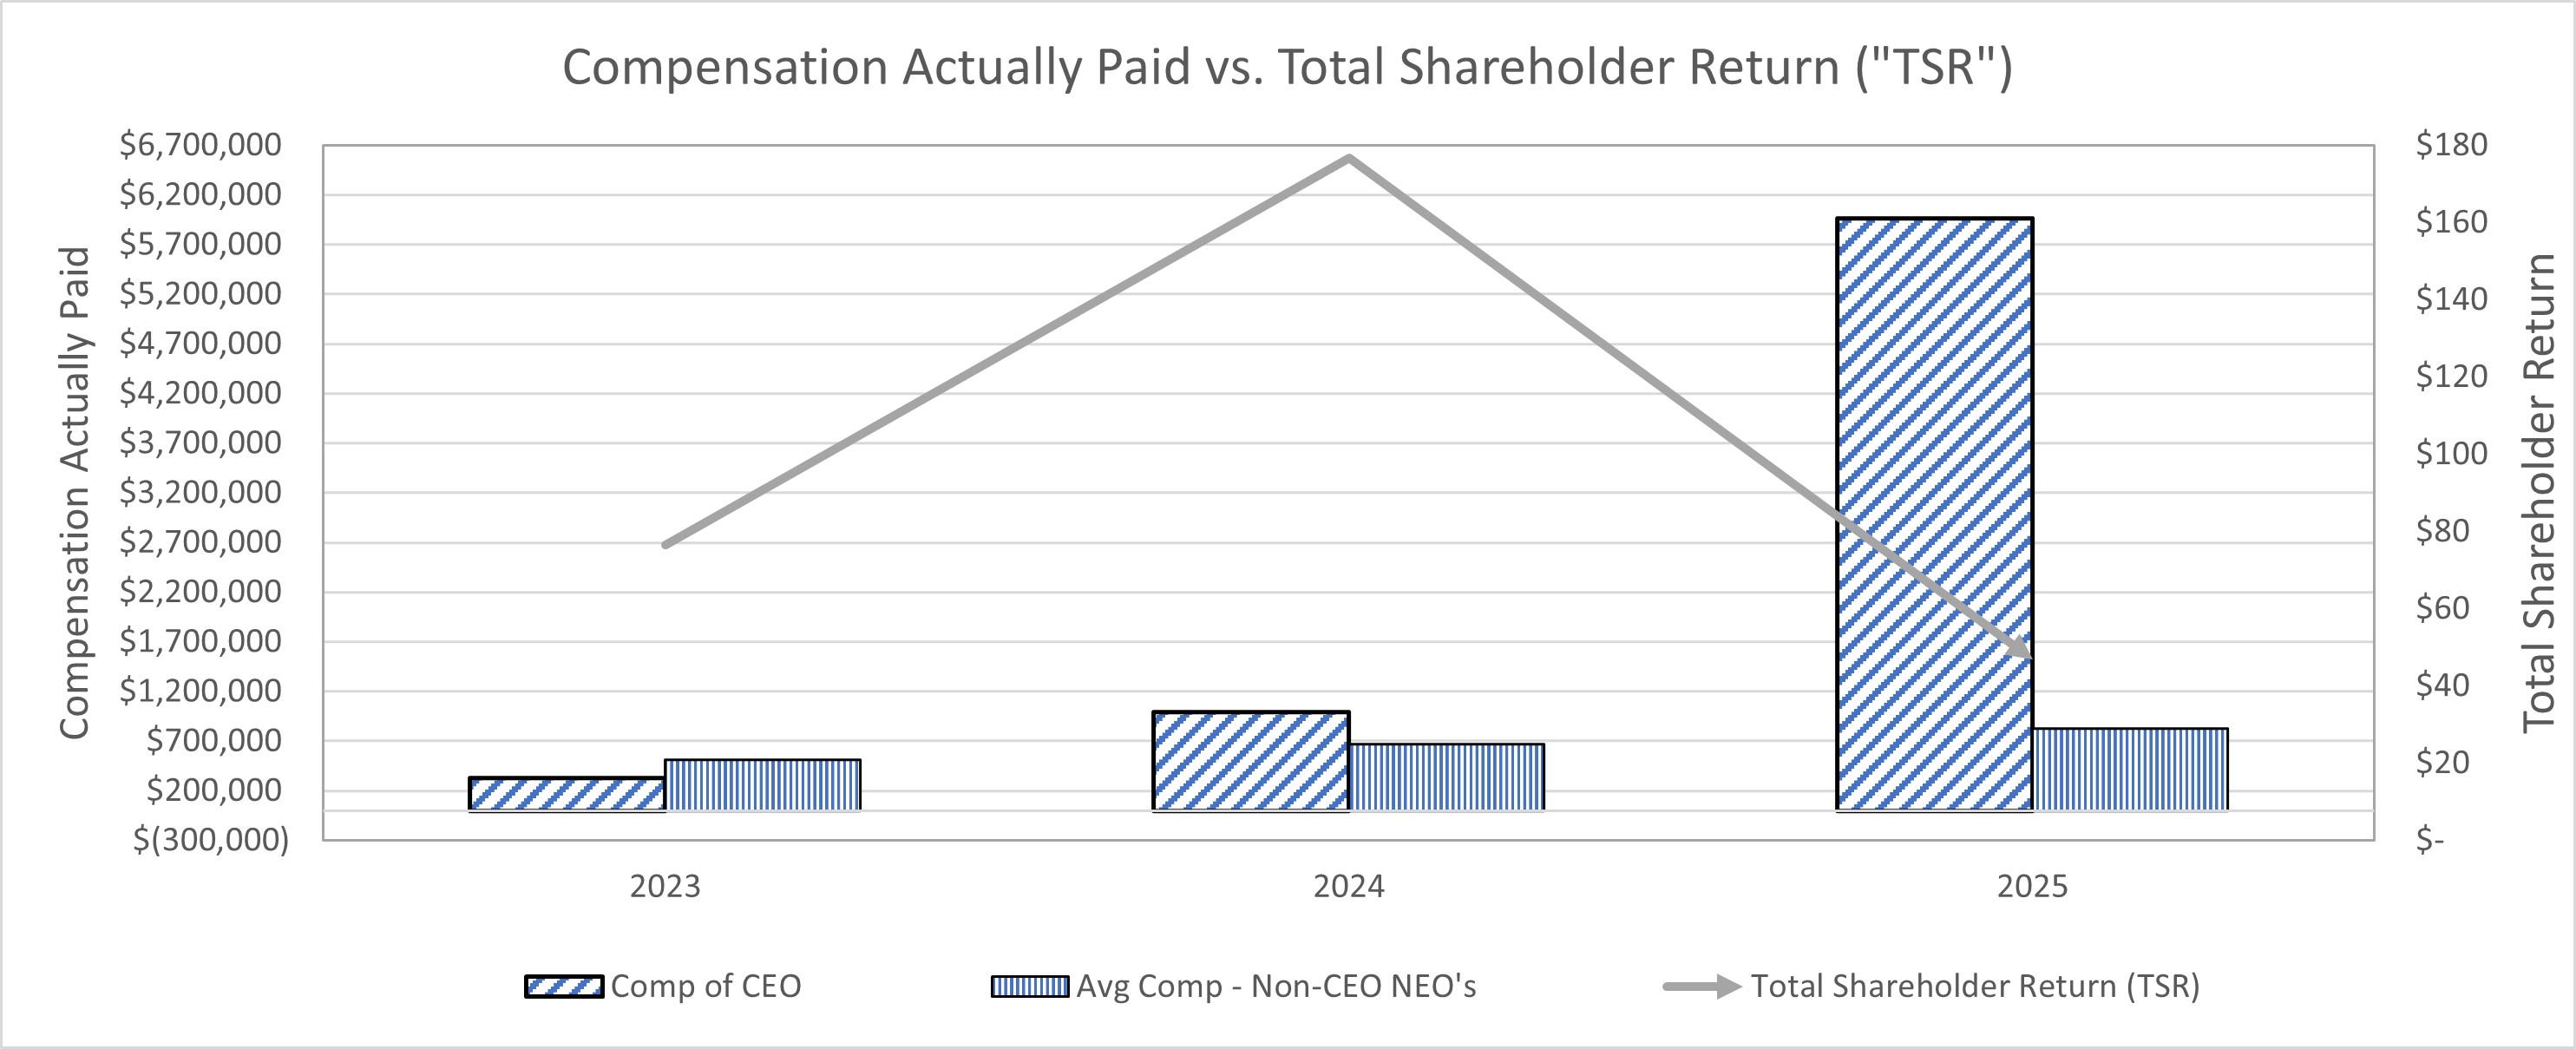
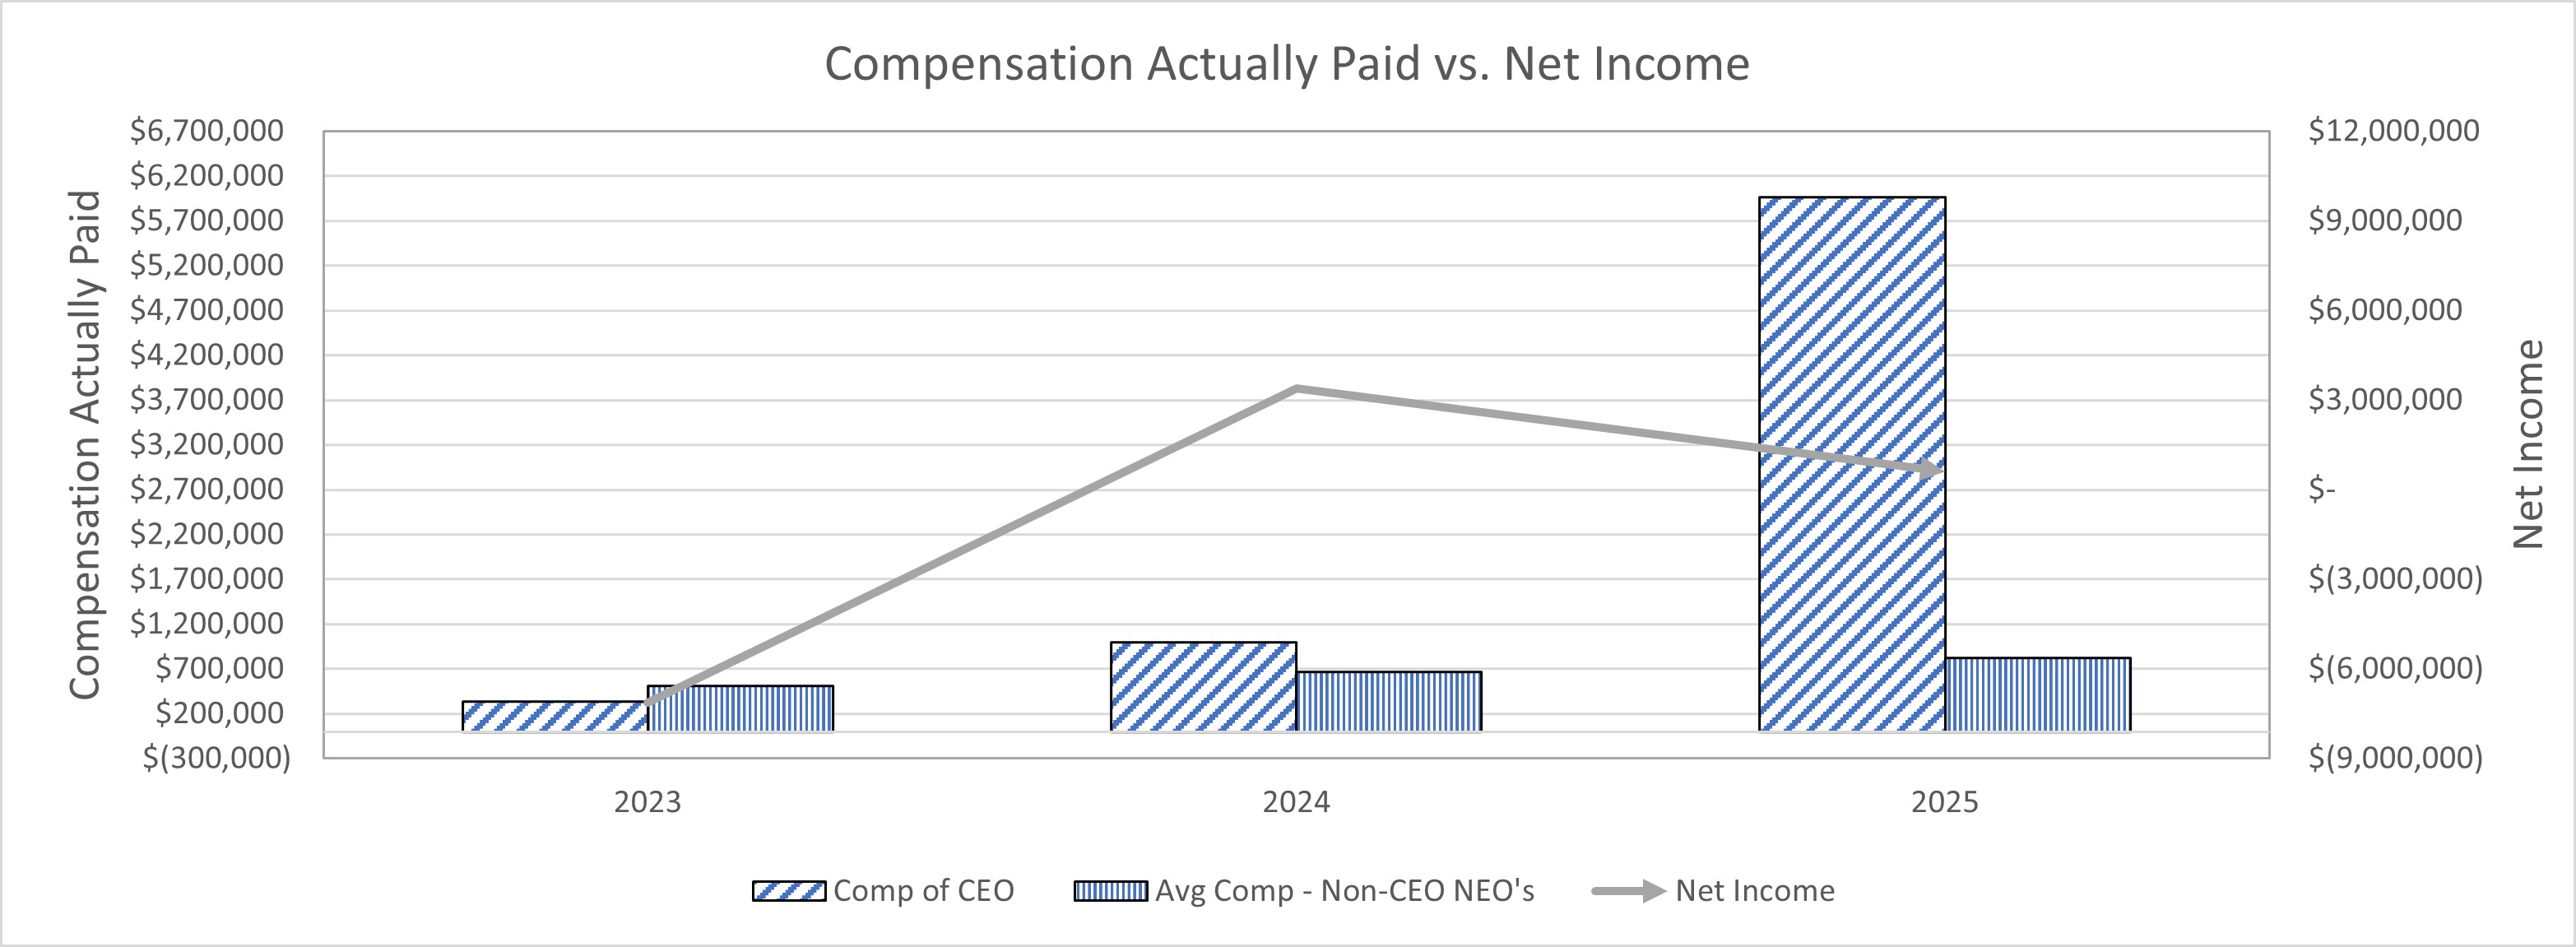
As required by Item 402(v) of Regulation S-K of the Exchange Act, we are providing the following information about the relationship between executive compensation actually paid and certain financial performance of the Company for each of the last three completed calendar years. In determining the “compensation actually paid” to the Company’s named executive officers (“NEOs”), we are required to make various adjustments to amounts that have been previously reported in the Summary Compensation Table in previous years, as the SEC’s valuation methods for this section differ from those required in the Summary Compensation Table. The table below summarizes compensation values both previously reported in our Summary Compensation Table, as well as the adjusted values required in this section for the 2025, 2024 and 2023 calendar years. Note that for the NEOs other than our Chief Executive Officer (the “CEO”), compensation is reported as an average.

The information disclosed below has been prepared in accordance with Item 402(v) of Regulation S-K of the Exchange Act and does not necessarily reflect value actually realized by the NEOs or how the Company’s Compensation Committee makes regarding the compensation of the Company’s NEOs. For further information concerning the Company’s philosophy and objectives regarding the compensation of the NEOs, see the section captioned “Compensation Discussion and Analysis” on page 20.

The following table sets forth information concerning the compensation of the NEOs for each of the fiscal years ended December 31, 2025, 2024 and 2023 and the Company’s financial performance for each such fiscal year:


Year (1)


Summary
Compensation
Table
Total for CEO (Gupta) (2)


Compensation
Actually Paid to
CEO (Gupta) (2) (4) (6)


Summary
Compensation
Table
Total for CEO (Patel) (3)


Compensation
Actually Paid to
CEO (Patel) (3) (4) (6)


Average Summary
Compensation
Table Total for
Non-CEO NEOs (5) (6)


Average
Compensation
Actually Paid to
Non-CEO
NEOs (4)


Value of Initial
Fixed $100
Investment
Based on Total
Shareholder
Return
(“TSR”) (7)


Net Income
(in thousands) (8)


2025


$

970,639


$

970,639


$

8,814,382


$

5,968,075


$

797,219


$

824,894


$

46.85


$

609


2024


$

992,791


$

995,191


$

716,076


$

669,676


$

176.75


$

3,402


2023


$

665,798


$

331,498


$

806,776


$

511,376


$

76.57


$

(7,138

)


(1)
The individuals serving as Principal Executive Officer for each fiscal year are as follows: In fiscal year 2025, Vivek Gupta served as the Company's President and Chief Executive Officer from January 1, 2025 until his resignation effective January 6, 2025, and Nirav Patel has served as the Company's President and Chief Executive Officer effective January 6, 2025 through December 31, 2025. In fiscal years 2024 and 2023, Vivek Gupta served as the Company's President and Chief Executive Officer for the full fiscal year. The non-CEO NEOs for each fiscal year are as follows: In fiscal year 2025, the non-CEO NEOs were Kannan Sugantharaman and John J. Cronin, Jr. Mr. Sugantharaman was appointed the Company's Chief Financial and Operations Officer effective April 14, 2025. Mr. Cronin resigned as the Company's Chief Financial Officer effective April 14, 2025. In fiscal year 2024, the non-CEO NEO was John J. Cronin, Jr. In fiscal year 2023, the non-CEO NEOs were John J. Cronin, Jr. and Michael Fleishman. Mr. Fleishman resigned from his employment with the Company on November 27, 2023.
(2)
The dollar amounts reported in this column are the amounts of total compensation reported for Mr. Gupta for each corresponding year in the “Total Compensation” column of the Summary Compensation Table.
(3)
The dollar amounts reported in this column are the amounts of total compensation reported for Mr. Patel for each corresponding year in the “Total Compensation” column of the Summary Compensation Table.
(4)
The dollar amounts reported as “Compensation Actually Paid” have been computed in accordance with Item 402(v) of Regulation S-K. These amounts reflect “Total Compensation” as set forth in the Summary Compensation Table for each year, adjusted as described in footnote 5 below.
(5)
The dollar amounts reported in this column represent the average of the amounts reported for the Company’s NEOs as a group (excluding Mr. Patel and Mr. Gupta) in the “Total Compensation” column of the Summary Compensation Table in each applicable year.
(6)
“Compensation Actually Paid” reflects the exclusions and inclusions for the CEO and the Non-CEO NEOs set forth below. Amounts excluded, which are set forth in the “Minus Option Awards from Summary Compensation Table” columns below, represent the Option Awards reported in the Option Awards column of the Summary Compensation Table for each applicable year. Amounts added back to determine “Compensation Actually Paid” are made up of the following components which are set forth in the table below, as applicable: (i) the year-end fair value of any equity awards granted in the applicable year that are outstanding and unvested as of the end of the year; (ii) the amount of change as of the end of the applicable year (from the end of the prior fiscal year) in fair value of any awards granted in prior years that are outstanding and unvested as of the end of the applicable year; (iii) for awards that are granted and vest in same applicable year, the fair value as of the vesting date; (iv) for
awards granted in prior years that vest in the applicable year, the amount equal to the change as of the vesting date (from the end of the prior fiscal year) in fair value; (v) for awards granted in prior years that are determined to fail to meet the applicable vesting conditions during the applicable year, a deduction for the amount equal to the fair value at the end of the prior fiscal year; and (vi) the dollar value of any dividends or other earnings paid on stock or option awards in the applicable year prior to the vesting date that are not otherwise reflected in the fair value of such award or included in any other component of total compensation for the applicable year.
(7)
Cumulative TSR is calculated by dividing the sum of the cumulative amount of dividends for the measurement period, assuming dividend reinvestment, and the difference between the Company’s share price at the end and the beginning of the measurement period by the Company’s share price at the beginning of the measurement period. No dividends were paid on stock or option awards in 2025, 2024 and 2023.
(8)
The dollar amounts reported represent the amount of net income reflected in the Company’s consolidated audited financial statements for the applicable year.


(Gupta)


Year


Summary
Compensation
Table Total
for CEO (Gupta)


Minus Option
Awards from
Summary
Compensation
Table


Plus Year-End
Fair Value of
Outstanding
and Unvested
Equity Awards
Granted in the
Year


Plus Year over
Year Change
in Fair Value
of Outstanding
and Unvested
Equity Awards
Granted in
Prior Years


Plus Fair Value
as of Vesting
Date of Equity
Awards
Granted and
Vested in
the Year


Plus Year over
Year Change
in Fair Value
of Equity
Awards
Granted in
Prior Years
 that Vested
in the Year


Minus Fair
Value at the
End of the
Prior Year of
Equity
Awards that
Failed to Meet
Vesting
Conditions in
the Year


Plus Value of
Dividends or
other Earnings
Paid on Stock
or Option
Awards not
Otherwise
Reflected in
Fair Value or
Total
Compensation


Compensation
Actually Paid
to CEO (Gupta)


2025


$

970,639


$


$


$

970,639


2024


$

992,791


$

60,000


$

(57,600

)


$

995,191


2023


$

665,798


$

(51,600

)


$

(282,700

)


$

331,498


(Patel)


Year


Summary
Compensation
Table Total
for CEO (Patel)


Minus Option
Awards from
Summary
Compensation
Table


Plus Year-End
Fair Value of
Outstanding
and Unvested
Equity Awards
Granted in the
Year


Plus Year over
Year Change
in Fair Value
of Outstanding
and Unvested
Equity Awards
Granted in
Prior Years


Plus Fair Value
as of Vesting
Date of Equity
Awards
Granted and
Vested in
the Year


Plus Year over
Year Change
in Fair Value
of Equity
Awards
Granted in
Prior Years
 that Vested
in the Year


Minus Fair
Value at the
End of the
Prior Year of
Equity
Awards that
Failed to Meet
Vesting
Conditions in
the Year


Plus Value of
Dividends or
other Earnings
Paid on Stock
or Option
Awards not
Otherwise
Reflected in
Fair Value or
Total
Compensation


Compensation
Actually Paid
to CEO (Patel)


2025


$

8,814,382


(5,197,450

)


2,351,143


$


$


$

5,968,075


2024


$


$


$


$


2023


$


$


$


$


Year


Average
Summary
Compensation
Table Total
for Non-CEO
NEOs


Minus
Average
Option
Awards from
Summary
Compensation
Table


Plus Average
Year-End Fair
Value of
Outstanding
and Unvested
Equity Awards
Granted in
the Year


Plus Average
Year over
Year Change
in Fair Value
of Outstanding
and Unvested
Equity
Awards
Granted in
Prior Years


Plus Average
Fair Value as
of Vesting Date
of Equity
Awards
Granted and
Vested in
the Year


Plus Average
Year over
Year Change
in Fair Value
of Equity
Awards
Granted in
Prior Years
that Vested
in the Year


Minus Average
Fair Value at
the End of the
Prior Year of
Equity Awards
that Failed to
Meet Vesting
Conditions in
the Year


Plus Average
Value of
Dividends or
other Earnings
Paid on Stock
or Option
Awards not
Otherwise
Reflected in
Fair Value or
Total
Compensation


Average
Compensation
Actually Paid
to Non-CEO
NEOs


2025


$

797,219


(584,700

)


612,375


$


$


$

824,894


2024


$

716,076


$

40,000


$

(86,400

)


$

669,676


2023


$

806,776


$

(38,700

)


$

(256,700

)


$

511,376


Company Selected Measure Name     Net Income    
Named Executive Officers, Footnote     The non-CEO NEOs for each fiscal year are as follows: In fiscal year 2025, the non-CEO NEOs were Kannan Sugantharaman and John J. Cronin, Jr. Mr. Sugantharaman was appointed the Company's Chief Financial and Operations Officer effective April 14, 2025. Mr. Cronin resigned as the Company's Chief Financial Officer effective April 14, 2025. In fiscal year 2024, the non-CEO NEO was John J. Cronin, Jr. In fiscal year 2023, the non-CEO NEOs were John J. Cronin, Jr. and Michael Fleishman. Mr. Fleishman resigned from his employment with the Company on November 27, 2023.    
Adjustment To PEO Compensation, Footnote    

(Gupta)


Year


Summary
Compensation
Table Total
for CEO (Gupta)


Minus Option
Awards from
Summary
Compensation
Table


Plus Year-End
Fair Value of
Outstanding
and Unvested
Equity Awards
Granted in the
Year


Plus Year over
Year Change
in Fair Value
of Outstanding
and Unvested
Equity Awards
Granted in
Prior Years


Plus Fair Value
as of Vesting
Date of Equity
Awards
Granted and
Vested in
the Year


Plus Year over
Year Change
in Fair Value
of Equity
Awards
Granted in
Prior Years
 that Vested
in the Year


Minus Fair
Value at the
End of the
Prior Year of
Equity
Awards that
Failed to Meet
Vesting
Conditions in
the Year


Plus Value of
Dividends or
other Earnings
Paid on Stock
or Option
Awards not
Otherwise
Reflected in
Fair Value or
Total
Compensation


Compensation
Actually Paid
to CEO (Gupta)


2025


$

970,639


$


$


$

970,639


2024


$

992,791


$

60,000


$

(57,600

)


$

995,191


2023


$

665,798


$

(51,600

)


$

(282,700

)


$

331,498


(Patel)


Year


Summary
Compensation
Table Total
for CEO (Patel)


Minus Option
Awards from
Summary
Compensation
Table


Plus Year-End
Fair Value of
Outstanding
and Unvested
Equity Awards
Granted in the
Year


Plus Year over
Year Change
in Fair Value
of Outstanding
and Unvested
Equity Awards
Granted in
Prior Years


Plus Fair Value
as of Vesting
Date of Equity
Awards
Granted and
Vested in
the Year


Plus Year over
Year Change
in Fair Value
of Equity
Awards
Granted in
Prior Years
 that Vested
in the Year


Minus Fair
Value at the
End of the
Prior Year of
Equity
Awards that
Failed to Meet
Vesting
Conditions in
the Year


Plus Value of
Dividends or
other Earnings
Paid on Stock
or Option
Awards not
Otherwise
Reflected in
Fair Value or
Total
Compensation


Compensation
Actually Paid
to CEO (Patel)


2025


$

8,814,382


(5,197,450

)


2,351,143


$


$


$

5,968,075


2024


$


$


$


$


2023


$


$


$


$


Non-PEO NEO Average Total Compensation Amount     $ 797,219 $ 716,076 $ 806,776
Non-PEO NEO Average Compensation Actually Paid Amount     $ 824,894 669,676 511,376
Adjustment to Non-PEO NEO Compensation Footnote    

Year


Average
Summary
Compensation
Table Total
for Non-CEO
NEOs


Minus
Average
Option
Awards from
Summary
Compensation
Table


Plus Average
Year-End Fair
Value of
Outstanding
and Unvested
Equity Awards
Granted in
the Year


Plus Average
Year over
Year Change
in Fair Value
of Outstanding
and Unvested
Equity
Awards
Granted in
Prior Years


Plus Average
Fair Value as
of Vesting Date
of Equity
Awards
Granted and
Vested in
the Year


Plus Average
Year over
Year Change
in Fair Value
of Equity
Awards
Granted in
Prior Years
that Vested
in the Year


Minus Average
Fair Value at
the End of the
Prior Year of
Equity Awards
that Failed to
Meet Vesting
Conditions in
the Year


Plus Average
Value of
Dividends or
other Earnings
Paid on Stock
or Option
Awards not
Otherwise
Reflected in
Fair Value or
Total
Compensation


Average
Compensation
Actually Paid
to Non-CEO
NEOs


2025


$

797,219


(584,700

)


612,375


$


$


$

824,894


2024


$

716,076


$

40,000


$

(86,400

)


$

669,676


2023


$

806,776


$

(38,700

)


$

(256,700

)


$

511,376


Compensation Actually Paid vs. Total Shareholder Return    

img31116578_2.jpg

   
Compensation Actually Paid vs. Net Income    

img31116578_3.jpg

   
Total Shareholder Return Amount     $ 46.85 176.75 76.57
Net Income (Loss)     609 $ 3,402 $ (7,138)
PEO Name Vivek Gupta Nirav Patel   Vivek Gupta Vivek Gupta
Vivek Gupta [Member]          
Pay vs Performance Disclosure          
PEO Total Compensation Amount     970,639 $ 992,791 $ 665,798
PEO Actually Paid Compensation Amount     970,639 995,191 331,498
Vivek Gupta [Member] | Year-over-Year Change in Fair Value of Equity Awards Granted in Prior Years That are Outstanding and Unvested          
Pay vs Performance Disclosure          
Adjustment to Compensation, Amount       60,000 (51,600)
Vivek Gupta [Member] | Change in Fair Value as of Vesting Date of Prior Year Equity Awards Vested in Covered Year          
Pay vs Performance Disclosure          
Adjustment to Compensation, Amount       (57,600) (282,700)
Nirav Patel [Member]          
Pay vs Performance Disclosure          
PEO Total Compensation Amount     8,814,382    
PEO Actually Paid Compensation Amount     5,968,075    
Nirav Patel [Member] | Aggregate Grant Date Fair Value of Equity Award Amounts Reported in Summary Compensation Table          
Pay vs Performance Disclosure          
Adjustment to Compensation, Amount     (5,197,450)    
Nirav Patel [Member] | Year-end Fair Value of Equity Awards Granted in Covered Year that are Outstanding and Unvested          
Pay vs Performance Disclosure          
Adjustment to Compensation, Amount     2,351,143    
Non-PEO NEO | Aggregate Grant Date Fair Value of Equity Award Amounts Reported in Summary Compensation Table          
Pay vs Performance Disclosure          
Adjustment to Compensation, Amount     (584,700)    
Non-PEO NEO | Year-end Fair Value of Equity Awards Granted in Covered Year that are Outstanding and Unvested          
Pay vs Performance Disclosure          
Adjustment to Compensation, Amount     $ 612,375    
Non-PEO NEO | Year-over-Year Change in Fair Value of Equity Awards Granted in Prior Years That are Outstanding and Unvested          
Pay vs Performance Disclosure          
Adjustment to Compensation, Amount       40,000 (38,700)
Non-PEO NEO | Change in Fair Value as of Vesting Date of Prior Year Equity Awards Vested in Covered Year          
Pay vs Performance Disclosure          
Adjustment to Compensation, Amount       $ (86,400) $ (256,700)