Pay vs Performance Disclosure - USD ($)
|
6 Months Ended |
12 Months Ended |
Dec. 31, 2023 |
Jun. 16, 2023 |
Dec. 31, 2024 |
Dec. 31, 2023 |
Dec. 31, 2022 |
| Pay vs Performance Disclosure |
|
|
|
|
|
| Pay vs Performance Disclosure, Table |
|
|
| | | | | | | | | | | | | | | | | | | | | | | | | | | | | | | | | | | | | | | | Year | | Summary Compensation table total for PEO(1)(2) | | Compensation actually paid to PEO(1)(4) | | Average Summary Compensation Table total for Non-PEO Named Executive Officers(2)(3) | | Average compensation actually paid to Non-PEO Named Executive Officers(4) | | Value of initial fixed $100 investment based on Total stockholder return(5) | | Net loss (thousands)(6) | | 2025 | | $ | 1,031,938 | | | $ | (27,627) | | | $ | 452,850 | | | $ | 241,139 | | | $ | 25.32 | | | $ | (811) | | | 2024 | | $ | 706,950 | | | $ | 420,093 | | | $ | 611,153 | | | $ | 512,651 | | | $ | 43.31 | | | $ | (30,298) | | | 2023 | | $ | 2,382,143 | | | $ | 1,259,121 | | | $ | 421,580 | | | $ | 108,158 | | | $ | 57.11 | | | $ | (1,570) | |
|
|
|
| Named Executive Officers, Footnote |
|
|
During 2023, Mr. Brian Linscott served as PEO until June 16, 2023. Kirk Davis succeeded Brian Linscott as PEO on June 19, 2023. During 2024, Mr. Davis was our only PEO. During 2025, Mr. Davis served as PEO through January 26, 2025. David Fisher served as PEO for the remainder of 2025; he succeeded Mr. Davis as Interim Chief Operating Officer effective as of January 27, 2025, and was appointed as President effective as of June 2 2025Our Non-PEO NEOs for 2025 and 2024 are David Garrison and Robert Wyman. Our Non-PEO NEOs for 2023 are Laurilee Kearnes, Robert Wyman and David Garrison.
|
|
|
| PEO Total Compensation Amount |
|
|
$ 1,031,938
|
$ 706,950
|
$ 2,382,143
|
| PEO Actually Paid Compensation Amount |
|
|
$ (27,627)
|
420,093
|
1,259,121
|
| Adjustment To PEO Compensation, Footnote |
|
|
| | | | | | | | | | | | | | | | | | | | | | | | | | | | | | | | | | | | | | | | | 2025 | | 2024 | | 2023 | | | PEO | | Average Non-PEO NEOs | | PEO | | Average Non-PEO NEOs | | PEO | | Average Non-PEO NEOs | | Total Compensation from SCT | | $ | 1,031,938 | | | $ | 452,850 | | | $ | 706,950 | | | $ | 611,153 | | | $ | 2,382,143 | | | $ | 421,580 | | | Adjustment for stock awards | | | | | | | | | | | | | | (Minus) SCT amounts for stock awards | | (573,305) | | | (113,750) | | | — | | | (263,267) | | | (908,964) | | | — | | | Addition: Fair value at year end of awards granted during the covered fiscal year that are outstanding and unvested at year end | | 359,512 | | | 37,625 | | | — | | | 169,011 | | | 1,077,056 | | | — | | | Addition: Year over Year change in Fair Value as of the Last day of the covered year of outstanding and unvested equity awards granted in prior years | | (37,050) | | | (37,049) | | | (191,238) | | | (9,446) | | | (49,000) | | | (90,900) | | | Addition: Vesting date fair value of equity awards granted and vested in the covered year | | — | | | — | | | — | | | — | | | — | | | — | | | Addition: Change in Fair value as of the vesting date of equity awards granted in prior years that vested during the covered year (measured from the end of the prior fiscal year). | | (18,523) | | | (19,286) | | | (95,619) | | | 5,200 | | | (288,354) | | | (144,002) | | | (Minus): Fair value at the end of the prior year of equity awards that failed to meet vesting conditions in the covered year | | (790,199) | | | (79,251) | | | — | | | — | | | (953,760) | | | (78,520) | | | Compensation actually paid | | $ | (27,627) | | | $ | 241,139 | | | $ | 420,093 | | | $ | 512,651 | | | $ | 1,259,121 | | | $ | 108,158 | |
|
|
|
| Non-PEO NEO Average Total Compensation Amount |
|
|
$ 452,850
|
611,153
|
421,580
|
| Non-PEO NEO Average Compensation Actually Paid Amount |
|
|
$ 241,139
|
512,651
|
108,158
|
| Adjustment to Non-PEO NEO Compensation Footnote |
|
|
| | | | | | | | | | | | | | | | | | | | | | | | | | | | | | | | | | | | | | | | | 2025 | | 2024 | | 2023 | | | PEO | | Average Non-PEO NEOs | | PEO | | Average Non-PEO NEOs | | PEO | | Average Non-PEO NEOs | | Total Compensation from SCT | | $ | 1,031,938 | | | $ | 452,850 | | | $ | 706,950 | | | $ | 611,153 | | | $ | 2,382,143 | | | $ | 421,580 | | | Adjustment for stock awards | | | | | | | | | | | | | | (Minus) SCT amounts for stock awards | | (573,305) | | | (113,750) | | | — | | | (263,267) | | | (908,964) | | | — | | | Addition: Fair value at year end of awards granted during the covered fiscal year that are outstanding and unvested at year end | | 359,512 | | | 37,625 | | | — | | | 169,011 | | | 1,077,056 | | | — | | | Addition: Year over Year change in Fair Value as of the Last day of the covered year of outstanding and unvested equity awards granted in prior years | | (37,050) | | | (37,049) | | | (191,238) | | | (9,446) | | | (49,000) | | | (90,900) | | | Addition: Vesting date fair value of equity awards granted and vested in the covered year | | — | | | — | | | — | | | — | | | — | | | — | | | Addition: Change in Fair value as of the vesting date of equity awards granted in prior years that vested during the covered year (measured from the end of the prior fiscal year). | | (18,523) | | | (19,286) | | | (95,619) | | | 5,200 | | | (288,354) | | | (144,002) | | | (Minus): Fair value at the end of the prior year of equity awards that failed to meet vesting conditions in the covered year | | (790,199) | | | (79,251) | | | — | | | — | | | (953,760) | | | (78,520) | | | Compensation actually paid | | $ | (27,627) | | | $ | 241,139 | | | $ | 420,093 | | | $ | 512,651 | | | $ | 1,259,121 | | | $ | 108,158 | |
|
|
|
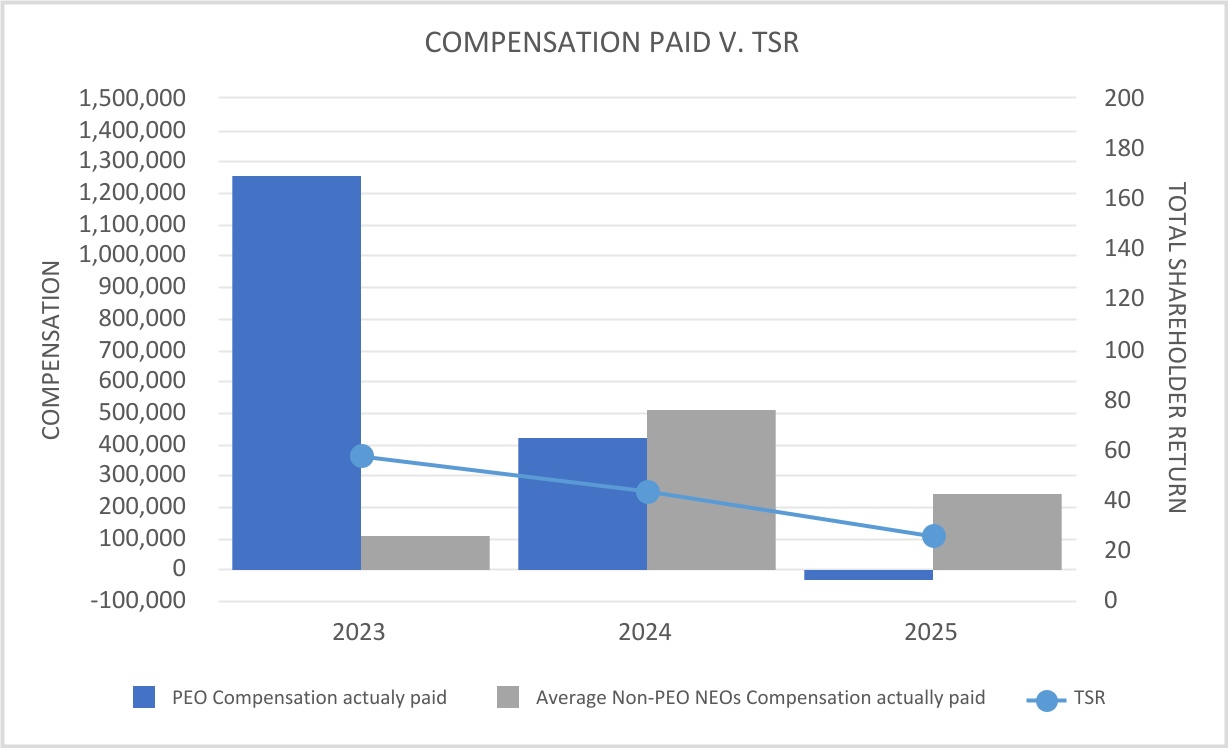
| Compensation Actually Paid vs. Total Shareholder Return |
|
|
The graphs below illustrate the relationship between CAP for the PEO and Non-PEO NEOs and our TSR.
|
|
|
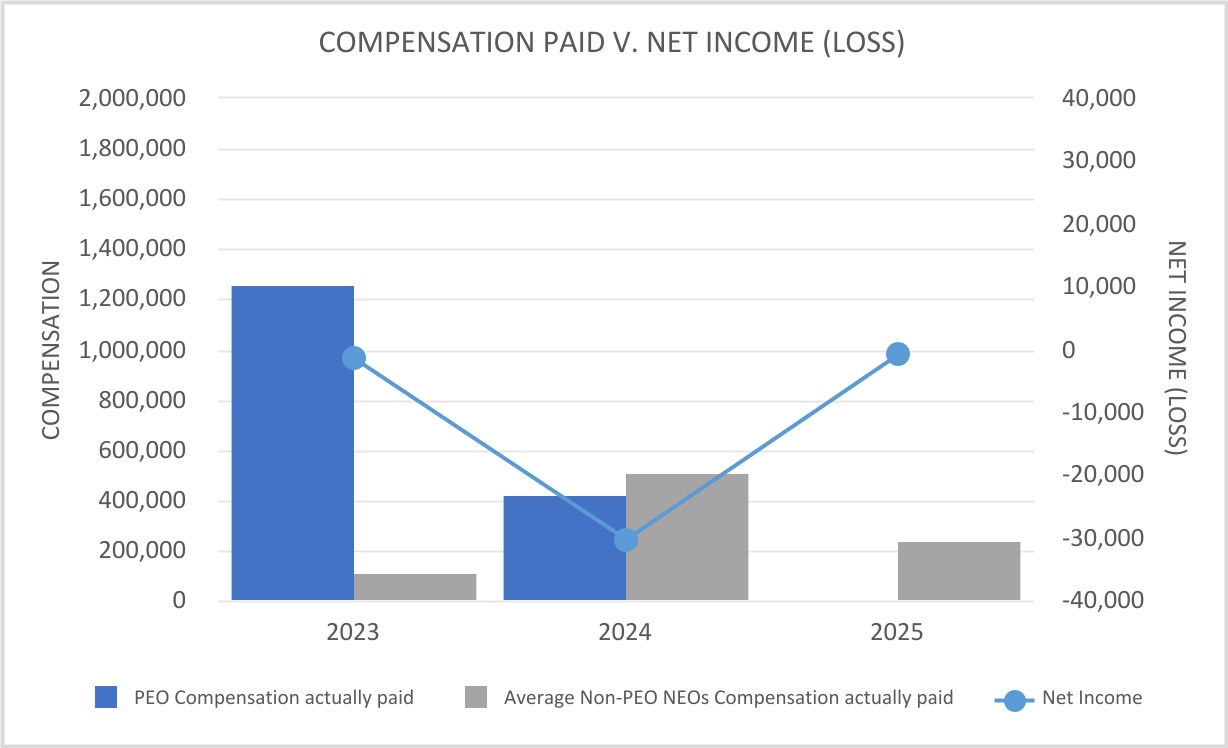
| Compensation Actually Paid vs. Net Income |
|
|
The graph below reflects the relationship between the PEO and Average Non-PEO NEOs CAP and our Net loss.
|
|
|
| Total Shareholder Return Amount |
|
|
$ 25.32
|
43.31
|
57.11
|
| Net Income (Loss) |
|
|
$ (811,000)
|
(30,298,000)
|
$ (1,570,000)
|
| PEO Name |
Kirk Davis
|
Mr. Brian Linscott
|
Kirk Davis
|
|
Mr. Brian Linscott
|
| Additional 402(v) Disclosure |
|
|
Amounts reported in these columns represent (i) the total compensation reported in the Summary Compensation Table (“SCT”) for the applicable year in the case of our PEOs, Messrs. Fisher, Davis and Linscott, and (ii) the average of the total compensation reported in the SCT for the applicable year for our Non-PEO NEOs reported for that applicable year. Amounts reported in these columns represent “compensation actually paid” as calculated in accordance with Item 402(v) of Regulation S-K. A reconciliation of the adjustments for our PEOs, Messrs. Fisher, Davis and Linscott, and for the average of the Non-PEO NEOs is set forth in the Reconciliation of SCT to CAP Table below, which describes the adjustments, each of which is prescribed by the SEC rules, to calculate the CAP Amounts from SCT amounts. Total Stockholder Return (TSR) is cumulative for the measurement periods beginning on December 31, 2022 and ending on December 31, of each of 2025, 2024 and 2023, respectively, calculated in accordance with Item 201(e)(1)(ii) of Regulation S-K.Amounts reported in this column represent “Net Income (loss)” for each applicable year as set forth in our Consolidated Statements of Comprehensive Income included in our Annual Report on Form 10-K for each of the applicable years.
|
|
|
| PEO | Aggregate Grant Date Fair Value of Equity Award Amounts Reported in Summary Compensation Table |
|
|
|
|
|
| Pay vs Performance Disclosure |
|
|
|
|
|
| Adjustment to Compensation, Amount |
|
|
$ (573,305)
|
0
|
$ (908,964)
|
| PEO | Year-end Fair Value of Equity Awards Granted in Covered Year that are Outstanding and Unvested |
|
|
|
|
|
| Pay vs Performance Disclosure |
|
|
|
|
|
| Adjustment to Compensation, Amount |
|
|
359,512
|
0
|
1,077,056
|
| PEO | Year-over-Year Change in Fair Value of Equity Awards Granted in Prior Years That are Outstanding and Unvested |
|
|
|
|
|
| Pay vs Performance Disclosure |
|
|
|
|
|
| Adjustment to Compensation, Amount |
|
|
(37,050)
|
(191,238)
|
(49,000)
|
| PEO | Vesting Date Fair Value of Equity Awards Granted and Vested in Covered Year |
|
|
|
|
|
| Pay vs Performance Disclosure |
|
|
|
|
|
| Adjustment to Compensation, Amount |
|
|
0
|
0
|
0
|
| PEO | Change in Fair Value as of Vesting Date of Prior Year Equity Awards Vested in Covered Year |
|
|
|
|
|
| Pay vs Performance Disclosure |
|
|
|
|
|
| Adjustment to Compensation, Amount |
|
|
(18,523)
|
(95,619)
|
(288,354)
|
| PEO | Prior Year End Fair Value of Equity Awards Granted in Any Prior Year that Fail to Meet Applicable Vesting Conditions During Covered Year |
|
|
|
|
|
| Pay vs Performance Disclosure |
|
|
|
|
|
| Adjustment to Compensation, Amount |
|
|
(790,199)
|
0
|
(953,760)
|
| Non-PEO NEO | Aggregate Grant Date Fair Value of Equity Award Amounts Reported in Summary Compensation Table |
|
|
|
|
|
| Pay vs Performance Disclosure |
|
|
|
|
|
| Adjustment to Compensation, Amount |
|
|
(113,750)
|
(263,267)
|
0
|
| Non-PEO NEO | Year-end Fair Value of Equity Awards Granted in Covered Year that are Outstanding and Unvested |
|
|
|
|
|
| Pay vs Performance Disclosure |
|
|
|
|
|
| Adjustment to Compensation, Amount |
|
|
37,625
|
169,011
|
0
|
| Non-PEO NEO | Year-over-Year Change in Fair Value of Equity Awards Granted in Prior Years That are Outstanding and Unvested |
|
|
|
|
|
| Pay vs Performance Disclosure |
|
|
|
|
|
| Adjustment to Compensation, Amount |
|
|
(37,049)
|
(9,446)
|
(90,900)
|
| Non-PEO NEO | Vesting Date Fair Value of Equity Awards Granted and Vested in Covered Year |
|
|
|
|
|
| Pay vs Performance Disclosure |
|
|
|
|
|
| Adjustment to Compensation, Amount |
|
|
0
|
0
|
0
|
| Non-PEO NEO | Change in Fair Value as of Vesting Date of Prior Year Equity Awards Vested in Covered Year |
|
|
|
|
|
| Pay vs Performance Disclosure |
|
|
|
|
|
| Adjustment to Compensation, Amount |
|
|
(19,286)
|
5,200
|
(144,002)
|
| Non-PEO NEO | Prior Year End Fair Value of Equity Awards Granted in Any Prior Year that Fail to Meet Applicable Vesting Conditions During Covered Year |
|
|
|
|
|
| Pay vs Performance Disclosure |
|
|
|
|
|
| Adjustment to Compensation, Amount |
|
|
$ (79,251)
|
$ 0
|
$ (78,520)
|