Pay vs Performance Disclosure - USD ($)
Dec. 31, 2025
Dec. 31, 2024
Dec. 31, 2023
Dec. 31, 2022
Dec. 31, 2021
Year | Summary Compensation Table Total for First PEO (1) | Summary Compensation Table Total For Second PEO (2) | Compensation Actually Paid To First PEO (1)(6) | Compensation Actually Paid To Second PEO (2)(6) | Average Summary Compensation Table Total For Non-PEO NEOs (3) | Average Compensation Actually Paid To Non-PEO NEOs (3)(6) | Value of Initial Fixed $100 Investment Based on: | Net Income (5) | Operating Income (5) | ||||||||||||||||||||||||||||||||||||||||||||||||||||||||
Total Shareholder Return | Peer Group Total Shareholder Return (4) | ||||||||||||||||||||||||||||||||||||||||||||||||||||||||||||||||
| 2025 | $ | 8,591,990 | $ | 8,719,199 | $ | 7,445,505 | $ | 1,135,482 | $ | 2,026,253 | $ | 1,377,656 | $ | 62 | $ | 129 | $ | 338,738 | $ | 386,635 | |||||||||||||||||||||||||||||||||||||||||||||
| 2024 | $ | 9,145,545 | N/A | $ | (3,139,105) | N/A | $ | 1,427,257 | $ | 421,572 | $ | 88 | $ | 137 | $ | 455,357 | $ | 416,627 | |||||||||||||||||||||||||||||||||||||||||||||||
| 2023 | $ | 11,953,280 | N/A | $ | (13,936,969) | N/A | $ | 1,297,088 | $ | (792,952) | $ | 105 | $ | 125 | $ | 706,586 | $ | 779,084 | |||||||||||||||||||||||||||||||||||||||||||||||
| 2022 | $ | 43,324,864 | N/A | $ | 43,851,203 | N/A | $ | 3,870,881 | $ | 3,932,610 | $ | 117 | $ | 101 | $ | 741,408 | $ | 909,278 | |||||||||||||||||||||||||||||||||||||||||||||||
| 2021 | $ | 18,105,568 | N/A | $ | 22,396,080 | N/A | $ | 1,835,603 | $ | 1,927,582 | $ | 104 | $ | 128 | $ | 650,024 | $ | 823,439 | |||||||||||||||||||||||||||||||||||||||||||||||
(2)Mr. Zeitz, the former PEO, was First PEO for years 2021 through 2024 and Second PEO for 2025
(3)Non-PEO NEOs: 2025 - Messrs. Root, Krishnan, Krause and Ryan, 2024 - Messrs. Root, Mansfield, Krishnan and Krause, 2023 - Messrs. Root, Viney, Krishnan and Krause and Mses. Goetter and O'Sullivan; 2022 - Messrs. Krishnan and Krause and Mses. Goetter and O'Sullivan; 2021 - Messrs. Niketh and Krishnan and Mses. Goetter and O'Sullivan
Year | Summary Compensation Table Total | Pension Deductions from Summary Compensation Table Total (i) | Equity Deductions from Summary Compensation Table Total (ii) | Pension Benefit Adjustments (iii) | Equity Award Adjustments (iv) | Compensation Actually Paid | |||||||||||||||||||||||||||||||||||
First PEO | 2025 | $ | 8,591,990 | $ | — | $ | (6,125,019) | $ | — | $ | 4,978,534 | $ | 7,445,505 | ||||||||||||||||||||||||||||
| 2024 | $ | 9,145,545 | $ | — | $ | (6,500,014) | $ | — | $ | (5,784,636) | $ | (3,139,105) | |||||||||||||||||||||||||||||
| 2023 | $ | 11,953,280 | $ | — | $ | (6,500,029) | $ | — | $ | (19,390,220) | $ | (13,936,969) | |||||||||||||||||||||||||||||
| 2022 | $ | 43,324,864 | $ | — | $ | (38,407,535) | $ | — | $ | 38,933,874 | $ | 43,851,203 | |||||||||||||||||||||||||||||
| 2021 | $ | 18,105,568 | $ | — | $ | (12,435,030) | $ | — | $ | 16,725,542 | $ | 22,396,080 | |||||||||||||||||||||||||||||
Second PEO | 2025 | $ | 8,719,199 | $ | — | $ | (6,610,699) | $ | — | $ | (973,018) | $ | 1,135,482 | ||||||||||||||||||||||||||||
Non-PEO NEOs | 2025 | $ | 2,026,253 | $ | — | $ | (1,203,996) | $ | — | $ | 555,399 | $ | 1,377,656 | ||||||||||||||||||||||||||||
| 2024 | $ | 1,427,257 | $ | — | $ | (852,216) | $ | — | $ | (153,469) | $ | 421,572 | |||||||||||||||||||||||||||||
| 2023 | $ | 1,297,088 | $ | — | $ | (596,910) | $ | — | $ | (1,493,130) | $ | (792,952) | |||||||||||||||||||||||||||||
| 2022 | $ | 3,870,881 | $ | — | $ | (2,914,845) | $ | — | $ | 2,976,574 | $ | 3,932,610 | |||||||||||||||||||||||||||||
| 2021 | $ | 1,835,603 | $ | (28,000) | $ | (417,538) | $ | 32,420 | $ | 505,097 | $ | 1,927,582 | |||||||||||||||||||||||||||||
(i)Reflects "Change in Pension Value" as reported in the SCT
(ii)Reflects "Stock Awards" and "Option Awards" as reported in the SCT
(iii)The total pension benefit adjustments for each applicable year include the actuarially determined service cost for services rendered during the applicable year
(iv)Reflects the value of equity calculated in accordance with the SEC methodology for determining CAP for each year shown. The equity award adjustments component of CAP is further detailed below.
Year | Year-End Fair Value of Equity Awards Granted During the Year | Year-Over-Year Change in Fair Value of Outstanding and Unvested Equity Awards | Fair Value as of Vesting Date of Equity Awards Granted and Vested in Year | Year-Over-Year Change in Fair Value of Equity Awards Granted in Prior Years that Vested in the Year | Fair Value at the End of the Prior Year of Equity Awards That Failed to Meet Vesting Conditions in the Year | Value of Dividends or Other Earnings Paid on Stock Awards Not Otherwise Reflected in the Fair Value or Total Compensation | Total equity Award Adjustments | ||||||||||||||||||||||||||||||||||||||||
First PEO | 2025 | $ | 4,935,180 | $ | — | $ | — | $ | — | $ | — | $ | 43,354 | $ | 4,978,534 | ||||||||||||||||||||||||||||||||
| 2024 | $ | 5,780,561 | $ | (11,453,788) | $ | — | $ | 453 | $ | — | $ | (111,862) | $ | (5,784,636) | |||||||||||||||||||||||||||||||||
| 2023 | $ | 5,007,440 | $ | (24,719,926) | $ | — | $ | (8,435) | $ | — | $ | 330,701 | $ | (19,390,220) | |||||||||||||||||||||||||||||||||
| 2022 | $ | 37,339,227 | $ | 1,785,000 | $ | — | $ | (379,887) | $ | — | $ | 189,534 | $ | 38,933,874 | |||||||||||||||||||||||||||||||||
| 2021 | $ | 13,805,685 | $ | — | $ | — | $ | 2,776,988 | $ | — | $ | 142,869 | $ | 16,725,542 | |||||||||||||||||||||||||||||||||
Second PEO | 2025 | $ | 3,287,426 | $ | (3,710,721) | $ | — | $ | (361,657) | $ | (420,000) | $ | 231,934 | $ | (973,018) | ||||||||||||||||||||||||||||||||
Non-PEO NEOs | 2025 | $ | 739,125 | $ | (151,485) | $ | — | $ | (30,869) | $ | (22,400) | $ | 21,028 | $ | 555,399 | ||||||||||||||||||||||||||||||||
| 2024 | $ | 508,520 | $ | (632,602) | $ | — | $ | (36,290) | $ | — | $ | 6,903 | $ | (153,469) | |||||||||||||||||||||||||||||||||
| 2023 | $ | 303,684 | $ | (1,233,360) | $ | — | $ | 22,716 | $ | (589,003) | $ | 2,833 | $ | (1,493,130) | |||||||||||||||||||||||||||||||||
| 2022 | $ | 2,916,948 | $ | 45,811 | $ | — | $ | (633) | $ | — | $ | 14,448 | $ | 2,976,574 | |||||||||||||||||||||||||||||||||
| 2021 | $ | 512,012 | $ | 19,314 | $ | — | $ | (32,934) | $ | — | $ | 6,705 | $ | 505,097 | |||||||||||||||||||||||||||||||||
Total Shareholder Return is cumulative from the final trading day of 2020 to the final trading day of the applicable year and assumes dividends are reinvested on the ex-dividend date. The peer group referenced in the table reflects the S&P 400 Consumer Discretionary Index.
CAP has been determined under the SEC-defined methodology. For equity-based compensation, in addition to equity that has vested in the applicable year, CAP includes the change in fair value for unvested awards. Importantly, these unvested award values have not actually been realized by the executive.
CAP vs. Total Shareholder Return (TSR) | ||
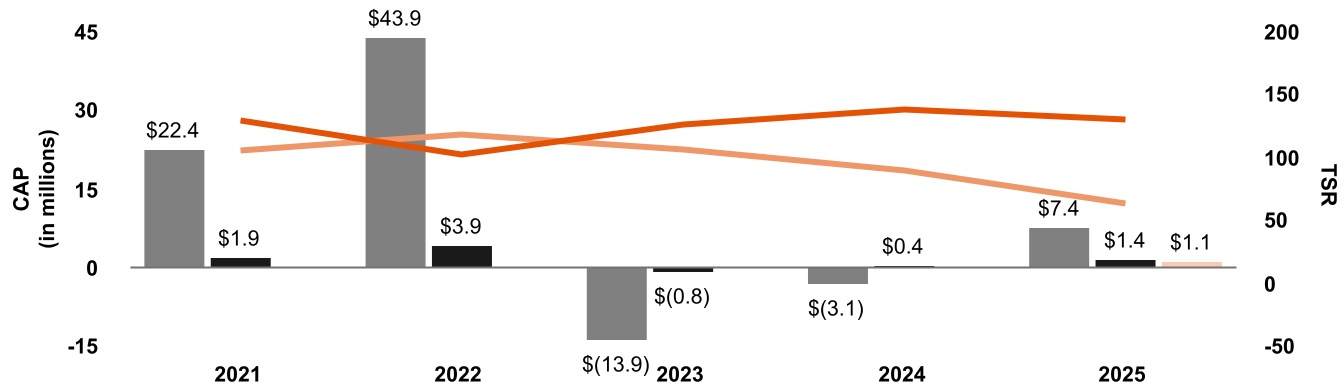
 | First PEO CAP |  | Non-PEO NEOs CAP |  | Second PEO CAP |  | H-D TSR |  | Peer Group TSR | ||||||||||||||||||||||||||||||||
•TSR is a performance measure the Human Resources Committee reviews when determining executive compensation and is included in the PVP Table above as required.
•Our performance shares include relative TSR as a measure.
•This table illustrates the relationship between CAP and TSR.
CAP vs. Net Income | ||
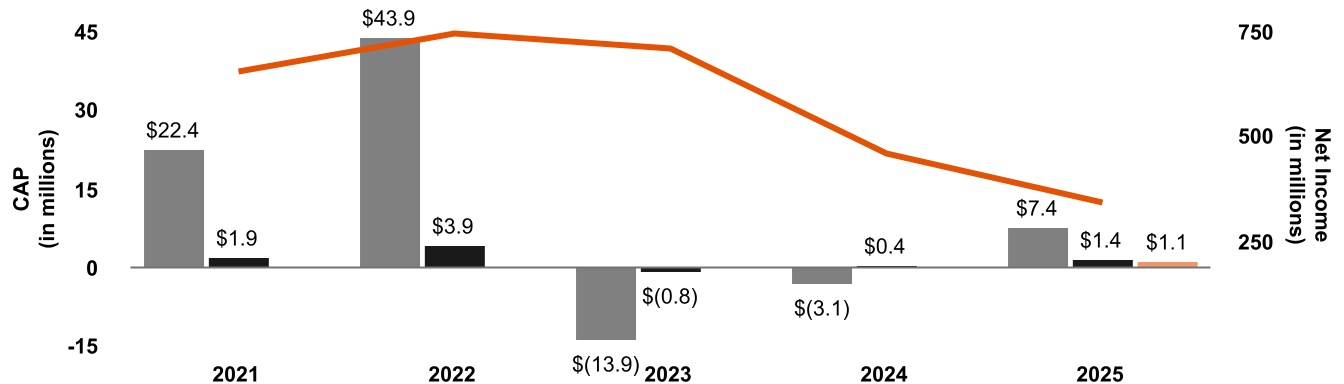
| | First PEO CAP | | Non-PEO NEOs CAP |  | Second PEO CAP | | Net Income | |||||||||||||||||||||||||
•Net income is not a performance measure we use when setting executive compensation, but it is included in the PVP Table above as required.
•This table illustrates the relationship between CAP and net income.
CAP vs. Operating Income | ||
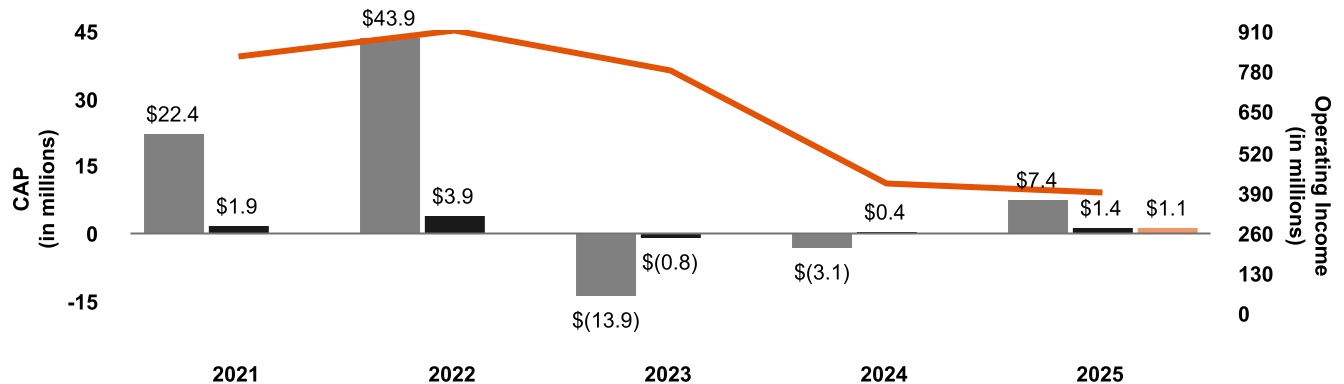
| | First PEO CAP | | Non-PEO NEOs CAP | | Second PEO CAP | | Operating Income | |||||||||||||||||||||||||
•The Company-selected measure we used to link CAP to Company performance during the most recently completed fiscal year is operating income.
•Operating income was the sole financial measure in our short-term incentive plan and, as an earnings measure, is a driver of stock price performance.
•This illustrates the relationship between CAP and operating income.
CAP vs. Total Shareholder Return (TSR) | ||
| | First PEO CAP | | Non-PEO NEOs CAP | | Second PEO CAP | | H-D TSR | | Peer Group TSR | ||||||||||||||||||||||||||||||||
•TSR is a performance measure the Human Resources Committee reviews when determining executive compensation and is included in the PVP Table above as required.
•Our performance shares include relative TSR as a measure.
•This table illustrates the relationship between CAP and TSR.
2025 Performance Measures
We identified the performance measures listed below as the most important measures for our NEOs.
| Tabular List of Performance Measures | ||
| Operating Income | ||
| Total Shareholder Return | ||
| Net Income | ||
We identified operating income, total shareholder return and net income as our “most important” measures because operating income and total shareholder return are used in our incentive awards to determine payouts. Net income is an important shareholder metric that impacts total shareholder return. These measures drive the largest portion of our NEO pay outcomes and are aligned with shareholder value.