Pay vs Performance Disclosure - USD ($)
|
12 Months Ended |
Dec. 31, 2025 |
Dec. 31, 2024 |
Dec. 31, 2023 |
Dec. 31, 2022 |
Dec. 31, 2021 |
| Pay vs Performance Disclosure |
|
|
|
|
|
| Pay vs Performance Disclosure, Table |
| | | | | | | | | | | | | | | | | | | | | | | | | | | | | | | | | | | | | Summary Compensation Table (SCT)
Total for
CEO(1)
($) | Compensation
Actually
Paid (CAP)
to CEO(1)(2)
($) | Average
SCT
Total for
Other
NEOs(1)
($) | Average
CAP to
Other
NEOs(1)(2)
($) | Value of Initial Fixed $100 Investment Based On: | Net Income
($ in millions) | Revenue (Company
Selected Measure)
($ in millions) | Year | Zoetis TSR
($) | S&P 500
Pharmaceuticals
Index TSR
($) | | 2025 | 19,046,509 | | 2,772,228 | | 4,015,823 | | 1,524,245 | | 79.52 | | 188.27 | | 2,673 | | 9,467 | | | 2024 | 17,206,760 | | 759,623 | | 3,351,274 | | 1,095,197 | | 101.62 | | 148.06 | | 2,486 | | 9,256 | | | 2023 | 15,237,853 | | 26,369,229 | | 2,994,932 | | 4,592,358 | | 121.90 | | 136.84 | | 2,344 | | 8,544 | | | 2022 | 14,003,540 | | (15,709,790) | | 2,931,816 | | (3,076,052) | | 89.69 | | 136.38 | | 2,114 | | 8,080 | | | 2021 | 13,098,491 | | 33,519,679 | | 4,455,516 | | 10,261,897 | | 148.26 | | 125.75 | | 2,037 | | 7,776 | |
|
|
|
|
|
| Company Selected Measure Name |
Revenue
|
|
|
|
|
| Named Executive Officers, Footnote |
In all years shown Kristin C. Peck was our Chief Executive Officer. The other named executive officers (NEO) represent the following individuals: for 2025, Wetteny Joseph, Robert J. Polzer, Jamie Brannan and Roxanne Lagano; for 2024, Wetteny Joseph, Robert J. Polzer, Jamie Brannan, Roxanne Lagano, Heidi C. Chen, and Wafaa Mamilli; for 2023, Wetteny Joseph, Heidi C. Chen, Wafaa Mamilli and Robert J. Polzer; for 2022, Wetteny Joseph, Glenn C. David, Heidi C. Chen, and Wafaa Mamilli; and for 2021, Wetteny Joseph, Glenn C. David, Catherine A. Knupp, Roman Trawicki and Heidi C. Chen
|
|
|
|
|
| PEO Total Compensation Amount |
$ 19,046,509
|
$ 17,206,760
|
$ 15,237,853
|
$ 14,003,540
|
$ 13,098,491
|
| PEO Actually Paid Compensation Amount |
$ 2,772,228
|
759,623
|
26,369,229
|
(15,709,790)
|
33,519,679
|
| Adjustment To PEO Compensation, Footnote |
To calculate Compensation Actually Paid (“CAP”) the following amounts were deducted from and added to the Summary Compensation Table (“SCT”) total compensation: CEO SCT Total to CAP Reconciliation: | | | | | | | | | | | | | | | | | | | | | | | | | | Deductions from SCT Total(a) | | | Year | SCT Total
($) | Stock Awards
($) | Options Awards
($) | Additions to
SCT Total(b)
($) | Compensation
Actually Paid
($) | | 2025 | 19,046,509 | | (10,218,583) | | (3,406,229) | | (2,649,469) | | 2,772,228 | | | 2024 | 17,206,760 | | (9,562,347) | | (3,187,500) | | (3,697,290) | | 759,623 | | | 2023 | 15,237,853 | | (8,774,860) | | (2,924,967) | | 22,831,203 | | 26,369,229 | | | 2022 | 14,003,540 | | (8,399,841) | | (2,799,966) | | (18,513,523) | | (15,709,790) | | | 2021 | 13,098,491 | | (6,929,797) | | (2,309,970) | | 29,660,955 | | 33,519,679 | |
CEO Equity Component of CAP: | | | | | | | | | | | | | | | | | | | | | | | | Year | Equity Type | Fair Value of Current Year Equity Awards at End of Year ($) | Change in Value of Prior Years’ Awards Unvested at End of Year ($) | Change in Value of Prior Years’ Awards That Vested During the Year ($) | Equity Value Included in CAP ($) | 2025 | Stock Options | 1,885,667 | | (2,098,846) | | (1,165,649) | | (1,378,828) | | Restricted Stock Units | 2,764,067 | | (1,672,795) | | 128,472 | | 1,219,744 | | Performance Award Units | 4,152,539 | | (6,642,924) | | — | | (2,490,385) | | Total | 8,802,273 | | (10,414,565) | | (1,037,177) | | (2,649,469) | | | 2024 | Stock Options | 1,599,375 | | (2,205,096) | | (40,922) | | (646,643) | | | Restricted Stock Units | 2,668,416 | | (867,090) | | 5,906 | | 1,807,232 | | | Performance Award Units | 2,859,270 | | (7,726,027) | | 8,878 | | (4,857,879) | | | Total | 7,127,061 | | (10,798,213) | | (26,138) | | (3,697,290) | | 2023 | Stock Options | 3,971,133 | | 1,923,431 | | 372,068 | | 6,266,632 | | Restricted Stock Units | 3,585,639 | | 1,500,387 | | 162,461 | | 5,248,488 | | Performance Award Units | 8,054,738 | | 3,060,551 | | 200,795 | | 11,316,083 | | Total | 15,611,510 | | 6,484,369 | | 735,324 | | 22,831,203 | | 2022 | Stock Options | 1,528,648 | | (7,897,241) | | (931,398) | | (7,299,991) | | Restricted Stock Units | 2,049,978 | | (2,672,369) | | (234,149) | | (856,541) | | Performance Award Units | 2,460,116 | | (12,009,652) | | (807,455) | | (10,356,991) | | Total | 6,038,742 | | (22,579,262) | | (1,973,002) | | (18,513,523) | | 2021 | Stock Options | 5,709,571 | | 5,052,274 | | 33,020 | | 10,794,866 | | Restricted Stock Units | 3,523,058 | | 1,469,682 | | 10,165 | | 5,002,905 | | Performance Award Units | 8,916,215 | | 4,932,126 | | 14,842 | | 13,863,183 | | Total | 18,148,844 | | 11,454,083 | | 58,027 | | 29,660,955 | |
|
|
|
|
|
| Non-PEO NEO Average Total Compensation Amount |
$ 4,015,823
|
3,351,274
|
2,994,932
|
2,931,816
|
4,455,516
|
| Non-PEO NEO Average Compensation Actually Paid Amount |
$ 1,524,245
|
1,095,197
|
4,592,358
|
(3,076,052)
|
10,261,897
|
| Adjustment to Non-PEO NEO Compensation Footnote |
Average Other NEOs SCT Total to CAP Reconciliation: | | | | | | | | | | | | | | | | | | | | | | | | | | Deductions from SCT Total(a) | | | Year | SCT Total ($) | Stock Awards ($) | Options Awards ($) | Additions to SCT Total(b) ($) | Compensation Actually Paid ($) | | 2025 | 4,015,823 | | (1,807,991) | | (602,728) | | (80,859) | | 1,524,245 | | | 2024 | 3,351,274 | | (1,236,913) | | (412,369) | | (606,795) | | 1,095,197 | | | 2023 | 2,994,932 | | (1,239,133) | | (413,112) | | 3,249,671 | | 4,592,358 | | | 2022 | 2,931,816 | | (1,405,542) | | (468,570) | | (4,133,756) | | (3,076,052) | | | 2021 | 4,455,516 | | (2,118,241) | | (366,105) | | 8,290,727 | | 10,261,897 | |
(a)These deductions are the amounts listed in the “Stock Awards” and “Option Awards” columns of the SCT and represent the grant date fair value of equity-based awards granted each year. (b)Reflects the value of equity calculated in accordance with the SEC methodology for determining CAP for each year shown. The equity component for each year is detailed in the supplemental table below: Average Other NEOs Equity Component of CAP: | | | | | | | | | | | | | | | | | | | | | | | | Year | Equity Type | Fair Value of Current Year Equity Awards at End of Year ($) | Change in Value of Prior Years’ Awards Unvested at End of Year ($) | Change in Value of Prior Years’ Awards That Vested During the Year ($) | Equity Value Included in CAP ($) | | 2025 | Stock Options | 333,666 | | (264,533) | | (123,407) | | (54,274) | | Restricted Stock Units | 442,928 | | (232,129) | | (112,232) | | 98,567 | | Performance Award Units | 734,704 | | (859,856) | | — | | (125,152) | | Total | 1,511,298 | | (1,356,518) | | (235,639) | | (80,859) | | | 2024 | Stock Options | 177,330 | | (251,572) | | (2,688) | | (76,930) | | | Restricted Stock Units | 303,934 | | (131,626) | | (106,952) | | 65,356 | | | Performance Awards Units | 324,800 | | (920,604) | | 583 | | (595,221) | | | Total | 806,064 | | (1,303,802) | | (109,057) | | (606,795) | | 2023 | Stock Options | 560,869 | | 169,611 | | 46,139 | | 776,619 | | Restricted Stock Units | 506,345 | | 509,551 | | 20,141 | | 1,036,037 | | Performance Award Units | 1,137,439 | | 284,615 | | 14,962 | | 1,437,015 | | Total | 2,204,652 | | 963,777 | | 81,242 | | 3,249,671 | | | 2022 | Stock Options | 255,817 | | (1,352,757) | | (446,281) | | (1,543,221) | | Restricted Stock Units | 343,039 | | (1,110,941) | | (112,191) | | (880,093) | | Performance Award Units | 411,640 | | (1,735,180) | | (386,902) | | (1,710,442) | | Total | 1,010,496 | | (4,198,878) | | (945,373) | | (4,133,756) | | | 2021 | Stock Options | 904,905 | | 1,796,558 | | 22,234 | | 2,723,696 | | Restricted Stock Units | 1,897,216 | | 490,667 | | 6,844 | | 2,394,727 | | Performance Award Units | 1,413,054 | | 1,749,257 | | 9,993 | | 3,172,304 | | Total | 4,215,175 | | 4,036,482 | | 39,071 | | 8,290,727 | |
|
|
|
|
|
| Compensation Actually Paid vs. Total Shareholder Return |
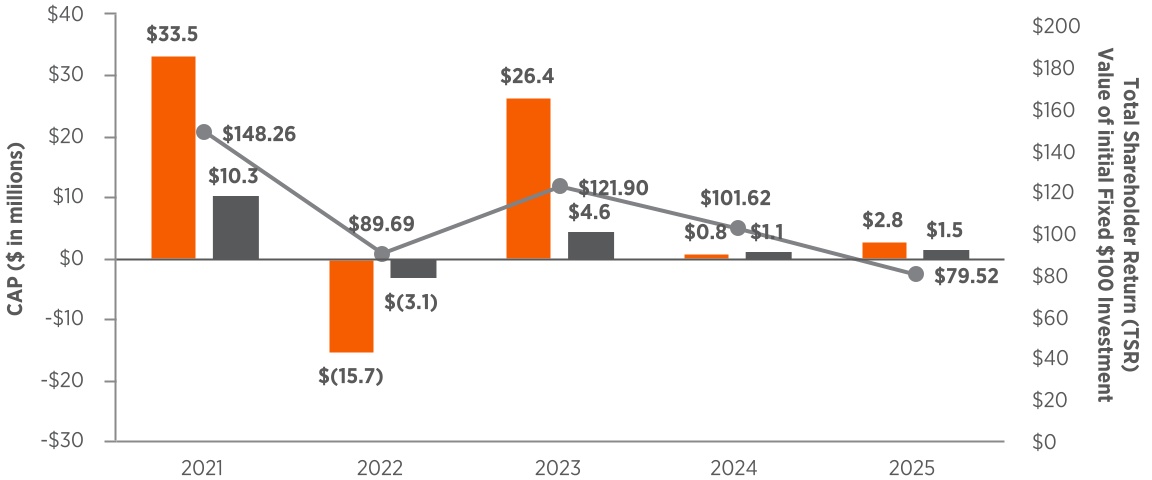
Compensation Actually Paid (CAP) versus Zoetis TSR The graph below compares the Compensation Actually Paid (CAP) of the CEO and the Other NEOs, to Zoetis’ TSR for the five fiscal years beginning with 2021. As the graph shows, the CAP to the CEO and Other NEOs is directionally aligned with the Company’s TSR. CAP vs. TSR: Zoetis | | | | | | | | | | | | | | | | | | | n | CEO Cap | n | Other NEO Avg. CAP | | Zoetis TSR |
|
|
|
|
|
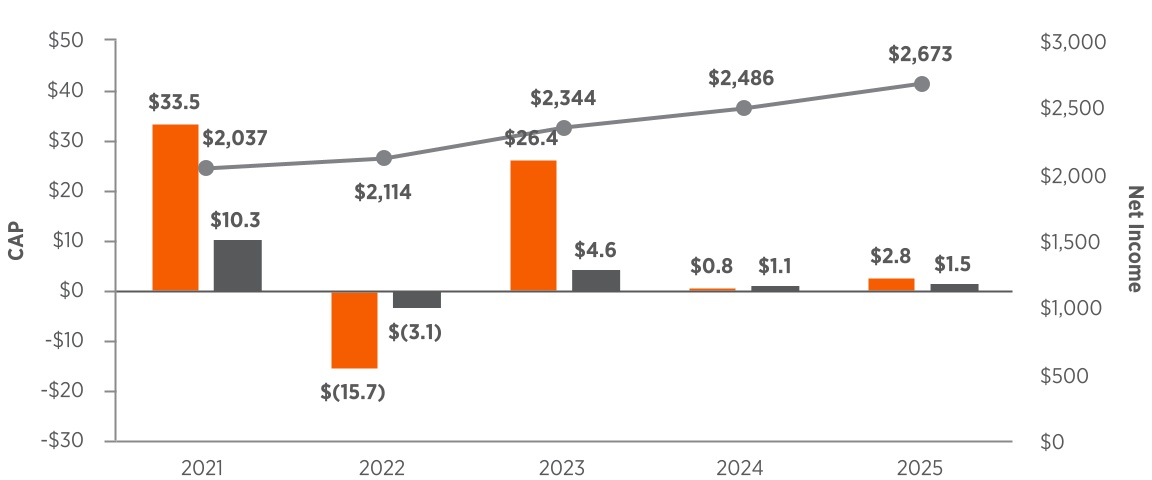
| Compensation Actually Paid vs. Net Income |
CAP versus Net Income The graph below compares the CAP of the CEO and the Other NEOs, to Zoetis’ net income for the five fiscal years beginning with 2021. Net Income has steadily increased while the CEO and Other NEOs CAP has varied by year. Zoetis does not use net income as a metric in its compensation incentives. CAP vs. Net Income ($ in millions) | | | | | | | | | | | | | | | | | | | n | CEO Cap | n | Other NEO Avg. CAP | | Net Income |
|
|
|
|
|
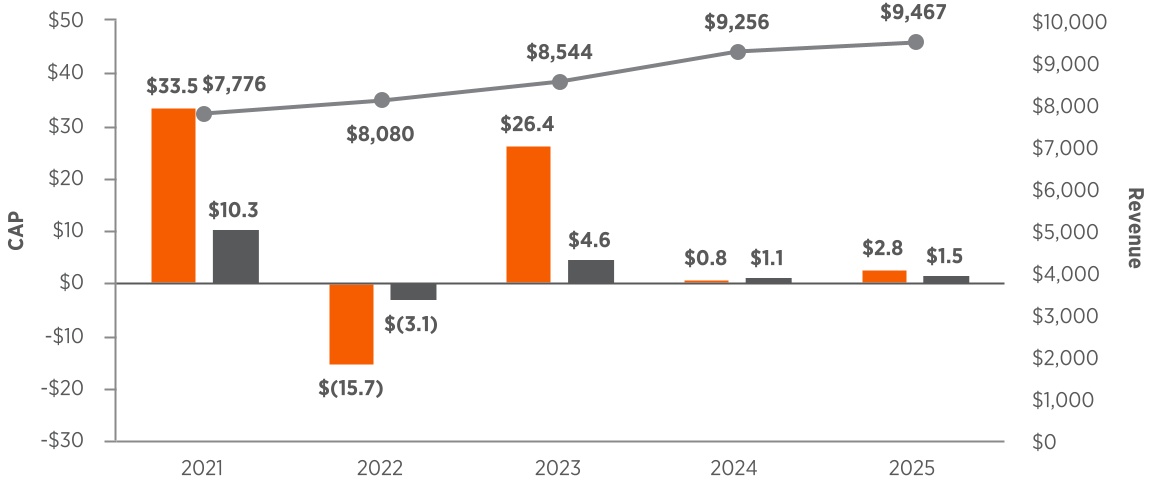
| Compensation Actually Paid vs. Company Selected Measure |
CAP versus Revenue (Company Selected Measure) The graph below compares the CAP of the CEO and the Other NEOs, to Zoetis’ revenue for the five fiscal years beginning with 2021. Revenue has steadily increased while the CEO and Other NEOs’ CAP has varied by year. While revenue is a metric in Zoetis’ AIP, the weight of equity-based LTI — which primarily reflect stock price and relative TSR — exceeds the weight of our annual incentive in the total compensation for executives. CAP vs. Revenue ($ in millions) | | | | | | | | | | | | | | | | | | | n | CEO Cap | n | Other NEO Avg. CAP | | Revenue |
|
|
|
|
|
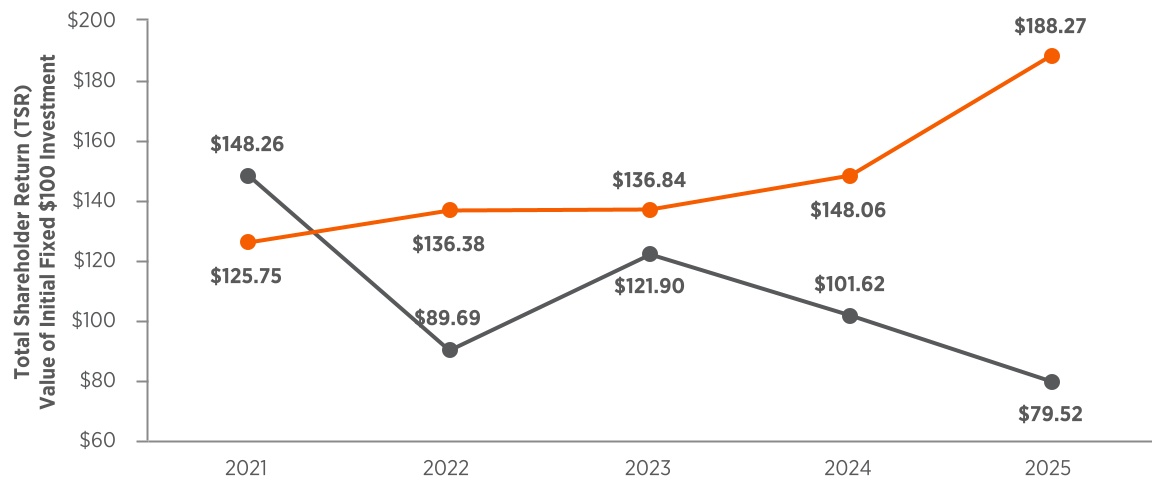
| Total Shareholder Return Vs Peer Group |
Total Shareholder Return (TSR): Zoetis versus S&P 500 Pharmaceuticals Index The graph below compares an initial investment in our common stock of $100 on December 31, 2020, versus the same investment in the S&P 500 Pharmaceuticals Index (assuming dividends, if any, were reinvested). It should be noted that the companies in the S&P 500 Pharmaceuticals index are not the same as those used for our compensation benchmarking, nor are they the same group of companies we use to determine Relative TSR for the company’s performance award unit metric, as described in the CD&A. TSR: Zoetis vs. S&P 500 Pharmaceuticals Index | | | | | | | | | | | | | Zoetis TSR | | S&P 500 Pharmaceuticals TSR |
|
|
|
|
|
| Tabular List, Table |
| | | | Most Important Performance Measures | Relative Total Shareholder Return(a) | Revenue(b)(c) | Adjusted Diluted EPS(b) | Free Cash Flow(b) |
|
|
|
|
|
| Total Shareholder Return Amount |
$ 79.52
|
101.62
|
121.90
|
89.69
|
148.26
|
| Peer Group Total Shareholder Return Amount |
188.27
|
148.06
|
136.84
|
136.38
|
125.75
|
| Net Income (Loss) |
$ 2,673,000,000
|
$ 2,486,000,000
|
$ 2,344,000,000
|
$ 2,114,000,000
|
$ 2,037,000,000
|
| Company Selected Measure Amount |
9,467,000,000
|
9,256,000,000
|
8,544,000,000
|
8,080,000,000
|
7,776,000,000
|
| PEO Name |
Kristin C. Peck
|
|
|
|
|
| Additional 402(v) Disclosure |
The four items listed below represent the most important metrics we used to determine CAP for 2025 as further described in our CD&A within the sections titled “Annual Incentive Plan” and “Long-Term Incentives”: Relative Total Shareholder Return is the 3-year performance metric used for Zoetis’ performance award units, which comprise 50% of the long-term incentive compensation of our NEOs, including the CEO. Total Shareholder Return (“TSR”) is the appreciation of share price, including dividends, during the performance period. Relative TSR is Zoetis’ TSR as compared to the TSR over the performance period of the “S&P 500 Health Care Group”, which we define as the companies comprising the S&P 500 Health Care index as of the beginning of the performance period, excluding companies that during the performance period are acquired or no longer publicly traded. (b)Revenue, Adjusted Diluted EPS and Free Cash Flow refer to the measures used to assess performance in determining the funding for our Annual Incentive Plan (AIP) and exclude the impacts of foreign exchange and certain other adjustments as described in the CD&A. (c)Three-year average annual Operational Revenue Growth is a performance goal for our current year performance award units.
|
|
|
|
|
| Measure:: 1 |
|
|
|
|
|
| Pay vs Performance Disclosure |
|
|
|
|
|
| Name |
Relative Total Shareholder Return
|
|
|
|
|
| Measure:: 2 |
|
|
|
|
|
| Pay vs Performance Disclosure |
|
|
|
|
|
| Name |
Revenue
|
|
|
|
|
| Measure:: 3 |
|
|
|
|
|
| Pay vs Performance Disclosure |
|
|
|
|
|
| Name |
Adjusted Diluted EPS
|
|
|
|
|
| Measure:: 4 |
|
|
|
|
|
| Pay vs Performance Disclosure |
|
|
|
|
|
| Name |
Free Cash Flow
|
|
|
|
|
| PEO | Equity Awards Adjustments, Excluding Value Reported in Compensation Table |
|
|
|
|
|
| Pay vs Performance Disclosure |
|
|
|
|
|
| Adjustment to Compensation, Amount |
$ (2,649,469)
|
$ (3,697,290)
|
$ 22,831,203
|
$ (18,513,523)
|
$ 29,660,955
|
| PEO | Year-end Fair Value of Equity Awards Granted in Covered Year that are Outstanding and Unvested |
|
|
|
|
|
| Pay vs Performance Disclosure |
|
|
|
|
|
| Adjustment to Compensation, Amount |
8,802,273
|
7,127,061
|
15,611,510
|
6,038,742
|
18,148,844
|
| PEO | Year-over-Year Change in Fair Value of Equity Awards Granted in Prior Years That are Outstanding and Unvested |
|
|
|
|
|
| Pay vs Performance Disclosure |
|
|
|
|
|
| Adjustment to Compensation, Amount |
(10,414,565)
|
(10,798,213)
|
6,484,369
|
(22,579,262)
|
11,454,083
|
| PEO | Change in Fair Value as of Vesting Date of Prior Year Equity Awards Vested in Covered Year |
|
|
|
|
|
| Pay vs Performance Disclosure |
|
|
|
|
|
| Adjustment to Compensation, Amount |
(1,037,177)
|
(26,138)
|
735,324
|
(1,973,002)
|
58,027
|
| PEO | Aggregate Grant Date Fair Value Of Equity Award Amounts Reported In Summary Compensation Table, Stock Awards [Member] |
|
|
|
|
|
| Pay vs Performance Disclosure |
|
|
|
|
|
| Adjustment to Compensation, Amount |
(10,218,583)
|
(9,562,347)
|
(8,774,860)
|
(8,399,841)
|
(6,929,797)
|
| PEO | Aggregate Grant Date Fair Value Of Equity Award Amounts Reported In Summary Compensation Table, Option Awards [Member] |
|
|
|
|
|
| Pay vs Performance Disclosure |
|
|
|
|
|
| Adjustment to Compensation, Amount |
(3,406,229)
|
(3,187,500)
|
(2,924,967)
|
(2,799,966)
|
(2,309,970)
|
| PEO | Year-End Fair Value Of Equity Awards Granted In Covered Year That Are Outstanding And Unvested, Stock Options [Member] |
|
|
|
|
|
| Pay vs Performance Disclosure |
|
|
|
|
|
| Adjustment To Compensation Amount, Equity Awards |
1,885,667
|
1,599,375
|
3,971,133
|
1,528,648
|
5,709,571
|
| PEO | Year-Over-Year Change In Fair Value Of Equity Awards Granted In Prior Years That Are Outstanding And Unvested, Stock Options [Member] |
|
|
|
|
|
| Pay vs Performance Disclosure |
|
|
|
|
|
| Adjustment To Compensation Amount, Equity Awards |
(2,098,846)
|
(2,205,096)
|
1,923,431
|
(7,897,241)
|
5,052,274
|
| PEO | Change In Fair Value As Of Vesting Date Of Prior Year Equity Awards Vested In Covered Year, Stock Options [Member] |
|
|
|
|
|
| Pay vs Performance Disclosure |
|
|
|
|
|
| Adjustment To Compensation Amount, Equity Awards |
(1,165,649)
|
(40,922)
|
372,068
|
(931,398)
|
33,020
|
| PEO | Equity Awards Adjustments, Excluding Value Reported In The Compensation Table, Stock Options [Member] |
|
|
|
|
|
| Pay vs Performance Disclosure |
|
|
|
|
|
| Adjustment To Compensation Amount, Equity Awards |
(1,378,828)
|
(646,643)
|
6,266,632
|
(7,299,991)
|
10,794,866
|
| PEO | Year-End Fair Value Of Equity Awards Granted In Covered Year That Are Outstanding And Unvested, Restricted Stock Units [Member] |
|
|
|
|
|
| Pay vs Performance Disclosure |
|
|
|
|
|
| Adjustment To Compensation Amount, Equity Awards |
2,764,067
|
2,668,416
|
3,585,639
|
2,049,978
|
3,523,058
|
| PEO | Year-Over-Year Change In Fair Value Of Equity Awards Granted In Prior Years That Are Outstanding And Unvested, Restricted Stock Units [Member] |
|
|
|
|
|
| Pay vs Performance Disclosure |
|
|
|
|
|
| Adjustment To Compensation Amount, Equity Awards |
(1,672,795)
|
(867,090)
|
1,500,387
|
(2,672,369)
|
1,469,682
|
| PEO | Change In Fair Value As Of Vesting Date Of Prior Year Equity Awards Vested In Covered Year, Restricted Stock Units [Member] |
|
|
|
|
|
| Pay vs Performance Disclosure |
|
|
|
|
|
| Adjustment To Compensation Amount, Equity Awards |
128,472
|
5,906
|
162,461
|
(234,149)
|
10,165
|
| PEO | Equity Awards Adjustments, Excluding Value Reported In The Compensation Table, Restricted Stock Units [Member] |
|
|
|
|
|
| Pay vs Performance Disclosure |
|
|
|
|
|
| Adjustment To Compensation Amount, Equity Awards |
1,219,744
|
1,807,232
|
5,248,488
|
(856,541)
|
5,002,905
|
| PEO | Year-End Fair Value Of Equity Awards Granted In Covered Year That Are Outstanding And Unvested, Performance Award Units [Member] |
|
|
|
|
|
| Pay vs Performance Disclosure |
|
|
|
|
|
| Adjustment To Compensation Amount, Equity Awards |
4,152,539
|
2,859,270
|
8,054,738
|
2,460,116
|
8,916,215
|
| PEO | Year-Over-Year Change In Fair Value Of Equity Awards Granted In Prior Years That Are Outstanding And Unvested, Performance Award Units [Member] |
|
|
|
|
|
| Pay vs Performance Disclosure |
|
|
|
|
|
| Adjustment To Compensation Amount, Equity Awards |
(6,642,924)
|
(7,726,027)
|
3,060,551
|
(12,009,652)
|
4,932,126
|
| PEO | Change In Fair Value As Of Vesting Date Of Prior Year Equity Awards Vested In Covered Year, Performance Award Units [Member] |
|
|
|
|
|
| Pay vs Performance Disclosure |
|
|
|
|
|
| Adjustment To Compensation Amount, Equity Awards |
0
|
8,878
|
200,795
|
(807,455)
|
14,842
|
| PEO | Equity Awards Adjustments, Excluding Value Reported In The Compensation Table, Performance Award Units [Member] |
|
|
|
|
|
| Pay vs Performance Disclosure |
|
|
|
|
|
| Adjustment To Compensation Amount, Equity Awards |
(2,490,385)
|
(4,857,879)
|
11,316,083
|
(10,356,991)
|
13,863,183
|
| Non-PEO NEO | Equity Awards Adjustments, Excluding Value Reported in Compensation Table |
|
|
|
|
|
| Pay vs Performance Disclosure |
|
|
|
|
|
| Adjustment to Compensation, Amount |
(80,859)
|
(606,795)
|
3,249,671
|
(4,133,756)
|
8,290,727
|
| Non-PEO NEO | Year-end Fair Value of Equity Awards Granted in Covered Year that are Outstanding and Unvested |
|
|
|
|
|
| Pay vs Performance Disclosure |
|
|
|
|
|
| Adjustment to Compensation, Amount |
1,511,298
|
806,064
|
2,204,652
|
1,010,496
|
4,215,175
|
| Non-PEO NEO | Year-over-Year Change in Fair Value of Equity Awards Granted in Prior Years That are Outstanding and Unvested |
|
|
|
|
|
| Pay vs Performance Disclosure |
|
|
|
|
|
| Adjustment to Compensation, Amount |
(1,356,518)
|
(1,303,802)
|
963,777
|
(4,198,878)
|
4,036,482
|
| Non-PEO NEO | Change in Fair Value as of Vesting Date of Prior Year Equity Awards Vested in Covered Year |
|
|
|
|
|
| Pay vs Performance Disclosure |
|
|
|
|
|
| Adjustment to Compensation, Amount |
(235,639)
|
(109,057)
|
81,242
|
(945,373)
|
39,071
|
| Non-PEO NEO | Aggregate Grant Date Fair Value Of Equity Award Amounts Reported In Summary Compensation Table, Stock Awards [Member] |
|
|
|
|
|
| Pay vs Performance Disclosure |
|
|
|
|
|
| Adjustment to Compensation, Amount |
(1,807,991)
|
(1,236,913)
|
(1,239,133)
|
(1,405,542)
|
(2,118,241)
|
| Non-PEO NEO | Aggregate Grant Date Fair Value Of Equity Award Amounts Reported In Summary Compensation Table, Option Awards [Member] |
|
|
|
|
|
| Pay vs Performance Disclosure |
|
|
|
|
|
| Adjustment to Compensation, Amount |
(602,728)
|
(412,369)
|
(413,112)
|
(468,570)
|
(366,105)
|
| Non-PEO NEO | Year-End Fair Value Of Equity Awards Granted In Covered Year That Are Outstanding And Unvested, Stock Options [Member] |
|
|
|
|
|
| Pay vs Performance Disclosure |
|
|
|
|
|
| Adjustment To Compensation Amount, Equity Awards |
333,666
|
177,330
|
560,869
|
255,817
|
904,905
|
| Non-PEO NEO | Year-Over-Year Change In Fair Value Of Equity Awards Granted In Prior Years That Are Outstanding And Unvested, Stock Options [Member] |
|
|
|
|
|
| Pay vs Performance Disclosure |
|
|
|
|
|
| Adjustment To Compensation Amount, Equity Awards |
(264,533)
|
(251,572)
|
169,611
|
(1,352,757)
|
1,796,558
|
| Non-PEO NEO | Change In Fair Value As Of Vesting Date Of Prior Year Equity Awards Vested In Covered Year, Stock Options [Member] |
|
|
|
|
|
| Pay vs Performance Disclosure |
|
|
|
|
|
| Adjustment To Compensation Amount, Equity Awards |
(123,407)
|
(2,688)
|
46,139
|
(446,281)
|
22,234
|
| Non-PEO NEO | Equity Awards Adjustments, Excluding Value Reported In The Compensation Table, Stock Options [Member] |
|
|
|
|
|
| Pay vs Performance Disclosure |
|
|
|
|
|
| Adjustment To Compensation Amount, Equity Awards |
(54,274)
|
(76,930)
|
776,619
|
(1,543,221)
|
2,723,696
|
| Non-PEO NEO | Year-End Fair Value Of Equity Awards Granted In Covered Year That Are Outstanding And Unvested, Restricted Stock Units [Member] |
|
|
|
|
|
| Pay vs Performance Disclosure |
|
|
|
|
|
| Adjustment To Compensation Amount, Equity Awards |
442,928
|
303,934
|
506,345
|
343,039
|
1,897,216
|
| Non-PEO NEO | Year-Over-Year Change In Fair Value Of Equity Awards Granted In Prior Years That Are Outstanding And Unvested, Restricted Stock Units [Member] |
|
|
|
|
|
| Pay vs Performance Disclosure |
|
|
|
|
|
| Adjustment To Compensation Amount, Equity Awards |
(232,129)
|
(131,626)
|
509,551
|
(1,110,941)
|
490,667
|
| Non-PEO NEO | Change In Fair Value As Of Vesting Date Of Prior Year Equity Awards Vested In Covered Year, Restricted Stock Units [Member] |
|
|
|
|
|
| Pay vs Performance Disclosure |
|
|
|
|
|
| Adjustment To Compensation Amount, Equity Awards |
(112,232)
|
(106,952)
|
20,141
|
(112,191)
|
6,844
|
| Non-PEO NEO | Equity Awards Adjustments, Excluding Value Reported In The Compensation Table, Restricted Stock Units [Member] |
|
|
|
|
|
| Pay vs Performance Disclosure |
|
|
|
|
|
| Adjustment To Compensation Amount, Equity Awards |
98,567
|
65,356
|
1,036,037
|
(880,093)
|
2,394,727
|
| Non-PEO NEO | Year-End Fair Value Of Equity Awards Granted In Covered Year That Are Outstanding And Unvested, Performance Award Units [Member] |
|
|
|
|
|
| Pay vs Performance Disclosure |
|
|
|
|
|
| Adjustment To Compensation Amount, Equity Awards |
734,704
|
324,800
|
1,137,439
|
411,640
|
1,413,054
|
| Non-PEO NEO | Year-Over-Year Change In Fair Value Of Equity Awards Granted In Prior Years That Are Outstanding And Unvested, Performance Award Units [Member] |
|
|
|
|
|
| Pay vs Performance Disclosure |
|
|
|
|
|
| Adjustment To Compensation Amount, Equity Awards |
(859,856)
|
(920,604)
|
284,615
|
(1,735,180)
|
1,749,257
|
| Non-PEO NEO | Change In Fair Value As Of Vesting Date Of Prior Year Equity Awards Vested In Covered Year, Performance Award Units [Member] |
|
|
|
|
|
| Pay vs Performance Disclosure |
|
|
|
|
|
| Adjustment To Compensation Amount, Equity Awards |
0
|
583
|
14,962
|
(386,902)
|
9,993
|
| Non-PEO NEO | Equity Awards Adjustments, Excluding Value Reported In The Compensation Table, Performance Award Units [Member] |
|
|
|
|
|
| Pay vs Performance Disclosure |
|
|
|
|
|
| Adjustment To Compensation Amount, Equity Awards |
$ (125,152)
|
$ (595,221)
|
$ 1,437,015
|
$ (1,710,442)
|
$ 3,172,304
|