Pay vs Performance Disclosure - USD ($)
Dec. 31, 2025
Dec. 31, 2024
Dec. 31, 2023
Dec. 31, 2022
Dec. 31, 2021
| Pay Versus Performance | ||||||||||||||||||||||||||
| Value of Initial Fixed $100 Investment Based on: | ||||||||||||||||||||||||||
Year (1) | Summary Compensation Table Total for PEO | Compensation Actually Paid to PEO (2)(3) | Average Summary Compensation Table Total for Non-PEO NEOs | Average Compensation Actually Paid to Non-PEO NEOs (2) | Total Shareholder Return | Peer Group Total Shareholder Return (4) | Net Income | Adjusted Free Cash Flow (5) | ||||||||||||||||||
(in millions) | ||||||||||||||||||||||||||
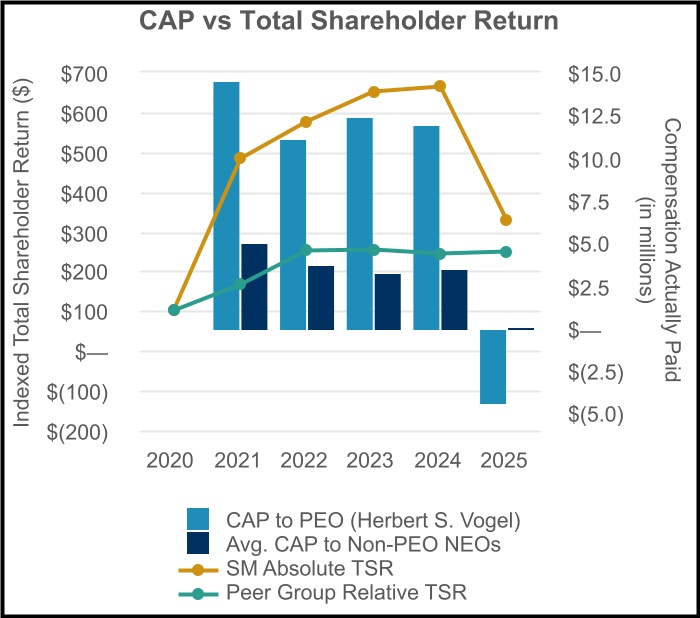
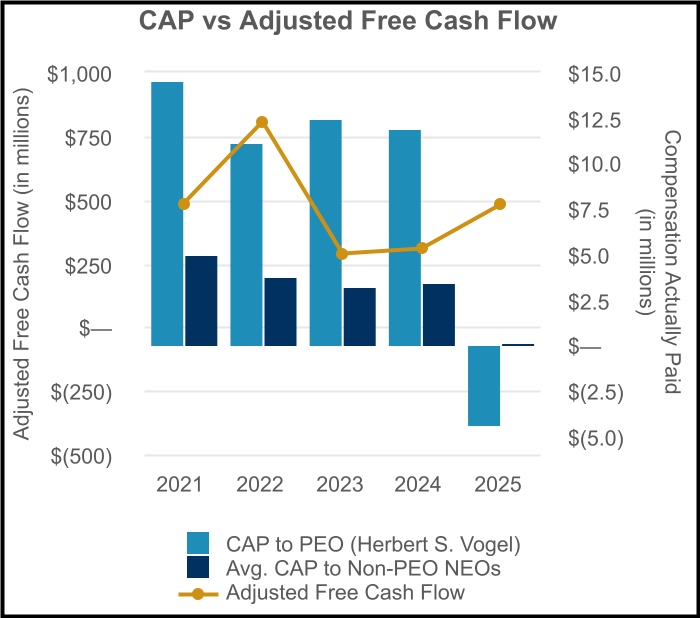
| 2025 | $ | 7,878,612 | $ | (4,392,669) | $ | 3,152,219 | $ | 125,782 | $ | 328.58 | $ | 249.26 | $ | 648 | $ | 481 | ||||||||||
| 2024 | $ | 12,240,662 | $ | 11,928,971 | $ | 3,516,638 | $ | 3,473,519 | $ | 663.43 | $ | 244.11 | $ | 770 | $ | 306 | ||||||||||
| 2023 | $ | 11,060,630 | $ | 12,463,744 | $ | 2,891,619 | $ | 3,247,712 | $ | 650.33 | $ | 254.80 | $ | 818 | $ | 285 | ||||||||||
| 2022 | $ | 6,733,036 | $ | 11,113,208 | $ | 2,083,619 | $ | 3,751,637 | $ | 575.24 | $ | 252.51 | $ | 1,112 | $ | 804 | ||||||||||
| 2021 | $ | 4,295,321 | $ | 14,520,242 | $ | 1,639,759 | $ | 5,005,015 | $ | 482.24 | $ | 165.60 | $ | 36 | $ | 483 | ||||||||||
•2025 and 2024: A. Wade Pursell, Elizabeth A. McDonald, James B. Lebeck, Kenneth J. Knott
•2023: A. Wade Pursell, James B. Lebeck, Kenneth J. Knott, Mary Ellen Lutey
•2022 and 2021: A. Wade Pursell, David W. Copeland, Mary Ellen Lutey, Lehman E. Newton, III
The following table sets forth the adjustments made during 2025 in the Pay Versus Performance table to arrive at compensation actually paid to our PEO and non-PEO NEOs:
| Adjustments to Determine Compensation Actually Paid | |||||||||||
| 2025 | |||||||||||
| PEO (Herbert S. Vogel) | Average for Non-PEO NEOs | ||||||||||
| Total Compensation as reported in SCT | $ | 7,878,612 | $ | 3,152,219 | |||||||
| Deduction of “Change in Pension Value and Nonqualified Deferred Compensation Earnings” reported in SCT | (342,029) | (96,728) | |||||||||
| Service cost for pension plans | 143,513 | 35,891 | |||||||||
| Deduction of “Stock Awards” reported in SCT | (5,500,001) | (1,824,993) | |||||||||
Fair value of awards granted during year, which remain unvested as of year-end | 3,232,881 | 1,112,368 | |||||||||
Year-over-year change in fair value of awards granted in prior years that were outstanding and unvested as of year-end | (7,700,131) | (1,864,073) | |||||||||
Change in fair value from prior year-end to vesting date of awards granted in prior years that vested during the year | (2,105,514) | (388,902) | |||||||||
Compensation Actually Paid | $ | (4,392,669) | $ | 125,782 | |||||||
Unvested equity awards presented in the table above are computed in accordance with FASB ASC Topic 718.

The following is an unranked list of the most important performance measures that link compensation actually paid to our PEO and non-PEO NEOs to Company performance. See the CD&A section above for additional discussion of why we think these measures are important.
| Performance Measure | Description | ||||
| Adjusted Free Cash Flow | Net cash provided by (used in) operating activities less capital expenditures, less budgeted stockholder returns actually paid in the period. | ||||
Absolute TSR | Measurement of the compounded annual growth rate of the Company’s TSR. | ||||
| Relative TSR | Measurement of the compounded annual growth rate of the Company’s TSR compared to that of the applicable peer group. | ||||
| Adjusted EBITDAX | Adjusted EBITDAX represents net income (loss) before interest expense, interest income, income taxes, depletion, depreciation, amortization expense, exploration expense, property abandonment and impairment expense, non-cash stock-based compensation expense, derivative gains and losses net of settlements, gains and losses on divestitures, gains and losses on extinguishment of debt, and certain other items. | ||||
(5) We deemed adjusted free cash flow to be the most important financial performance measure used to link Company performance to compensation actually paid to our PEO and non-PEO NEOs for all years presented. See “Performance Measure” table below for additional detail.