Pay vs Performance Disclosure - USD ($)
Dec. 31, 2025
Dec. 31, 2024
Dec. 31, 2023
Dec. 31, 2022
Dec. 31, 2021
PAY VERSUS PERFORMANCE DISCLOSURE
Under Section 953(a) of the Dodd-Frank Wall Street Reform and Consumer Protection Act and Item 402(v) of Regulation
S-K
of the Securities Act, public companies are required to provide certain information about the relationship between executive compensation actually paid to the Chief Executive Officer, who is referred to as our principal executive officer (“PEO”), and other named executive officers and certain financial performance of such companies. The information otherwise required by Item 402(v) of Regulation S-K
is provided below. | Year |
Summary Compensation Table Total for Current PEO (1)(2) |
Compensation Actually Paid to Current PEO (1)(3) |
Summary Compensation Table Total for Former PEO (1)(2) |
Compensation Actually Paid to Former PEO (1)(3) |
Average Summary Compensation Table Total for Non-PEO NEOs (4) |
Average Compensation Actually Paid to Non-PEO NEOs (5) |
Value of Initial Fixed $100 Investment Based On: |
Net Income (Loss) (in millions) (8) |
||||||||||||||||||||||||||||
Total Shareholder Return (6) |
Peer Group Total Shareholder Return (7) |
|||||||||||||||||||||||||||||||||||
| 2025 |
$ | 1,825,600 | $ | 986,375 | $ | 68,880 | $ | (193,843 | ) | $ | 964,689 | $ | 532,441 | $ | 454.07 | $ | 351.19 | $ | (206 | ) | ||||||||||||||||
| 2024 |
$ | — | $ | — | $ | 1,245,313 | $ | 1,892,428 | $ | 622,671 | $ | 946,237 | $ | 544.01 | $ | 457.20 | $ | 604 | ||||||||||||||||||
| 2023 |
$ | — | $ | — | $ | — | $ | — | $ | — | $ | — | $ | 328.99 | $ | 321.80 | $ | 501 | ||||||||||||||||||
| 2022 |
$ | — | $ | — | $ | — | $ | — | $ | — | $ | — | $ | 314.02 | $ | 360.36 | $ | 655 | ||||||||||||||||||
| 2021 |
$ | — | $ | — | $ | — | $ | — | $ | — | $ | 14,892 | $ | 194.07 | $ | 216.74 | $ | 257 | ||||||||||||||||||
(1) |
PEO and Non-PEO NEOs included in these columns reflect the following: |
| Year |
PEO |
Non-PEO NEOs | ||
| 2025 |
Current PEO: Kaes Van’t Hof Former PEO: Travis D. Stice |
Teresa L. Dick, Al Barkmann, Austen Gilfillian, Matt Zmigrosky | ||
| 2024 |
Travis D. Stice | Kaes Van’t Hof, Teresa L. Dick, Al Barkmann, Matt Zmigrosky | ||
| 2023 |
Travis D. Stice | Kaes Van’t Hof, Teresa L. Dick, Matt Zmigrosky | ||
| 2022 |
Travis D. Stice | Kaes Van’t Hof, Teresa L. Dick, Matt Zmigrosky | ||
| 2021 |
Travis D. Stice | Kaes Van’t Hof, Teresa L. Dick, Matt Zmigrosky |
(2) |
The dollar amounts reported are the amounts of total compensation reported in our Summary Compensation Table. |
(3) |
The dollar amounts reported represent the amount of “compensation actually paid,” as computed in accordance with SEC rules. The dollar amounts do not reflect the actual amount of compensation earned by or paid during the applicable year. In accordance with SEC rules, the following adjustments were made to total compensation to determine the compensation actually paid: |
Reported Summary Compensation Table Total for PEO |
Deductions: |
Additions: |
Compensation Actually Paid to PEO |
|||||||||||||
| Year |
Reported Value of Equity Awards (a) |
Equity Award Adjustments (b) |
||||||||||||||
| Current PEO: |
||||||||||||||||
| 2025 |
$ | 1,825,600 | $ | 1,825,600 | $ | 986,375 | $ | 986,375 | ||||||||
| Former PEO: |
||||||||||||||||
| 2025 |
$ | 68,880 | $ | — | $ | (262,723 | ) | $ | (193,843 | ) | ||||||
| 2024 |
$ | 1,245,313 | $ | 1,245,313 | $ | 1,892,428 | $ | 1,892,428 | ||||||||
| 2023 |
$ | — | $ | — | $ | — | $ | — | ||||||||
| 2022 |
$ | — | $ | — | $ | — | $ | — | ||||||||
| 2021 |
$ | — | $ | — | $ | — | $ | — | ||||||||
(a) |
The grant date fair value of equity awards represents the total of the amounts reported in the “Stock Awards” columns in the Summary Compensation Table for the applicable year. |
(b) |
The equity award adjustments for each applicable year include the addition (or subtraction, as applicable) of the following: (i) the year-end fair value of any equity awards granted in the applicable year that are outstanding and unvested as of the end of the year; (ii) the amount of change as of the end of the applicable year (from the end of the prior fiscal year) in fair value of any awards granted in prior years that are outstanding and unvested as of the end of the applicable year; (iii) for awards that are granted and vest in the same applicable year, the fair value as of the vesting date; (iv) for awards granted in prior years that vest in the applicable year, the amount equal to the change as of the vesting date (from the end of the prior fiscal year) in fair value; (v) for awards granted in prior years that are determined to fail to meet the applicable vesting conditions during the applicable year, a deduction for the amount equal to the fair value at the end of the prior fiscal year; and (vi) the dollar value of any dividends or other earnings paid on stock or option awards in the applicable year prior to the vesting date that are not otherwise reflected in the fair value of such award or included in any other component of total compensation for the applicable year. The valuation assumptions used to calculate fair values did not materially differ from those disclosed at the time of grant. The amounts deducted or added in calculating the equity award adjustments are as follows: |
| Year |
Year End Fair Value of Current Year Equity Awards that Remain Unvested at Year-End |
Change in Fair Value of Equity Awards Granted in Prior Years that are Unvested at Year-End |
Fair Value as of Vesting Date of Equity Awards Granted and Vested in the Year |
Change in Fair Value of Equity Awards Granted in Prior Years that Vested in the Year |
Fair Value at the End of the Prior Year of Equity Awards that Failed to Meet Vesting Conditions in the Year |
Value of Dividends or other Earnings Paid on Stock or Option Awards not Otherwise Reflected in Fair Value |
Total Equity Award Adjustments |
|||||||||||||||||||||
| Current PEO: |
||||||||||||||||||||||||||||
| 2025 |
$ | 1,186,015 | $ | (311,350 | ) | $ | — | $ | — | $ | — | $ | 111,710 | $ | 986,375 | |||||||||||||
| Former PEO: |
||||||||||||||||||||||||||||
| 2025 |
$ | — | $ | (311,350 | ) | $ | — | $ | — | $ | — | $ | 48,627 | $ | (262,723 | ) | ||||||||||||
| 2024 |
$ | 1,842,340 | $ | — | $ | — | $ | — | $ | — | $ | 50,088 | $ | 1,892,428 | ||||||||||||||
| 2023 |
$ | — | $ | — | $ | — | $ | — | $ | — | $ | — | $ | — | ||||||||||||||
| 2022 |
$ | — | $ | — | $ | — | $ | — | $ | — | $ | — | $ | — | ||||||||||||||
| 2021 |
$ | — | $ | — | $ | — | $ | — | $ | — | $ | — | $ | — | ||||||||||||||
(4) |
The dollar amounts reported represent the average of the amounts reported for our Non-PEO NEOs as a group in the “Total” column of the Summary Compensation Table in each applicable year. |
(5) |
The dollar amounts reported represent the average amount of “compensation actually paid” to our Non-PEO NEOs, as computed in accordance with SEC rules. The dollar amounts do not reflect the actual average amount of compensation earned by or paid to our Non-PEO NEOs during the applicable year. In accordance with the SEC rules, the following adjustments were made to average total compensation for our Non-PEO NEOs for each year to determine the compensation actually paid, using the same methodology described above in Note 3: |
Average Reported Summary Compensation Table Total for Non-PEO NEOs |
Deductions: |
Additions: |
Average Compensation Actually Paid to Non-PEO NEOs |
|||||||||||||
| Year |
Average Reported Value of Equity Awards |
Average Equity Award Adjustments (a) |
||||||||||||||
| 2025 |
$ | 964,689 | $ | 728,547 | $ | 296,299 | $ | 532,441 | ||||||||
| 2024 |
$ | 622,671 | $ | 622,671 | $ | 946,237 | $ | 946,237 | ||||||||
| 2023 |
$ | — | $ | — | $ | — | $ | — | ||||||||
| 2022 |
$ | — | $ | — | $ | — | $ | — | ||||||||
| 2021 |
$ | — | $ | — | $ | 14,892 | $ | 14,892 | ||||||||
| Year |
Year End Fair Value of Current Year Equity Awards that Remain Unvested at Year-End |
Change in Fair Value of Equity Awards Granted in Prior Years that are Unvested at Year-End |
Fair Value as of Vesting Date of Equity Awards Granted and Vested in the Year |
Change in Fair Value of Equity Awards Granted in Prior Years that Vested in the Year |
Fair Value at the End of the Prior Year of Equity Awards that Failed to Meet Vesting Conditions in the Year |
Value of Dividends or other Earnings Paid on Stock or Option Awards not Otherwise Reflected in Fair Value |
Total Average Equity Award Adjustments |
|||||||||||||||||||||
| 2025 |
$ | 372,558 | $ | (155,301 | ) | $ | 42,029 | $ | (17,301 | ) | $ | — | $ | 54,314 | $ | 296,299 | ||||||||||||
| 2024 |
$ | 921,192 | $ | — | $ | — | $ | — | $ | — | $ | 25,045 | $ | 946,237 | ||||||||||||||
| 2023 |
$ | — | $ | — | $ | — | $ | — | $ | — | $ | — | $ | — | ||||||||||||||
| 2022 |
$ | — | $ | — | $ | — | $ | — | $ | — | $ | — | $ | — | ||||||||||||||
| 2021 |
$ | — | $ | — | $ | — | $ | 14,892 | $ | — | $ | — | $ | 14,892 | ||||||||||||||
(6) |
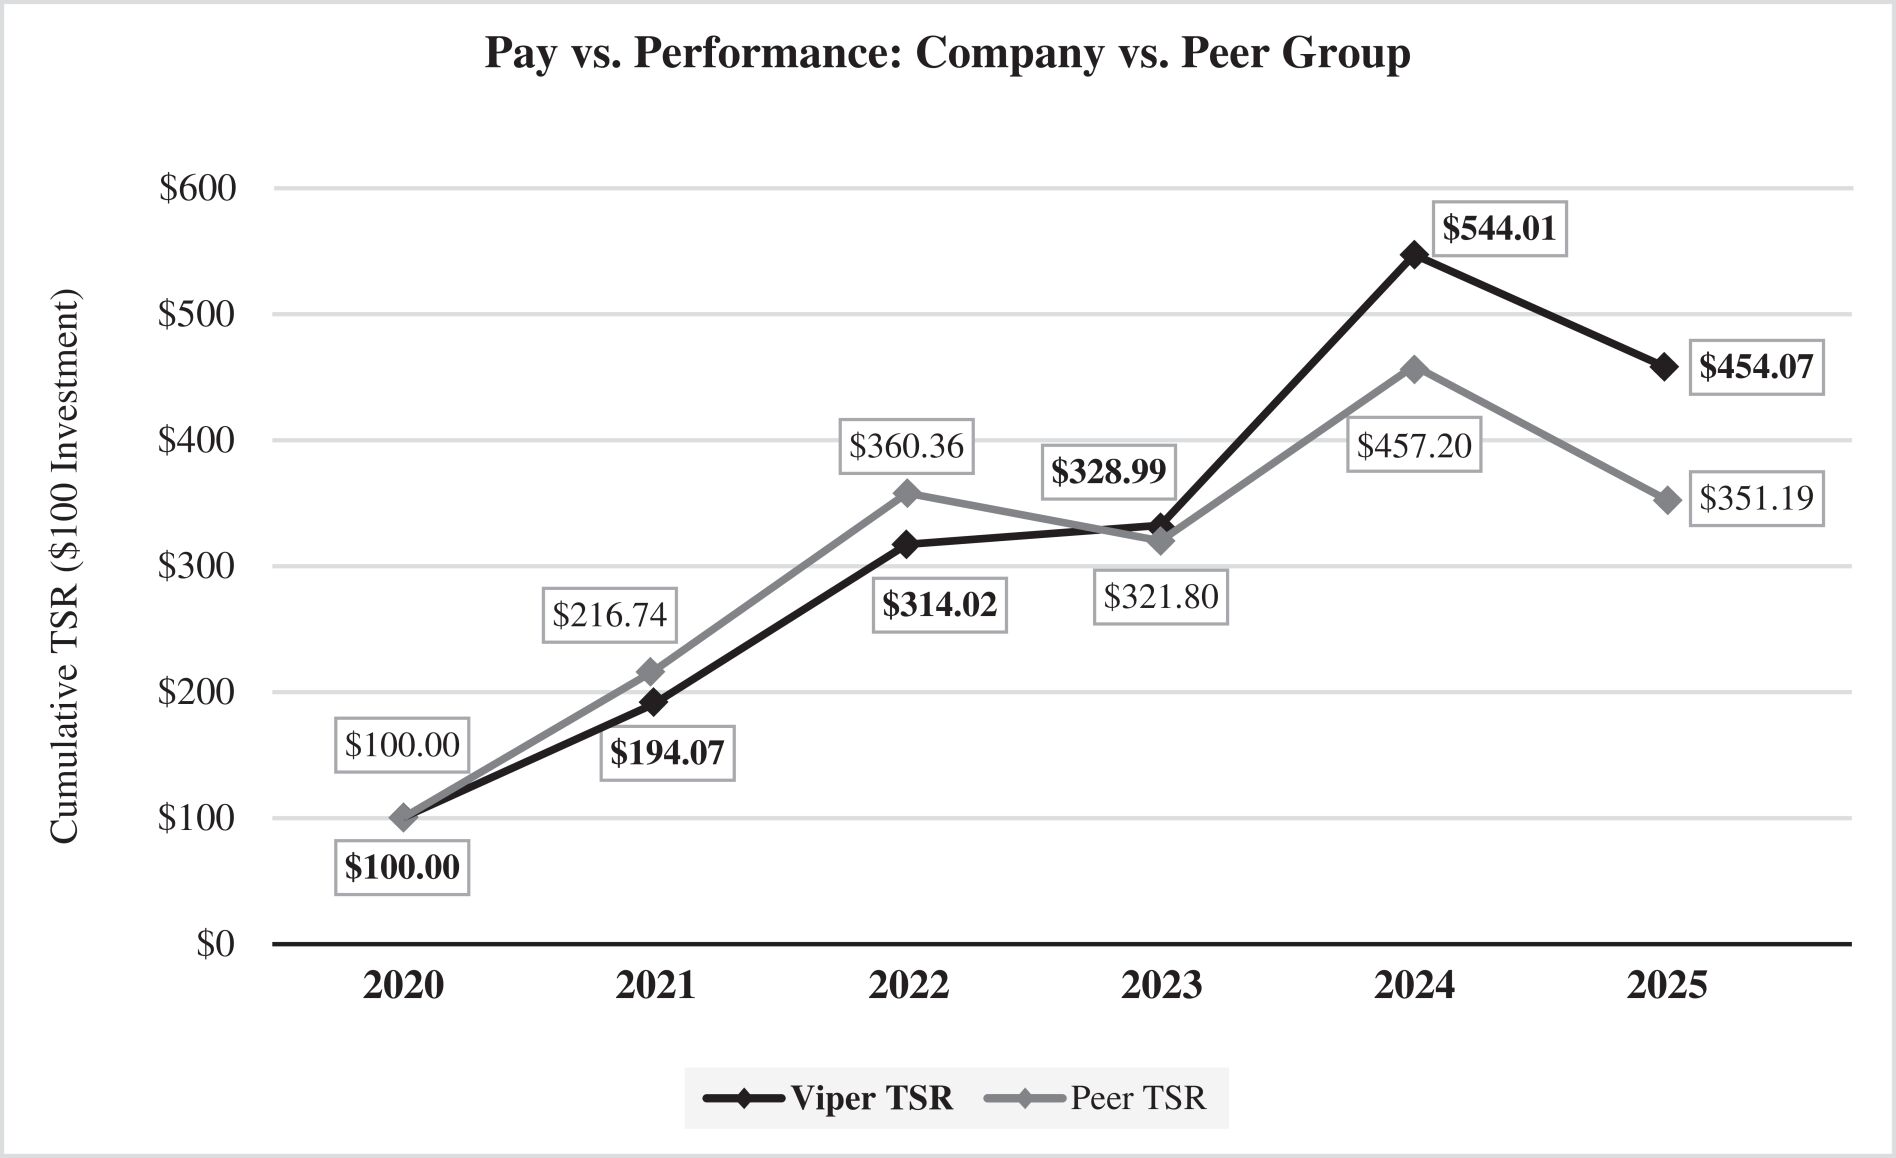
Cumulative TSR is calculated by dividing the sum of the cumulative amount of dividends for the five-year period included in this table, assuming dividend reinvestment, and the difference between the Company’s share price at the end and the beginning of the measurement period by the Company’s share price at the beginning of the measurement period. |
(7) |
Represents the weighted peer group TSR, weighted according to the respective companies’ stock market capitalization at December 31, 2020. The peer group used for this purpose in 2023 represented the TSR of the SPDR S&P Oil & Gas Exploration and Production ETF (“XOP”) based on an initial $100 investment, measured on a cumulative basis from the market close on December 31, 2023, 2022, 2021 and 2020. The XOP was the peer group used by the Company for purposes of Item 201(e) of Regulation S-K under the Exchange Act in Viper’s Annual Report on Form 10-K for the year ended December 31, 2023. The peer group used for this purpose in 2025 and 2024 consists of the following companies: Dorchester Minerals, L.P., Kimbell Royalty Partners LP, Sitio Royalties Corporation, Black Stone Minerals, L.P., Texas Pacific Land Corporation, SM Energy Company, Northern Oil and Gas, Inc., Civitas Resources, Inc., Matador Resources Company, XOP and the Standard & Poor’s 500 Index (SPX). Cumulative TSR is calculated by dividing the sum of the cumulative amount of dividends for the five-year period included in this table, assuming dividend reinvestment, and the difference between the Company’s share price at the end and the beginning of the measurement period by the Company’s share price at the beginning of the measurement period. |
(8) |
The dollar amounts reported represent the amount of net income reflected in the Company’s audited financial statements for the applicable year. |
(1) |
PEO and Non-PEO NEOs included in these columns reflect the following: |
| Year |
PEO |
Non-PEO NEOs | ||
| 2025 |
Current PEO: Kaes Van’t Hof Former PEO: Travis D. Stice |
Teresa L. Dick, Al Barkmann, Austen Gilfillian, Matt Zmigrosky | ||
| 2024 |
Travis D. Stice | Kaes Van’t Hof, Teresa L. Dick, Al Barkmann, Matt Zmigrosky | ||
| 2023 |
Travis D. Stice | Kaes Van’t Hof, Teresa L. Dick, Matt Zmigrosky | ||
| 2022 |
Travis D. Stice | Kaes Van’t Hof, Teresa L. Dick, Matt Zmigrosky | ||
| 2021 |
Travis D. Stice | Kaes Van’t Hof, Teresa L. Dick, Matt Zmigrosky |
(7) |
Represents the weighted peer group TSR, weighted according to the respective companies’ stock market capitalization at December 31, 2020. The peer group used for this purpose in 2023 represented the TSR of the SPDR S&P Oil & Gas Exploration and Production ETF (“XOP”) based on an initial $100 investment, measured on a cumulative basis from the market close on December 31, 2023, 2022, 2021 and 2020. The XOP was the peer group used by the Company for purposes of Item 201(e) of Regulation S-K under the Exchange Act in Viper’s Annual Report on Form 10-K for the year ended December 31, 2023. The peer group used for this purpose in 2025 and 2024 consists of the following companies: Dorchester Minerals, L.P., Kimbell Royalty Partners LP, Sitio Royalties Corporation, Black Stone Minerals, L.P., Texas Pacific Land Corporation, SM Energy Company, Northern Oil and Gas, Inc., Civitas Resources, Inc., Matador Resources Company, XOP and the Standard & Poor’s 500 Index (SPX). Cumulative TSR is calculated by dividing the sum of the cumulative amount of dividends for the five-year period included in this table, assuming dividend reinvestment, and the difference between the Company’s share price at the end and the beginning of the measurement period by the Company’s share price at the beginning of the measurement period. |
(3) |
The dollar amounts reported represent the amount of “compensation actually paid,” as computed in accordance with SEC rules. The dollar amounts do not reflect the actual amount of compensation earned by or paid during the applicable year. In accordance with SEC rules, the following adjustments were made to total compensation to determine the compensation actually paid: |
Reported Summary Compensation Table Total for PEO |
Deductions: |
Additions: |
Compensation Actually Paid to PEO |
|||||||||||||
| Year |
Reported Value of Equity Awards (a) |
Equity Award Adjustments (b) |
||||||||||||||
| Current PEO: |
||||||||||||||||
| 2025 |
$ | 1,825,600 | $ | 1,825,600 | $ | 986,375 | $ | 986,375 | ||||||||
| Former PEO: |
||||||||||||||||
| 2025 |
$ | 68,880 | $ | — | $ | (262,723 | ) | $ | (193,843 | ) | ||||||
| 2024 |
$ | 1,245,313 | $ | 1,245,313 | $ | 1,892,428 | $ | 1,892,428 | ||||||||
| 2023 |
$ | — | $ | — | $ | — | $ | — | ||||||||
| 2022 |
$ | — | $ | — | $ | — | $ | — | ||||||||
| 2021 |
$ | — | $ | — | $ | — | $ | — | ||||||||
(a) |
The grant date fair value of equity awards represents the total of the amounts reported in the “Stock Awards” columns in the Summary Compensation Table for the applicable year. |
(b) |
The equity award adjustments for each applicable year include the addition (or subtraction, as applicable) of the following: (i) the year-end fair value of any equity awards granted in the applicable year that are outstanding and unvested as of the end of the year; (ii) the amount of change as of the end of the applicable year (from the end of the prior fiscal year) in fair value of any awards granted in prior years that are outstanding and unvested as of the end of the applicable year; (iii) for awards that are granted and vest in the same applicable year, the fair value as of the vesting date; (iv) for awards granted in prior years that vest in the applicable year, the amount equal to the change as of the vesting date (from the end of the prior fiscal year) in fair value; (v) for awards granted in prior years that are determined to fail to meet the applicable vesting conditions during the applicable year, a deduction for the amount equal to the fair value at the end of the prior fiscal year; and (vi) the dollar value of any dividends or other earnings paid on stock or option awards in the applicable year prior to the vesting date that are not otherwise reflected in the fair value of such award or included in any other component of total compensation for the applicable year. The valuation assumptions used to calculate fair values did not materially differ from those disclosed at the time of grant. The amounts deducted or added in calculating the equity award adjustments are as follows: |
| Year |
Year End Fair Value of Current Year Equity Awards that Remain Unvested at Year-End |
Change in Fair Value of Equity Awards Granted in Prior Years that are Unvested at Year-End |
Fair Value as of Vesting Date of Equity Awards Granted and Vested in the Year |
Change in Fair Value of Equity Awards Granted in Prior Years that Vested in the Year |
Fair Value at the End of the Prior Year of Equity Awards that Failed to Meet Vesting Conditions in the Year |
Value of Dividends or other Earnings Paid on Stock or Option Awards not Otherwise Reflected in Fair Value |
Total Equity Award Adjustments |
|||||||||||||||||||||
| Current PEO: |
||||||||||||||||||||||||||||
| 2025 |
$ | 1,186,015 | $ | (311,350 | ) | $ | — | $ | — | $ | — | $ | 111,710 | $ | 986,375 | |||||||||||||
| Former PEO: |
||||||||||||||||||||||||||||
| 2025 |
$ | — | $ | (311,350 | ) | $ | — | $ | — | $ | — | $ | 48,627 | $ | (262,723 | ) | ||||||||||||
| 2024 |
$ | 1,842,340 | $ | — | $ | — | $ | — | $ | — | $ | 50,088 | $ | 1,892,428 | ||||||||||||||
| 2023 |
$ | — | $ | — | $ | — | $ | — | $ | — | $ | — | $ | — | ||||||||||||||
| 2022 |
$ | — | $ | — | $ | — | $ | — | $ | — | $ | — | $ | — | ||||||||||||||
| 2021 |
$ | — | $ | — | $ | — | $ | — | $ | — | $ | — | $ | — | ||||||||||||||
(5) |
The dollar amounts reported represent the average amount of “compensation actually paid” to our Non-PEO NEOs, as computed in accordance with SEC rules. The dollar amounts do not reflect the actual average amount of compensation earned by or paid to our Non-PEO NEOs during the applicable year. In accordance with the SEC rules, the following adjustments were made to average total compensation for our Non-PEO NEOs for each year to determine the compensation actually paid, using the same methodology described above in Note 3: |
Average Reported Summary Compensation Table Total for Non-PEO NEOs |
Deductions: |
Additions: |
Average Compensation Actually Paid to Non-PEO NEOs |
|||||||||||||
| Year |
Average Reported Value of Equity Awards |
Average Equity Award Adjustments (a) |
||||||||||||||
| 2025 |
$ | 964,689 | $ | 728,547 | $ | 296,299 | $ | 532,441 | ||||||||
| 2024 |
$ | 622,671 | $ | 622,671 | $ | 946,237 | $ | 946,237 | ||||||||
| 2023 |
$ | — | $ | — | $ | — | $ | — | ||||||||
| 2022 |
$ | — | $ | — | $ | — | $ | — | ||||||||
| 2021 |
$ | — | $ | — | $ | 14,892 | $ | 14,892 | ||||||||
| Year |
Year End Fair Value of Current Year Equity Awards that Remain Unvested at Year-End |
Change in Fair Value of Equity Awards Granted in Prior Years that are Unvested at Year-End |
Fair Value as of Vesting Date of Equity Awards Granted and Vested in the Year |
Change in Fair Value of Equity Awards Granted in Prior Years that Vested in the Year |
Fair Value at the End of the Prior Year of Equity Awards that Failed to Meet Vesting Conditions in the Year |
Value of Dividends or other Earnings Paid on Stock or Option Awards not Otherwise Reflected in Fair Value |
Total Average Equity Award Adjustments |
|||||||||||||||||||||
| 2025 |
$ | 372,558 | $ | (155,301 | ) | $ | 42,029 | $ | (17,301 | ) | $ | — | $ | 54,314 | $ | 296,299 | ||||||||||||
| 2024 |
$ | 921,192 | $ | — | $ | — | $ | — | $ | — | $ | 25,045 | $ | 946,237 | ||||||||||||||
| 2023 |
$ | — | $ | — | $ | — | $ | — | $ | — | $ | — | $ | — | ||||||||||||||
| 2022 |
$ | — | $ | — | $ | — | $ | — | $ | — | $ | — | $ | — | ||||||||||||||
| 2021 |
$ | — | $ | — | $ | — | $ | 14,892 | $ | — | $ | — | $ | 14,892 | ||||||||||||||
Compensation Actually Paid, Cumulative TSR and Peer Group TSR
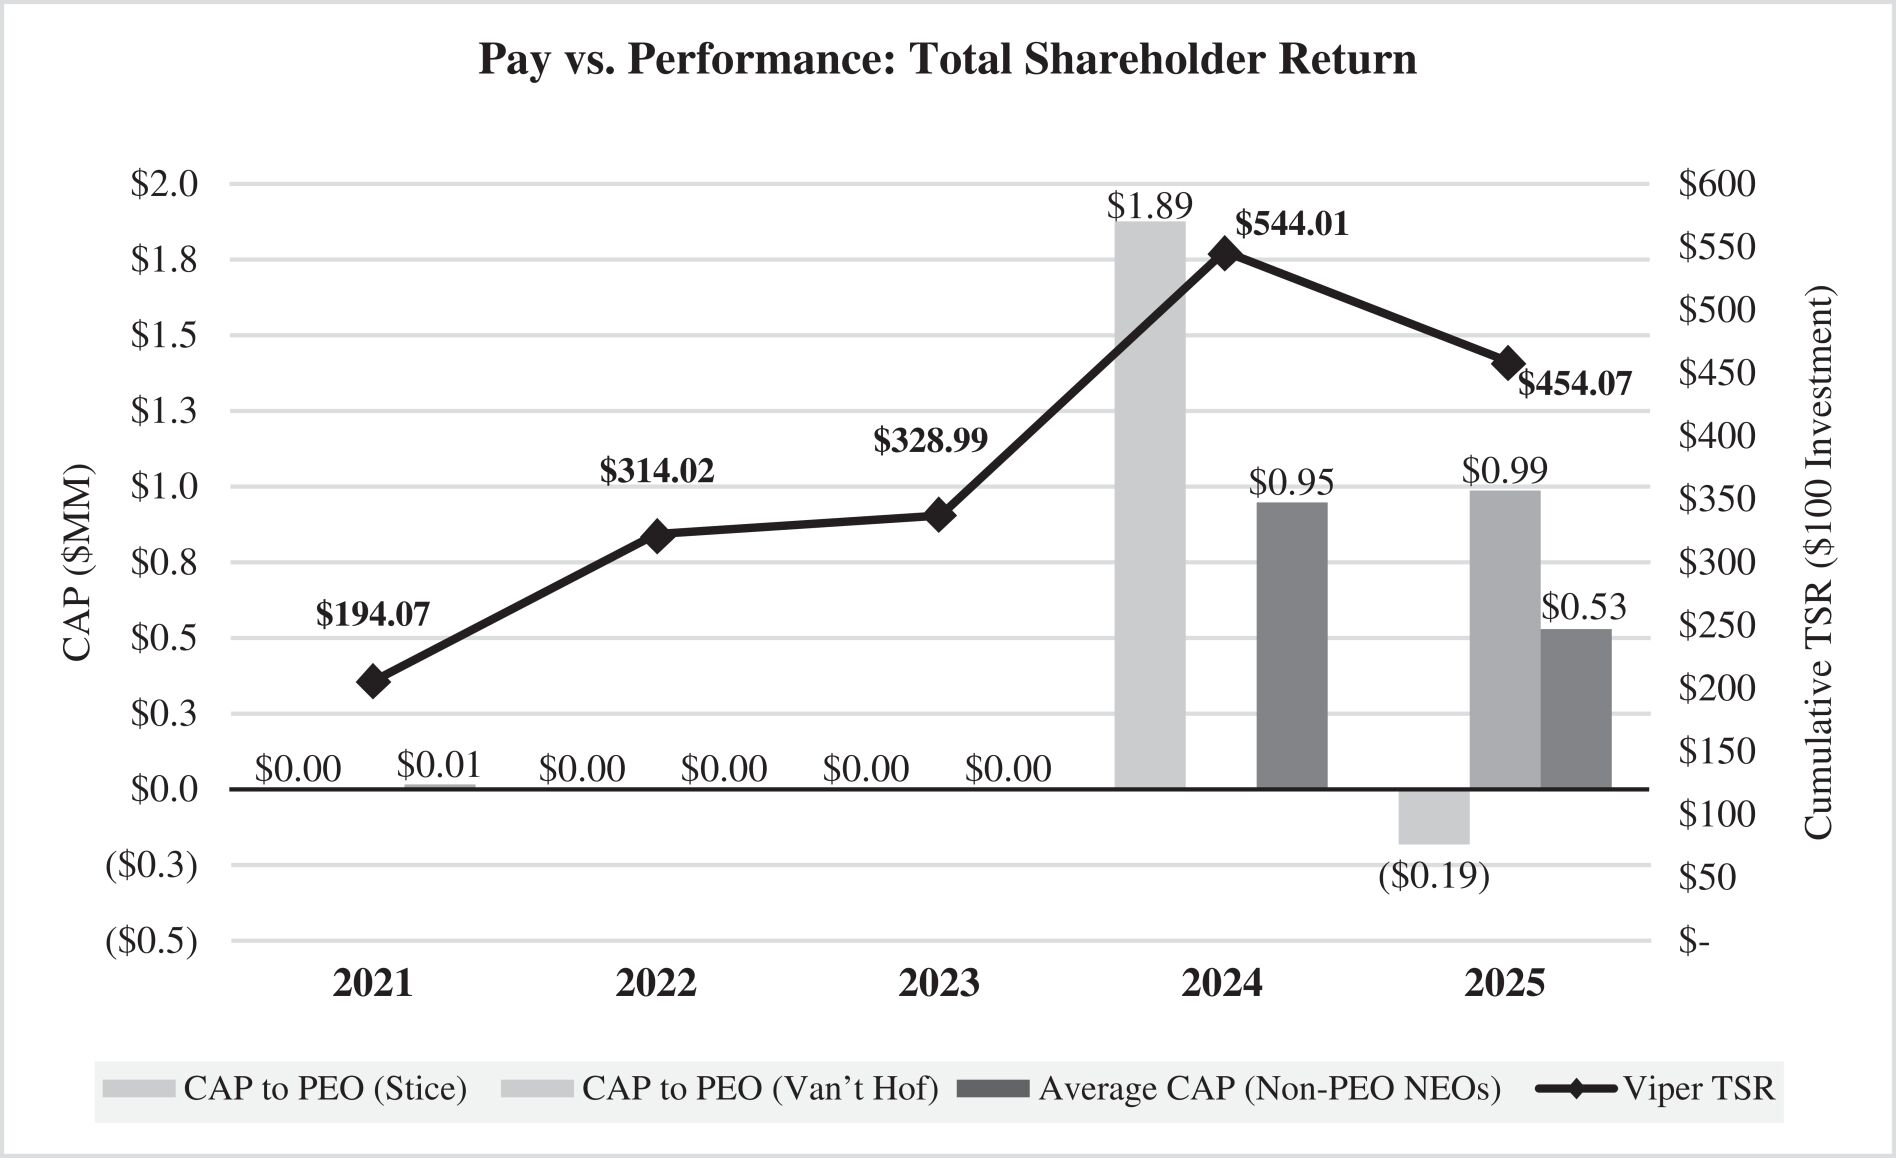
Compensation
Actually
Paid and Net Income 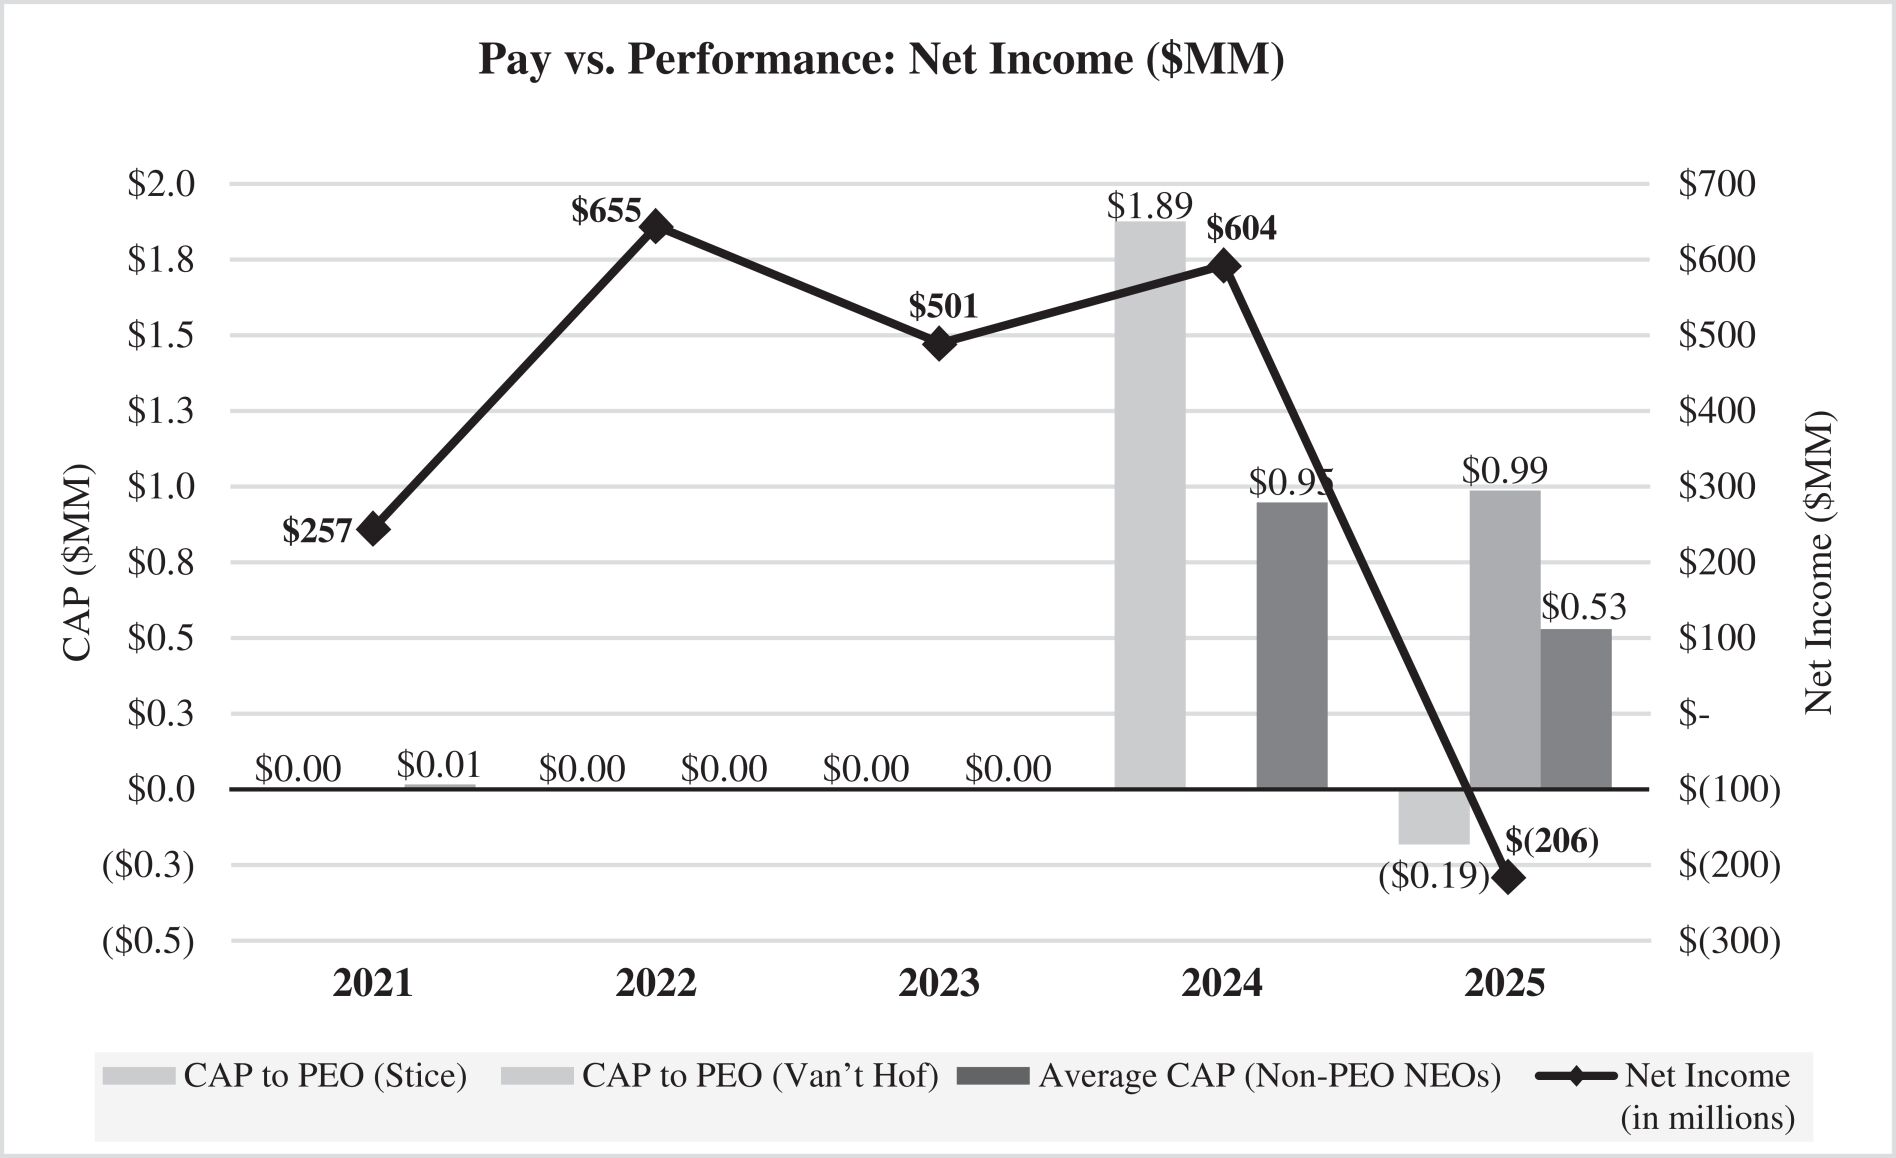
Compensation Actually Paid, Cumulative TSR and Peer Group TSR