Pay Versus Performance
In accordance with a final rule adopted by the SEC in August 2022 implementing Section 953(a) of the Dodd-Frank Wall Street Reform and Consumer Protection Act, we are providing the following table that sets forth certain compensation measures for certain of our officers alongside certain performance metrics for the Company:
|
|
|
|
|
|
|
|
Average |
|
|
|
|
|
|
|
|
|
|
||||||
|
|
|
|
|
|
|
|
Summary |
|
|
Average |
|
|
Value of |
|
|
|
|
||||||
|
|
|
|
|
|
|
|
Compensation |
|
|
Compensation |
|
|
Initial Fixed |
|
|
|
|
||||||
|
|
|
|
|
|
|
|
Table Total |
|
|
Actually Paid |
|
|
$100 Investment |
|
|
|
|
||||||
|
|
Summary |
|
|
Compensation |
|
|
for Non-PEO |
|
|
to Non-PEO |
|
|
Based on |
|
|
|
|
||||||
|
|
Compensation Table |
|
|
Actually Paid |
|
|
Named Executive |
|
|
Named Executive |
|
|
Total Shareholder |
|
|
Net Income |
|
||||||
|
|
Total for PEO(1) |
|
|
to PEO(2) |
|
|
Officers(1) |
|
|
Officers(2) |
|
|
Return(3) |
|
|
(in thousands) |
|
||||||
Year |
|
($) |
|
|
($) |
|
|
($) |
|
|
($) |
|
|
($) |
|
|
($) |
|
||||||
2025 |
|
|
1,118,007 |
|
|
|
1,151,125 |
|
|
|
703,973 |
|
|
|
724,319 |
|
|
|
124.39 |
|
|
|
8,214 |
|
2024 |
|
|
1,033,801 |
|
|
|
1,045,706 |
|
|
|
672,474 |
|
|
|
691,733 |
|
|
|
109.51 |
|
|
|
15,343 |
|
2023 |
|
|
795,222 |
|
|
|
708,845 |
|
|
|
523,749 |
|
|
|
474,812 |
|
|
|
86.68 |
|
|
|
9,357 |
|
___________________
|
|
|
|
|
|
|
|
|
|
|
|
|
|
|
|
|
|
|
Change in Fair |
|
|
|
|
|
|
|
||||||||
|
|
|
|
|
|
|
|
|
|
|
|
|
Change in Fair |
|
|
Fair Value of |
|
|
Value of Stock |
|
|
|
|
|
|
|
||||||||
|
|
|
|
|
|
|
|
|
|
Fair Value of |
|
|
Value of |
|
|
Stock Awards |
|
|
Awards from |
|
|
|
|
|
|
|
||||||||
|
|
|
|
|
|
|
|
|
|
Stock Awards |
|
|
Unvested Stock |
|
|
Granted and |
|
|
Prior Years that |
|
|
Fair Value of |
|
|
|
|
||||||||
|
|
|
|
|
|
|
SCT Stock |
|
|
Granted in the |
|
|
Awards from |
|
|
Vested in the |
|
|
Vested in the |
|
|
Stock Awards |
|
|
Compensation |
|
||||||||
Name |
|
Year |
|
SCT Total |
|
|
Awards |
|
|
Covered Year |
|
|
Prior Years |
|
|
Covered Year |
|
|
Covered Year |
|
|
Forfeited |
|
|
Actually Paid |
|
||||||||
PEO |
|
2025 |
|
$ |
1,118,007 |
|
|
$ |
(222,768 |
) |
|
$ |
243,576 |
|
|
$ |
22,987 |
|
|
$ |
|
|
$ |
(486 |
) |
|
$ |
(10,192 |
) |
|
$ |
1,151,125 |
|
|
NEO |
|
|
|
|
|
|
|
|
|
|
|
|
|
|
|
|
|
|
|
|
|
|
|
|
|
|
||||||||
Average |
|
2025 |
|
|
703,973 |
|
|
|
(129,529 |
) |
|
|
141,628 |
|
|
|
13,262 |
|
|
|
|
|
|
(301 |
) |
|
|
(4,714 |
) |
|
$ |
724,319 |
|
|
|
|
|
|
|
|
|
|
|
|
|
|
|
|
|
|
|
|
|
|
|
|
|
|
|
|
|
||||||||
|
|
|
|
|
|
|
|
|
|
|
|
|
|
|
|
|
|
|
Change in Fair |
|
|
|
|
|
|
|
||||||||
|
|
|
|
|
|
|
|
|
|
|
|
|
Change in Fair |
|
|
Fair Value of |
|
|
Value of Stock |
|
|
|
|
|
|
|
||||||||
|
|
|
|
|
|
|
|
|
|
Fair Value of |
|
|
Value of |
|
|
Stock Awards |
|
|
Awards from |
|
|
|
|
|
|
|
||||||||
|
|
|
|
|
|
|
|
|
|
Stock Awards |
|
|
Unvested Stock |
|
|
Granted and |
|
|
Prior Years that |
|
|
Fair Value of |
|
|
|
|
||||||||
|
|
|
|
|
|
|
SCT Stock |
|
|
Granted in the |
|
|
Awards from |
|
|
Vested in the |
|
|
Vested in the |
|
|
Stock Awards |
|
|
Compensation |
|
||||||||
Name |
|
Year |
|
SCT Total |
|
|
Awards |
|
|
Covered Year |
|
|
Prior Years |
|
|
Covered Year |
|
|
Covered Year |
|
|
Forfeited |
|
|
Actually Paid |
|
||||||||
PEO |
|
2025 |
|
$ |
1,118,007 |
|
|
$ |
(222,768 |
) |
|
$ |
243,576 |
|
|
$ |
22,987 |
|
|
$ |
|
|
$ |
(486 |
) |
|
$ |
(10,192 |
) |
|
$ |
1,151,125 |
|
|
NEO |
|
|
|
|
|
|
|
|
|
|
|
|
|
|
|
|
|
|
|
|
|
|
|
|
|
|
||||||||
Average |
|
2025 |
|
|
703,973 |
|
|
|
(129,529 |
) |
|
|
141,628 |
|
|
|
13,262 |
|
|
|
|
|
|
(301 |
) |
|
|
(4,714 |
) |
|
$ |
724,319 |
|
|
|
|
|
|
|
|
|
|
|
|
|
|
|
|
|
|
|
|
|
|
|
|
|
|
|
|
|
||||||||
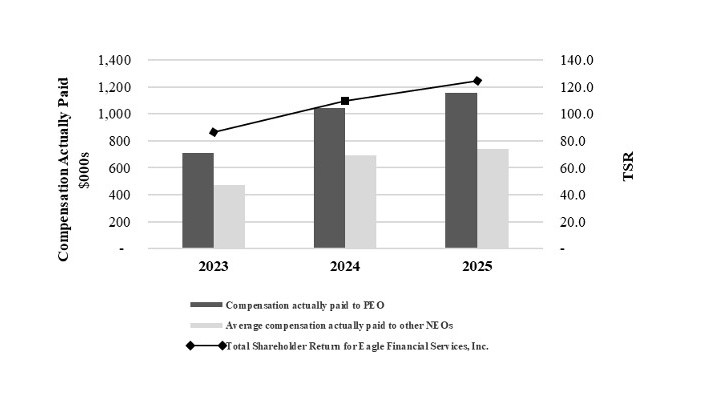
The relationship between (1) compensation actually paid to the PEO and the average compensation actually paid to NEOs other that the PEO and (2) cumulative total shareholder return on the common stock of the Company for the last two completed fiscal years is as shown in Figure 1.
Figure 1: Compensation Actually Paid and Total Shareholder Return (TSR)
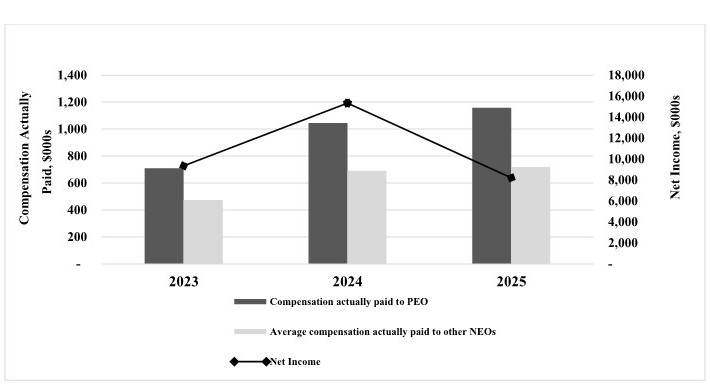
The relationship between (1) compensation actually paid to the PEO and the average compensation actually paid to NEOs other than the PEO and (2) net income of the Company for the last two completed fiscal years is shown in Figure 2.
Figure 2: Compensation Actually Paid and Net Income