Pay vs Performance Disclosure
Jan. 31, 2025
Dec. 31, 2025
Dec. 31, 2025
USD ($)
Rate
Dec. 31, 2024
USD ($)
Rate
Dec. 31, 2023
USD ($)
Rate
Dec. 31, 2022
USD ($)
Rate
Dec. 31, 2021
USD ($)
Rate
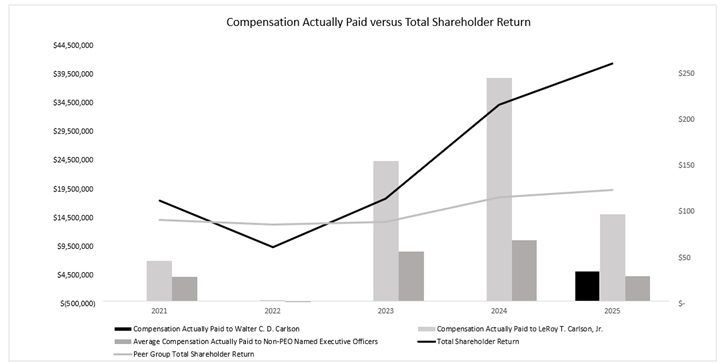
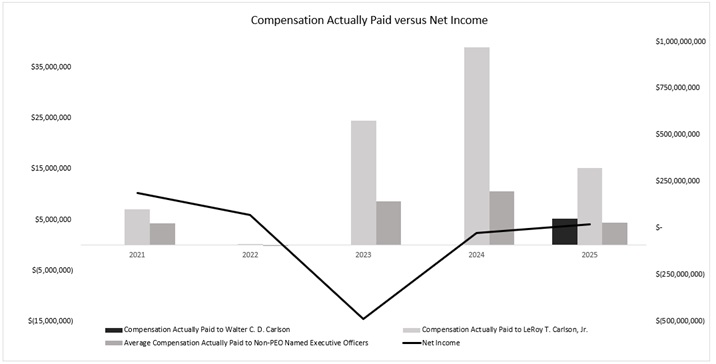
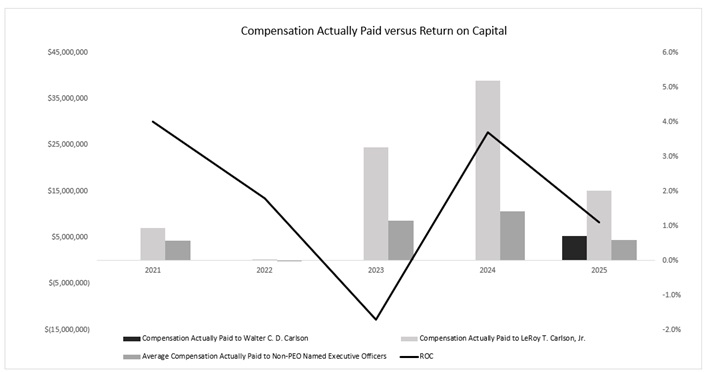
| Summary Compensation Table Total for Walter C. D. Carlson (2) | Compensation Actually Paid to Walter C. D. Carlson (3) | Summary Compensation Table Total for LeRoy T. Carlson, Jr. (2) | Compensation Actually Paid to LeRoy T. Carlson, Jr. (3) | Average Summary Compensation Table Total for Non-PEO Named Executive Officers (2) | Average Compensation Actually Paid to Non-PEO Named Executive Officers (3) | Value of Initial Fixed $100 Investment Based On (4): | Net Income (Loss) | Return on Capital (6) | ||||||||||||||||||||||||
| Year (1) | Total Shareholder Return | Peer Group Total Shareholder Return (5) | ||||||||||||||||||||||||||||||
| ($) | ($) | ($) | ($) | ($) | ($) | ($) | ($) | ($) | (%) | |||||||||||||||||||||||
| 2025 | $4,767,544 | $5,228,137 | $6,974,414 | $15,100,392 | $4,180,994 | $4,418,717 | $260.75 | $123.65 | $20,242,108 | 1.1 | % | |||||||||||||||||||||
| 2024 | N/A | N/A | $9,611,495 | $38,902,395 | $3,900,317 | $10,628,855 | $216.01 | $115.57 | $(26,480,692) | 3.7 | % | |||||||||||||||||||||
| 2023 | N/A | N/A | $9,677,516 | $24,429,347 | $4,434,350 | $8,670,292 | $114.27 | $89.10 | $(487,287,212) | (1.7) | % | |||||||||||||||||||||
| 2022 | N/A | N/A | $8,929,740 | $237,089 | $2,694,344 | $(117,463) | $61.34 | $86.09 | $71,656,249 | 1.8 | % | |||||||||||||||||||||
| 2021 | N/A | N/A | $9,616,139 | $7,034,857 | $3,284,862 | $4,231,000 | $112.09 | $91.34 | $188,119,059 | 4.0 | % | |||||||||||||||||||||
(1)The Principal Executive Officer ("PEO") and NEOs for the applicable years were as follows:
•2025: Walter C. D. Carlson assumed the role of PEO on February 1, 2025, LeRoy T. Carlson, Jr. served as the PEO during 2025 through January 31, 2025. Amounts disclosed in the table above for Walter C. D. Carlson and LeRoy T. Carlson, Jr. includes their total compensation for the full year 2025. The Company's other NEOs for 2025 were: Vicki L. Villacrez, Kenneth S. Dixon, Anthony J. M. Carlson, Joseph R. Hanley, Laurent C. Therivel and James W. Butman.
•2024 and 2023: LeRoy T. Carlson, Jr. served as the Company's PEO for the entirety of 2024 and 2023 and the Company's other NEOs were: Laurent C. Therivel, Vicki L. Villacrez, James W. Butman and Joseph R. Hanley.
•2022: LeRoy T. Carlson, Jr. served as the Company's PEO for the entirety of 2022 and the Company's other NEOs were: Laurent C. Therivel, Vicki L. Villacrez, James W. Butman, Joseph R. Hanley and Peter L. Sereda.
•2021: LeRoy T. Carlson, Jr. served as the Company's PEO for the entirety of 2021 and the Company's other NEOs were: Laurent C. Therivel, James W. Butman, Peter L. Sereda and Kurt B. Thaus.
(2)Amounts reported in this column represent (i) the total compensation reported in the Summary Compensation Table for the applicable year in the case of Walter C. D. Carlson and LeRoy T. Carlson, Jr. and (ii) the average of the total compensation reported in the Summary Compensation Table for the applicable year for our other NEOs reported for the applicable year other than the PEO for such years.
(3)To calculate compensation actually paid, adjustments were made to the amounts reported in the Summary Compensation Table for the applicable year. A reconciliation of the adjustments for Walter C. D. Carlson and LeRoy T. Carlson, Jr., and for the average of the other NEOs is set forth following the footnotes to this table.
(4)Pursuant to rules of the SEC, the comparison assumes $100 was invested on December 31, 2020 in TDS' common stock. Historic stock price performance is not necessarily indicative of future stock price performance.
(5)The TSR Peer Group consists of the component companies of the Dow Jones U.S. Telecommunications Index.
(6)The CHRC uses Return on Capital as our Company selected metric, which is calculated as earnings before interest, adjusted for income tax impacts (which for 2025 used a standardized tax rate due to non-recurring activity related to the Closing), divided by the sum of total debt, right of use lease liabilities, and total equity. This metric was one of the metrics originally applicable to the 2025 PSU awards granted to Walter C. D. Carlson, LeRoy T. Carlson, Jr., Vicki L. Villacrez and Joseph R. Hanley.
Compensation Actually Paid Adjustments (a)| Year | Summary Compensation Table Total | (Minus) Grant Date Fair Value of Awards Granted in Fiscal Year | Plus Fiscal Year-End Fair Value of Outstanding and Unvested Awards Granted in Fiscal Year | Plus/(Minus) Change in Fair Value of Outstanding and Unvested Awards Granted in Prior Fiscal Year | Plus Vesting Date Fair Value of Awards Granted and Vested During Fiscal Year | Plus/(Minus) Change in Fair Value of Awards Granted in Prior Fiscal Years that Vested During Fiscal Year | Equals Compensation Actually Paid | |||||||||||||||||||||||||||||||||||||
| Walter C. D. Carlson | ||||||||||||||||||||||||||||||||||||||||||||
| 2025 | $4,767,544 | $(3,084,325) | $3,460,687 | — | $84,231 | — | $5,228,137 | |||||||||||||||||||||||||||||||||||||
| LeRoy T. Carlson, Jr. | ||||||||||||||||||||||||||||||||||||||||||||
| 2025 | $6,974,414 | $(5,553,040) | $1,474,090 | $7,073,813 | $4,469,288 | $661,827 | $15,100,392 | |||||||||||||||||||||||||||||||||||||
| Other NEO's (Average) | ||||||||||||||||||||||||||||||||||||||||||||
| 2025 | $4,180,994 | $(2,605,726) | $971,745 | $478,480 | $1,550,671 | $(157,447) | $4,418,717 | |||||||||||||||||||||||||||||||||||||
(a)The assumptions used to calculate compensation actually paid are consistent with the methodology used for financial reporting purposes.
•2025: Walter C. D. Carlson assumed the role of PEO on February 1, 2025, LeRoy T. Carlson, Jr. served as the PEO during 2025 through January 31, 2025. Amounts disclosed in the table above for Walter C. D. Carlson and LeRoy T. Carlson, Jr. includes their total compensation for the full year 2025. The Company's other NEOs for 2025 were: Vicki L. Villacrez, Kenneth S. Dixon, Anthony J. M. Carlson, Joseph R. Hanley, Laurent C. Therivel and James W. Butman.
•2024 and 2023: LeRoy T. Carlson, Jr. served as the Company's PEO for the entirety of 2024 and 2023 and the Company's other NEOs were: Laurent C. Therivel, Vicki L. Villacrez, James W. Butman and Joseph R. Hanley.
•2022: LeRoy T. Carlson, Jr. served as the Company's PEO for the entirety of 2022 and the Company's other NEOs were: Laurent C. Therivel, Vicki L. Villacrez, James W. Butman, Joseph R. Hanley and Peter L. Sereda.
•2021: LeRoy T. Carlson, Jr. served as the Company's PEO for the entirety of 2021 and the Company's other NEOs were: Laurent C. Therivel, James W. Butman, Peter L. Sereda and Kurt B. Thaus.
| Year | Summary Compensation Table Total | (Minus) Grant Date Fair Value of Awards Granted in Fiscal Year | Plus Fiscal Year-End Fair Value of Outstanding and Unvested Awards Granted in Fiscal Year | Plus/(Minus) Change in Fair Value of Outstanding and Unvested Awards Granted in Prior Fiscal Year | Plus Vesting Date Fair Value of Awards Granted and Vested During Fiscal Year | Plus/(Minus) Change in Fair Value of Awards Granted in Prior Fiscal Years that Vested During Fiscal Year | Equals Compensation Actually Paid | |||||||||||||||||||||||||||||||||||||
| Walter C. D. Carlson | ||||||||||||||||||||||||||||||||||||||||||||
| 2025 | $4,767,544 | $(3,084,325) | $3,460,687 | — | $84,231 | — | $5,228,137 | |||||||||||||||||||||||||||||||||||||
| LeRoy T. Carlson, Jr. | ||||||||||||||||||||||||||||||||||||||||||||
| 2025 | $6,974,414 | $(5,553,040) | $1,474,090 | $7,073,813 | $4,469,288 | $661,827 | $15,100,392 | |||||||||||||||||||||||||||||||||||||
| Other NEO's (Average) | ||||||||||||||||||||||||||||||||||||||||||||
| 2025 | $4,180,994 | $(2,605,726) | $971,745 | $478,480 | $1,550,671 | $(157,447) | $4,418,717 | |||||||||||||||||||||||||||||||||||||
(a)The assumptions used to calculate compensation actually paid are consistent with the methodology used for financial reporting purposes.
The following is a list of financial performance measures, which in the Company's assessment represent the most important financial performance measures used by the Company to link compensation actually paid to the NEOs for 2025. Please see the Compensation Discussion & Analysis for further information regarding these measures and how they were used in the 2025 executive compensation program, including the Officer Annual Incentive Plan and the 2025 performance share units.
•Return on Capital
•Total Operating Revenues
•Adjusted EBITDA