Pay Versus Performance
The following table sets forth information concerning the compensation of our Principal Executive Officer (“PEO”) and our Non-PEO NEOs for each of the fiscal years ended December 31, 2025, 2024, 2023, 2022 and 2021 and our financial performance for each such fiscal year:
| Value
of Initial Fixed $100 Investment Based on: |
||||||||||||||||
| Year | Summary
Compensation Table Total for PEO ($) |
Compensation
Actually Paid to PEO ($)(1) |
Average Summary
Compensation Table Total for Non-PEO NEOs ($) |
Average
Compensation Actually Paid to Non-PEO NEOs ($)(1) |
Total
Shareholder Return ($) |
Peer
Group Total Shareholder Return($)(2) |
Net
Income ($) |
Adjusted
FFO per Diluted Share ($) (3) | ||||||||
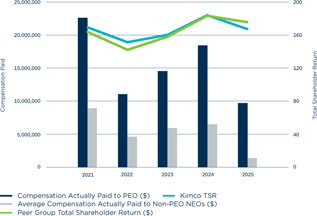
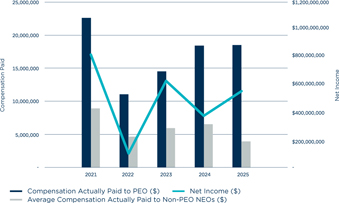
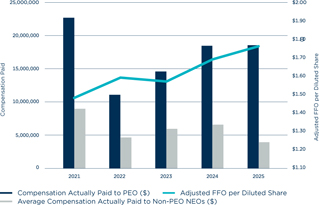
| 2025 | 11,581,750 | 9,726,025 | 3,059,387 | 1,384,886 | 167 | 176 | 554,400,000 | 1.76 | ||||||||
| 2024 | 10,929,025 | 18,436,421 | 3,919,879 | 6,537,627 | 184 | 184 | 375,700,000 | 1.69 | ||||||||
| 2023 | 13,951,194 | 14,553,428 | 5,382,158 | 5,948,179 | 160 | 158 | 629,300,000 | 1.57 | ||||||||
| 2022 | 11,630,048 | 11,071,076 | 4,781,665 | 4,643,754 | 151 | 142 | 100,800,000 | 1.59 | ||||||||
| 2021 | 10,488,138 | 22,641,017 | 3,950,332 | 8,927,274 | 169 | 164 | 818,600,000 | 1.48 | ||||||||
(1) Compensation Actually Paid (“CAP”) is a required SEC disclosure metric and does not represent the actual cash or total compensation our executives received for the year.
| Year | PEO | Non-PEO NEOs |
| 2025 | Conor Flynn | Milton Cooper, Ross Cooper, Glenn Cohen, David Jamieson |
| 2024 | Conor Flynn | Milton Cooper, Ross Cooper, Glenn Cohen, David Jamieson |
| 2023 | Conor Flynn | Milton Cooper, Ross Cooper, Glenn Cohen, David Jamieson |
| 2022 | Conor Flynn | Milton Cooper, Ross Cooper, Glenn Cohen, David Jamieson |
| 2021 | Conor Flynn | Milton Cooper, Ross Cooper, Glenn Cohen, David Jamieson |
CAP starts with the Summary Compensation Table (“SCT”) total and is then adjusted to reflect, among other things, changes in the fair value of unvested equity awards during the year, as required by Item 402(v) of Regulation S-K. These adjustments (described below) include deducting the grant date values shown in the SCT and replacing them with updated fair value measurements for awards that vested or remained outstanding during the year. The fair value of performance-based awards reflects the market value as reported in the Outstanding Equity Awards table. As a result, CAP may be higher or lower than the compensation actually realized by our executives.
| Adjustments for the applicable fiscal year, as adjusted are as follows: | ||
| Adjustments | PEO | Average
Non-PEO NEOs |
| Deduction for Amounts Reported under “Stock Awards” and “Option Awards” Columns in the Summary Compensation Table for Applicable FY | $(7,080,401) | $(1,468,720) |
| Increase based on ASC 718 Fair Value of Awards Granted during Applicable FY that Remain Unvested as of Applicable FY End, determined as of Applicable FY End | $15,762,560 | $2,928,255 |
| Increase based on ASC 718 Fair Value of Awards Granted during Applicable FY that Vested during Applicable FY, determined as of Vesting Date | ||
| Increase/deduction for Awards Granted during Prior FY that were Outstanding and Unvested as of Applicable FY End, determined based on change in ASC 718 Fair Value from Prior FY End to Applicable FY End | $(2,612,299) | $(1,058,488) |
| Increase/deduction for Awards Granted during Prior FY that Vested During Applicable FY, determined based on change in ASC 718 Fair Value from Prior FY End to Vesting Date | $601,665 | $203,220 |
| Deduction of ASC 718 Fair Value of Awards Granted during Prior FY that were Forfeited during Applicable FY, determined as of Prior FY End | $(8,799,839) | $(2,530,089) |
| Increase based on Dividends or Other Earnings Paid during Applicable FY prior to Vesting Date | $272,589 | $251,321 |
| Increase based on Incremental Fair Value of Options/SARs Modified during Applicable FY | ||
| Deduction for Change in the Actuarial Present Values reported under the “Change in Pension Value and Nonqualified Deferred Compensation Earnings” Column of the Summary Compensation Table for Applicable FY | ||
| Increase for Service Cost and, if applicable, Prior Service Cost for Pension Plans | ||
| TOTAL ADJUSTMENTS | $(1,855,725) | $(1,674,501) |
Kimco TSR ($) and Peer Group TSR ($)
Net Income ($)
Adjusted FFO per Diluted Share
Pay Versus Performance Tabular List
We believe the following performance measures represent the most important financial performance measures used by us to link compensation actually paid to our NEOs for the fiscal year ended December 31, 2025:
| • | Peer Group TSR over a three-year performance period; |
| • | Adjusted FFO per diluted share; |
| • | EBITDA; and |
| • | Leverage |
For additional details regarding our most important financial performance measures, please see the sections titled “Annual Incentive Plan” and “Long-Term Incentives — Performance Shares” in our CD&A elsewhere in this Proxy Statement.