Average | ||||||||||||||||||||||||||||||||||||
Summary | Summary | Summary | Average | Value of Initial Fixed $100 | ||||||||||||||||||||||||||||||||
Compensation | Compensation | Summary | Compensation | Compensation | Investment Based on: | Diluted FAD, | ||||||||||||||||||||||||||||||
Table | Compensation | Table | Compensation | Compensation | Compensation | Table | Actually | Company | Peer Group(7) | Excluding | ||||||||||||||||||||||||||
Total for | Actually Paid | Total for | Actually Paid | Table Total for | Actually Paid | Total for | Paid to | Total | Total | Non-recurring | ||||||||||||||||||||||||||
PEO | PEO(1) | PEO | PEO(2) | PEO | PEO(3) | Non-PEO | Non-PEO | Stockholder | Stockholder | Items, | ||||||||||||||||||||||||||
Year | | Ms. Simpson | | Ms. Simpson | | Ms. Shelley-Kessler | | Ms. Shelley-Kessler | | Mr. Malin | | Mr. Malin | | NEO(4) | | NEO(5) | | Return(6) | | Return(6) | | Net Income | | per Share | ||||||||||||
2025 | $ | — | $ | — | $ | 4,027,538 | $ | 4,167,013 | $ | 4,026,725 | $ | 4,166,200 | $ | 1,322,262 | $ | 1,446,960 | $ | 121.66 | $ | 137.83 | $ | 123,880,000 | $ | 2.87 | ||||||||||||
2024 | — | — | 2,682,850 | 4,315,777 | 2,682,850 | 4,315,777 | 3,197,314 | 5,139,072 | 114.59 | 133.97 | 94,879,000 | 2.67 | ||||||||||||||||||||||||
2023 | 5,079,210 |
| 3,131,321 | — |
| — | — |
| — |
| 2,569,201 |
| 1,615,697 |
| 99.70 |
| 123.21 |
| 91,462,000 | 2.75 | ||||||||||||||||
2022 |
| 4,512,891 |
| 3,991,312 |
| — |
| — |
| — |
| — |
| 2,276,362 |
| 2,018,260 |
| 103.05 |
| 108.34 |
| 100,584,000 | 2.68 | |||||||||||||
2021 |
| 4,076,679 | 2,432,064 |
| — | — |
| — | — | 2,076,016 | 1,308,918 | 93.23 | 143.24 | 56,224,000 | 2.43 | |||||||||||||||||||||
| (1) | On December 31, 2024, we completed our long-term management succession plan as Ms. Simpson became our Executive Chairman. Therefore, she was not our PEO for 2024 despite having served as our CEO for the year. There were no special compensation actions taken in 2024 to recognize this transition and thus her compensation amounts in 2024 were near the median for a CEO in our peer group yet are included in the computation of compensation paid to non-PEO NEOs. The calculation of “compensation actually paid” to PEO Ms. Simpson reflects the following adjustments: |
Fiscal Year | Fiscal Year | Fiscal Year | Fiscal Year | Fiscal Year | |||||||||||
| 2025 | | 2024 | | 2023 | | 2022 | | 2021 | ||||||
Summary Compensation Table Total | $ | — | $ | — | $ | 5,079,210 | $ | 4,512,891 | $ | 4,076,679 | |||||
Less: Grant Date Fair Value of Stock Awards in Fiscal Year | — | — | (2,950,000) | (2,500,000) | (2,500,000) | ||||||||||
Fair Value of Equity Awards Granted During the Year and Unvested at Year End | — | — | 2,124,068 | 2,592,074 | 1,879,475 | ||||||||||
Change in Fair Value of Equity Awards Granted in Prior Years and Unvested at Year End | — | — | (1,173,194) | (610,633) | (1,615,636) | ||||||||||
Change in Fair Value of Equity Awards Granted in Prior Years and Vested During the Year | — | — | 51,237 | (3,020) | 591,546 | ||||||||||
Compensation Actually Paid | $ | — | $ | — | $ | 3,131,321 | $ | 3,991,312 | $ | 2,432,064 | |||||
| (2) | On December 31, 2024, we completed our long-term management succession plan as Ms. Shelley-Kessler was promoted to the Co-CEO position. Therefore, she was one of our PEOs for fiscal year 2024, despite having served as our Co-President and Chief Financial Officer for the year. There were no special compensation actions taken in 2024 to recognize this transition and thus her compensation amounts in 2024 were below the median for a CEO in our peer group. The calculation of “compensation actually paid” to PEO Ms. Shelley-Kessler reflects the following adjustments: |
Fiscal Year | Fiscal Year | ||||||
| 2025 | | 2024 | | |||
Summary Compensation Table Total | $ | 4,027,538 | $ | 2,682,850 | |||
Less: Grant Date Fair Value of Stock Awards in Fiscal Year | (2,250,000) | (1,500,000) | |||||
Fair Value of Equity Awards Granted During the Year and Unvested at Year End | 2,183,133 | 1,856,047 | |||||
Change in Fair Value of Equity Awards Granted in Prior Years and Unvested at Year End | 128,585 | 1,222,311 | |||||
Change in Fair Value of Equity Awards Granted in Prior Years and Vested During the Year | 77,757 | 54,569 | |||||
Compensation Actually Paid | $ | 4,167,013 | $ | 4,315,777 | |||
| (3) | On December 31, 2024, we completed our long-term management succession plan as Mr. Malin was promoted to the Co-CEO position. Therefore, he was one of our PEOs for fiscal year 2024, despite having served as our Co-President and Chief Investment Officer for the year. There were no special compensation actions taken in 2024 to recognize this transition and thus his compensation amounts in 2024 were below the median for a CEO in our peer group. The calculation of “compensation actually paid” to PEO Mr. Malin reflects the following adjustments: |
Fiscal Year | Fiscal Year | ||||||
| 2025 | | 2024 | | |||
Summary Compensation Table Total | $ | 4,026,725 | $ | 2,682,850 | |||
Less: Grant Date Fair Value of Stock Awards in Fiscal Year | (2,250,000) | (1,500,000) | |||||
Fair Value of Equity Awards Granted During the Year and Unvested at Year End | 2,183,133 | 1,856,047 | |||||
Change in Fair Value of Equity Awards Granted in Prior Years and Unvested at Year End | 128,585 | 1,222,311 | |||||
Change in Fair Value of Equity Awards Granted in Prior Years and Vested During the Year | 77,757 | 54,569 | |||||
Compensation Actually Paid | $ | 4,166,200 | $ | 4,315,777 | |||
| (4) | For fiscal year 2025, Ms. Simpson, Ms. Chikhale, Mr. Boitano and Mr. Satterwhite are included as the non-PEO NEOs. For fiscal year 2024, Ms. Simpson and Ms. Chikhale are included as the non-PEO NEOs. For fiscal years 2021 through 2023, Ms. Shelley-Kessler and Mr. Malin are included as the non-PEO NEOs. |
| (5) | The calculation of average “compensation actually paid” to Non-PEO NEOs reflects the following adjustments: |
Fiscal Year | Fiscal Year | Fiscal Year | Fiscal Year | Fiscal Year | |||||||||||
| 2025 | | 2024 | | 2023 | | 2022 | | 2021 | ||||||
Summary Compensation Table Total | $ | 1,322,262 | $ | 3,197,314 | $ | 2,569,201 | $ | 2,276,362 | $ | 2,076,016 | |||||
Less: Grant Date Fair Value of Stock Awards in Fiscal Year | (400,000) | (1,765,000) | (1,450,000) | (1,220,000) | (1,220,000) | ||||||||||
Fair Value of Equity Awards Granted During the Year and Unvested at Year End | 390,366 | 2,181,712 | 1,044,019 | 1,264,936 | 917,177 | ||||||||||
Change in Fair Value of Equity Awards Granted in Prior Years and Unvested at Year End | 83,596 | 1,455,888 | (572,520) | (301,523) | (848,551) | ||||||||||
Change in Fair Value of Equity Awards Granted in Prior Years and Vested During the Year | 50,736 | 69,158 | 24,997 | (1,515) | 384,276 | ||||||||||
Compensation Actually Paid | $ | 1,446,960 | $ | 5,139,072 | $ | 1,615,697 | $ | 2,018,260 | $ | 1,308,918 | |||||
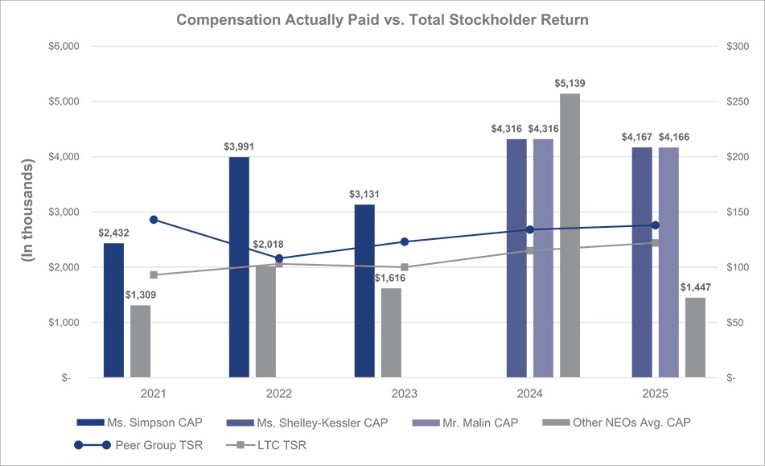
| (6) | TSR assumes $100 was invested on December 31, 2021 in our common stock and assumes the reinvestment of dividends. |
| (7) | The peer group constitutes the National Association of Real Estate Investment Trusts (“NAREIT”) Equity Index. |
| (4) | For fiscal year 2025, Ms. Simpson, Ms. Chikhale, Mr. Boitano and Mr. Satterwhite are included as the non-PEO NEOs. For fiscal year 2024, Ms. Simpson and Ms. Chikhale are included as the non-PEO NEOs. For fiscal years 2021 through 2023, Ms. Shelley-Kessler and Mr. Malin are included as the non-PEO NEOs. |
| (7) | The peer group constitutes the National Association of Real Estate Investment Trusts (“NAREIT”) Equity Index. |
| (1) | On December 31, 2024, we completed our long-term management succession plan as Ms. Simpson became our Executive Chairman. Therefore, she was not our PEO for 2024 despite having served as our CEO for the year. There were no special compensation actions taken in 2024 to recognize this transition and thus her compensation amounts in 2024 were near the median for a CEO in our peer group yet are included in the computation of compensation paid to non-PEO NEOs. The calculation of “compensation actually paid” to PEO Ms. Simpson reflects the following adjustments: |
Fiscal Year | Fiscal Year | Fiscal Year | Fiscal Year | Fiscal Year | |||||||||||
| 2025 | | 2024 | | 2023 | | 2022 | | 2021 | ||||||
Summary Compensation Table Total | $ | — | $ | — | $ | 5,079,210 | $ | 4,512,891 | $ | 4,076,679 | |||||
Less: Grant Date Fair Value of Stock Awards in Fiscal Year | — | — | (2,950,000) | (2,500,000) | (2,500,000) | ||||||||||
Fair Value of Equity Awards Granted During the Year and Unvested at Year End | — | — | 2,124,068 | 2,592,074 | 1,879,475 | ||||||||||
Change in Fair Value of Equity Awards Granted in Prior Years and Unvested at Year End | — | — | (1,173,194) | (610,633) | (1,615,636) | ||||||||||
Change in Fair Value of Equity Awards Granted in Prior Years and Vested During the Year | — | — | 51,237 | (3,020) | 591,546 | ||||||||||
Compensation Actually Paid | $ | — | $ | — | $ | 3,131,321 | $ | 3,991,312 | $ | 2,432,064 | |||||
| (2) | On December 31, 2024, we completed our long-term management succession plan as Ms. Shelley-Kessler was promoted to the Co-CEO position. Therefore, she was one of our PEOs for fiscal year 2024, despite having served as our Co-President and Chief Financial Officer for the year. There were no special compensation actions taken in 2024 to recognize this transition and thus her compensation amounts in 2024 were below the median for a CEO in our peer group. The calculation of “compensation actually paid” to PEO Ms. Shelley-Kessler reflects the following adjustments: |
Fiscal Year | Fiscal Year | ||||||
| 2025 | | 2024 | | |||
Summary Compensation Table Total | $ | 4,027,538 | $ | 2,682,850 | |||
Less: Grant Date Fair Value of Stock Awards in Fiscal Year | (2,250,000) | (1,500,000) | |||||
Fair Value of Equity Awards Granted During the Year and Unvested at Year End | 2,183,133 | 1,856,047 | |||||
Change in Fair Value of Equity Awards Granted in Prior Years and Unvested at Year End | 128,585 | 1,222,311 | |||||
Change in Fair Value of Equity Awards Granted in Prior Years and Vested During the Year | 77,757 | 54,569 | |||||
Compensation Actually Paid | $ | 4,167,013 | $ | 4,315,777 | |||
| (3) | On December 31, 2024, we completed our long-term management succession plan as Mr. Malin was promoted to the Co-CEO position. Therefore, he was one of our PEOs for fiscal year 2024, despite having served as our Co-President and Chief Investment Officer for the year. There were no special compensation actions taken in 2024 to recognize this transition and thus his compensation amounts in 2024 were below the median for a CEO in our peer group. The calculation of “compensation actually paid” to PEO Mr. Malin reflects the following adjustments: |
Fiscal Year | Fiscal Year | ||||||
| 2025 | | 2024 | | |||
Summary Compensation Table Total | $ | 4,026,725 | $ | 2,682,850 | |||
Less: Grant Date Fair Value of Stock Awards in Fiscal Year | (2,250,000) | (1,500,000) | |||||
Fair Value of Equity Awards Granted During the Year and Unvested at Year End | 2,183,133 | 1,856,047 | |||||
Change in Fair Value of Equity Awards Granted in Prior Years and Unvested at Year End | 128,585 | 1,222,311 | |||||
Change in Fair Value of Equity Awards Granted in Prior Years and Vested During the Year | 77,757 | 54,569 | |||||
Compensation Actually Paid | $ | 4,166,200 | $ | 4,315,777 | |||
| (5) | The calculation of average “compensation actually paid” to Non-PEO NEOs reflects the following adjustments: |
Fiscal Year | Fiscal Year | Fiscal Year | Fiscal Year | Fiscal Year | |||||||||||
| 2025 | | 2024 | | 2023 | | 2022 | | 2021 | ||||||
Summary Compensation Table Total | $ | 1,322,262 | $ | 3,197,314 | $ | 2,569,201 | $ | 2,276,362 | $ | 2,076,016 | |||||
Less: Grant Date Fair Value of Stock Awards in Fiscal Year | (400,000) | (1,765,000) | (1,450,000) | (1,220,000) | (1,220,000) | ||||||||||
Fair Value of Equity Awards Granted During the Year and Unvested at Year End | 390,366 | 2,181,712 | 1,044,019 | 1,264,936 | 917,177 | ||||||||||
Change in Fair Value of Equity Awards Granted in Prior Years and Unvested at Year End | 83,596 | 1,455,888 | (572,520) | (301,523) | (848,551) | ||||||||||
Change in Fair Value of Equity Awards Granted in Prior Years and Vested During the Year | 50,736 | 69,158 | 24,997 | (1,515) | 384,276 | ||||||||||
Compensation Actually Paid | $ | 1,446,960 | $ | 5,139,072 | $ | 1,615,697 | $ | 2,018,260 | $ | 1,308,918 | |||||
Financial Performance Measures
As further described and defined in the “Executive Compensation Discussion and Analysis” above, the following is an unranked list of financial performance measures that we considered most important in linking the “compensation actually paid” to our NEOs for 2025 with our performance.
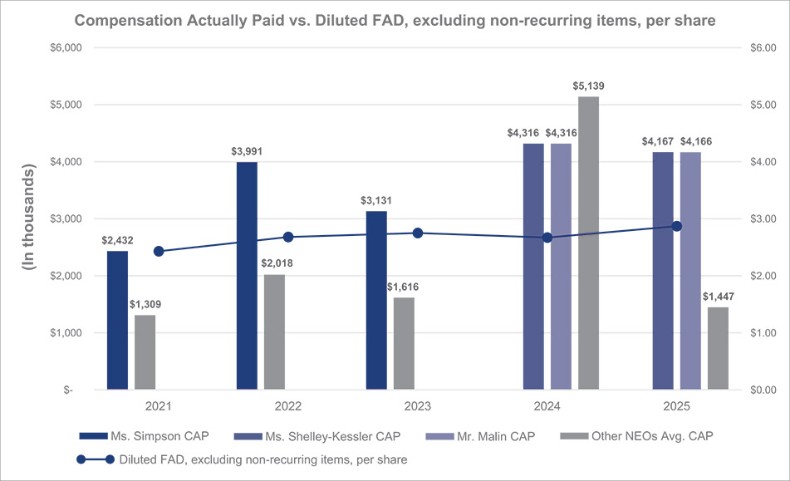
| ◆ | Diluted Core FFO per share |
| ◆ | Diluted Core FAD per share |
| ◆ | Adjusted FAD per share |
| ◆ | Return on Equity |
| ◆ | Cumulative TSR |
In addition to the financial performance measures listed above, we view our stock price, upon which the value of all of our long-term incentive awards is dependent, as a key performance-based component of our executive compensation program in order to further align the interests of our senior management team with the interests of our stockholders.