v3.26.1
Pay vs Performance Disclosure - USD ($)
12 Months Ended
Dec. 31, 2025
Dec. 31, 2024
Dec. 31, 2023
Dec. 31, 2022
Dec. 31, 2021
Pay vs Performance Disclosure          
Pay vs Performance Disclosure, Table

2025 Pay versus Performance

The following table sets forth the compensation for our Chief Executive Officer and the average compensation for our other named executive officers, both as reported in the Summary Compensation Table and with certain adjustments to reflect the “compensation actually paid” to such individuals, as defined under SEC rules, for each of 2025, 2024, 2023, 2022 and 2021. The table also provides information on our cumulative TSR, the cumulative TSR of our 2025 Peer Group, Net Income and Adjusted Consolidated EBITDA over such years in accordance with SEC rules.


PAY VERSUS PERFORMANCE TABLE


AVERAGE
SUMMARY
COMPENSATION
TABLE TOTAL FOR


AVERAGE
COMPENSATION
ACTUALLY
PAID TO


VALUE OF INITIAL FIXED $100
INVESTMENT BASED ON:


YEAR
(A)
(1)


SUMMARY
COMPENSATION
TABLE TOTAL FOR
PEO
(B)


COMPENSATION
ACTUALLY
PAID TO
PEO
(C)
(3)


NON-PEO
NAMED
EXECUTIVE
OFFICERS
(D)


NON-PEO
NAMED
EXECUTIVE
OFFICERS
(E)
(3)


TOTAL
SHAREHOLDER
RETURN
(F)
(4)


PEER GROUP
TOTAL
SHAREHOLDER
RETURN
(G)
(4)


NET INCOME
(H)
(5)


ADJUSTED
CONSOLIDATED
EBITDA

(I)
(6)


2025


25,007,664


52,568,379


11,335,760


23,635,188


128.08


221.73


$798.7 million


$2,462.3 million


2024


25,870,693


32,403,858


11,694,066


15,046,583


109.69


176.05


$761.7 million


$2,281.0 million


2023


20,098,164


18,813,540


9,685,286


9,263,980


87.22


140.53


$608.6 million


$2,107.7 million


2022 (2)


12,810,392


(19,755,647

)


5,421,332


(8,792,406

)


73.17


102.01


$649.0 million


$2,006.1 million


2021


22,981,889


28,938,956


9,169,220


8,831,721


113.74


130.41


$800.6 million


$2,064.8 million


(1)
For each of the years presented above, William Stone was our Principal Executive Officer (PEO). Average compensation for non-PEO named executive officers includes the following individuals: (i) for 2025 and 2024, Rahul Kanwar, Brian Schell, and Jason White , (ii) for 2023, Rahul Kanwar, Brian Schell, Patrick Pedonti and Jason White, (iii) for 2022, Rahul Kanwar, Patrick Pedonti and Jason White; and (iv) for 2021, Rahul Kanwar, Patrick Pedonti, Jason White and Joseph Frank.
(2)
Due to the redesign of our executive compensation program during 2022, the compensation mix for our NEOs did not reflect a normalized allocation of compensation elements. The only long-term equity incentives granted to our NEOs in 2022 were PSUs granted in respect of bonuses earned for the 2021 fiscal year. We did not otherwise grant annual equity incentives during 2022 to our NEOs. Accordingly, the amounts reported in the Summary Compensation Table for 2022 did not reflect our normalized go-forward annual compensation mix for our NEOs.
(3)
Compensation “actually paid” for the PEO and average compensation “actually paid” for our non-PEOs in each of 2025, 2024, 2023, 2022 and 2021 reflects the respective amounts set forth in columns (b) and (d) of the table above, adjusted as set forth in the table below, as determined in accordance with SEC rules. The dollar amounts reflected in columns (b) and (d) of the table above do not reflect the actual amount of compensation earned by or paid to the PEO and our other NEOs during the applicable year. For information regarding the decisions made by the Compensation Committee in regards to the PEO’s and our other NEOs’ compensation for fiscal year 2025, see page 32 of this proxy statement.


2025


PRINCIPAL
EXECUTIVE
OFFICER


NON-PEO
NAMED
EXECUTIVE
OFFICERS


Summary Compensation Table Total


25,007,664


11,335,760


Less Stock Award Value Reported in Summary Compensation Table for the Covered Year


(15,729,268

)


(7,165,643

)

Plus Fair Value for Awards Granted in the Covered Year


10,765,235


4,904,215


Change in Fair Value of Outstanding Unvested Awards from Prior Years


30,089,048


13,541,118


Change in Fair Value of Awards from Prior Years that Vested in the Covered Year


2,435,700


1,019,738


Compensation Actually Paid


52,568,379


23,635,188


Fair values set forth in the table above are computed in accordance with ASC 718 as of the end of the respective fiscal year, other than fair values of awards that vest in the covered year, which are valued as of the applicable vesting date. The assumptions included in the fair value of equity awards included in the calculation of Compensation Actually Paid differ from those previously disclosed as of the grant date of such awards primarily due to the lapse of time following the date of grant and, in the case of stock options, a change in the expected term of the options. The change in expected term of the options also impacts the determination of the expected volatility and risk-free interest rate.

(4)
TSR is cumulative for the measurement periods beginning on December 31, 2020 and ending on December 31 of each of 2025, 2024, 2023, 2022 and 2021 , respectively, calculated in accordance with Item 201(e) of Regulation S-K. The peer group utilized for purposes of TSR is the Nasdaq Technology Dividend TR Index, as set forth in Item 5 of our Annual Report on Form 10-K filed for the fiscal year ending December 31, 2025.
(5)
Reflects “Net Income” in the Company’s Consolidated Statements of Income included in the Company’s Annual Reports on Form 10-K for each of the years ended December 31, 2025, 2024, 2023, 2022 and 2021.
(6)
The most important financial performance measures used to link compensation for the most recently completed fiscal year were the following:


Adjusted Consolidated EBITDA

Adjusted Revenue

Adjusted EPS Growth

Operating Cash Flow

Organic Revenue Growth


These financial measures generally reflect those used internally to measure the Company’s performance and represent key drivers of sustainable stockholder value creation for our Company. We do not consider any one of the above performance measures, taken in isolation, to be the most important financial measure for our executive compensation design. However, for purposes of the table above, we have deemed Adjusted Consolidated EBITDA attributable to SS&C common stockholders as our “most important” financial measure used to link our NEO’s compensation with performance because it is a key component of our 2025 annual bonus program and critical indicator of the Company’s growth and financial health used by our investors and stockholders. For more detail on we link these measures with performance of our NEOs, see “Compensation Discussion and Analysis — Design and Structure of Executive Compensation” on page 35 of this proxy statement.

       
Company Selected Measure Name ADJUSTEDCONSOLIDATEDEBITDA        
Named Executive Officers, Footnote
(1)
For each of the years presented above, William Stone was our Principal Executive Officer (PEO). Average compensation for non-PEO named executive officers includes the following individuals: (i) for 2025 and 2024, Rahul Kanwar, Brian Schell, and Jason White , (ii) for 2023, Rahul Kanwar, Brian Schell, Patrick Pedonti and Jason White, (iii) for 2022, Rahul Kanwar, Patrick Pedonti and Jason White; and (iv) for 2021, Rahul Kanwar, Patrick Pedonti, Jason White and Joseph Frank.
       
Peer Group Issuers, Footnote
(4)
TSR is cumulative for the measurement periods beginning on December 31, 2020 and ending on December 31 of each of 2025, 2024, 2023, 2022 and 2021 , respectively, calculated in accordance with Item 201(e) of Regulation S-K. The peer group utilized for purposes of TSR is the Nasdaq Technology Dividend TR Index, as set forth in Item 5 of our Annual Report on Form 10-K filed for the fiscal year ending December 31, 2025.
       
PEO Total Compensation Amount $ 25,007,664 $ 25,870,693 $ 20,098,164 $ 12,810,392 $ 22,981,889
PEO Actually Paid Compensation Amount $ 52,568,379 32,403,858 18,813,540 (19,755,647) 28,938,956
Adjustment To PEO Compensation, Footnote
(3)
Compensation “actually paid” for the PEO and average compensation “actually paid” for our non-PEOs in each of 2025, 2024, 2023, 2022 and 2021 reflects the respective amounts set forth in columns (b) and (d) of the table above, adjusted as set forth in the table below, as determined in accordance with SEC rules. The dollar amounts reflected in columns (b) and (d) of the table above do not reflect the actual amount of compensation earned by or paid to the PEO and our other NEOs during the applicable year. For information regarding the decisions made by the Compensation Committee in regards to the PEO’s and our other NEOs’ compensation for fiscal year 2025, see page 32 of this proxy statement.


2025


PRINCIPAL
EXECUTIVE
OFFICER


NON-PEO
NAMED
EXECUTIVE
OFFICERS


Summary Compensation Table Total


25,007,664


11,335,760


Less Stock Award Value Reported in Summary Compensation Table for the Covered Year


(15,729,268

)


(7,165,643

)

Plus Fair Value for Awards Granted in the Covered Year


10,765,235


4,904,215


Change in Fair Value of Outstanding Unvested Awards from Prior Years


30,089,048


13,541,118


Change in Fair Value of Awards from Prior Years that Vested in the Covered Year


2,435,700


1,019,738


Compensation Actually Paid


52,568,379


23,635,188


Fair values set forth in the table above are computed in accordance with ASC 718 as of the end of the respective fiscal year, other than fair values of awards that vest in the covered year, which are valued as of the applicable vesting date. The assumptions included in the fair value of equity awards included in the calculation of Compensation Actually Paid differ from those previously disclosed as of the grant date of such awards primarily due to the lapse of time following the date of grant and, in the case of stock options, a change in the expected term of the options. The change in expected term of the options also impacts the determination of the expected volatility and risk-free interest rate.

       
Non-PEO NEO Average Total Compensation Amount $ 11,335,760 11,694,066 9,685,286 5,421,332 9,169,220
Non-PEO NEO Average Compensation Actually Paid Amount $ 23,635,188 15,046,583 9,263,980 (8,792,406) 8,831,721
Adjustment to Non-PEO NEO Compensation Footnote
(3)
Compensation “actually paid” for the PEO and average compensation “actually paid” for our non-PEOs in each of 2025, 2024, 2023, 2022 and 2021 reflects the respective amounts set forth in columns (b) and (d) of the table above, adjusted as set forth in the table below, as determined in accordance with SEC rules. The dollar amounts reflected in columns (b) and (d) of the table above do not reflect the actual amount of compensation earned by or paid to the PEO and our other NEOs during the applicable year. For information regarding the decisions made by the Compensation Committee in regards to the PEO’s and our other NEOs’ compensation for fiscal year 2025, see page 32 of this proxy statement.


2025


PRINCIPAL
EXECUTIVE
OFFICER


NON-PEO
NAMED
EXECUTIVE
OFFICERS


Summary Compensation Table Total


25,007,664


11,335,760


Less Stock Award Value Reported in Summary Compensation Table for the Covered Year


(15,729,268

)


(7,165,643

)

Plus Fair Value for Awards Granted in the Covered Year


10,765,235


4,904,215


Change in Fair Value of Outstanding Unvested Awards from Prior Years


30,089,048


13,541,118


Change in Fair Value of Awards from Prior Years that Vested in the Covered Year


2,435,700


1,019,738


Compensation Actually Paid


52,568,379


23,635,188


Fair values set forth in the table above are computed in accordance with ASC 718 as of the end of the respective fiscal year, other than fair values of awards that vest in the covered year, which are valued as of the applicable vesting date. The assumptions included in the fair value of equity awards included in the calculation of Compensation Actually Paid differ from those previously disclosed as of the grant date of such awards primarily due to the lapse of time following the date of grant and, in the case of stock options, a change in the expected term of the options. The change in expected term of the options also impacts the determination of the expected volatility and risk-free interest rate.

       
Compensation Actually Paid vs. Total Shareholder Return

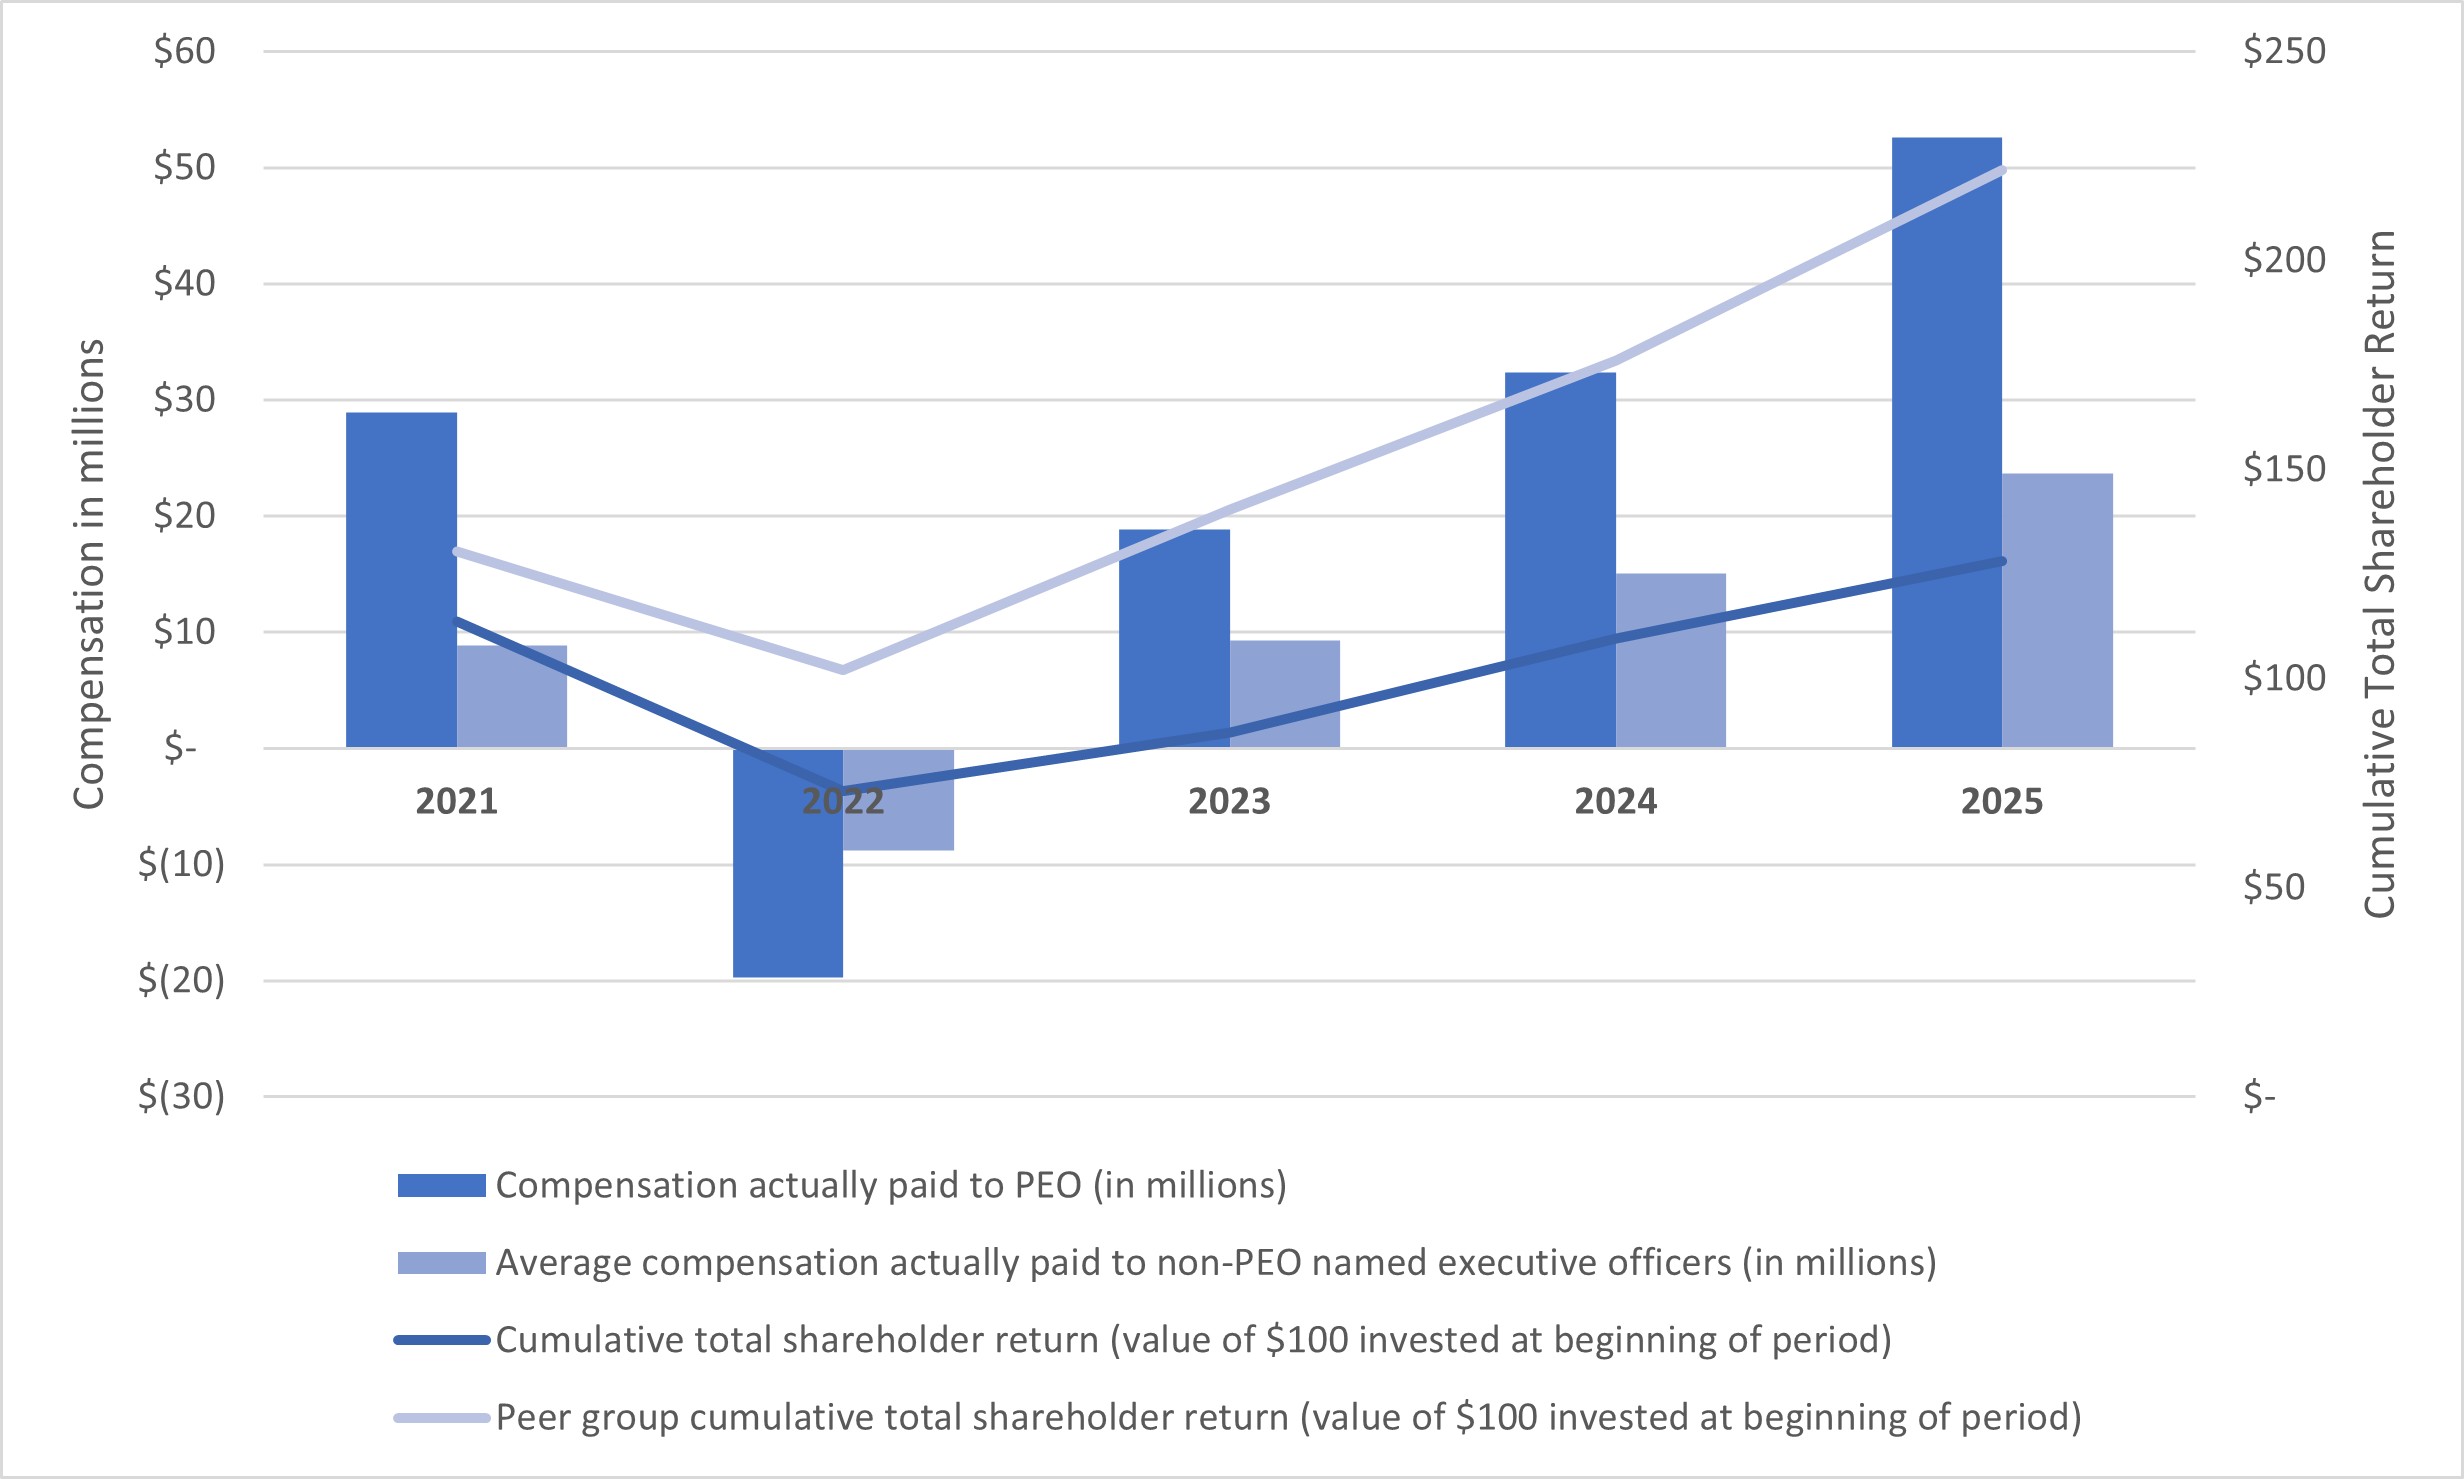
Compensation Actually Paid Compared to Cumulative Total Shareholder Return and Peer Group Total Shareholder Return


img156643513_104.jpg

       
Compensation Actually Paid vs. Net Income

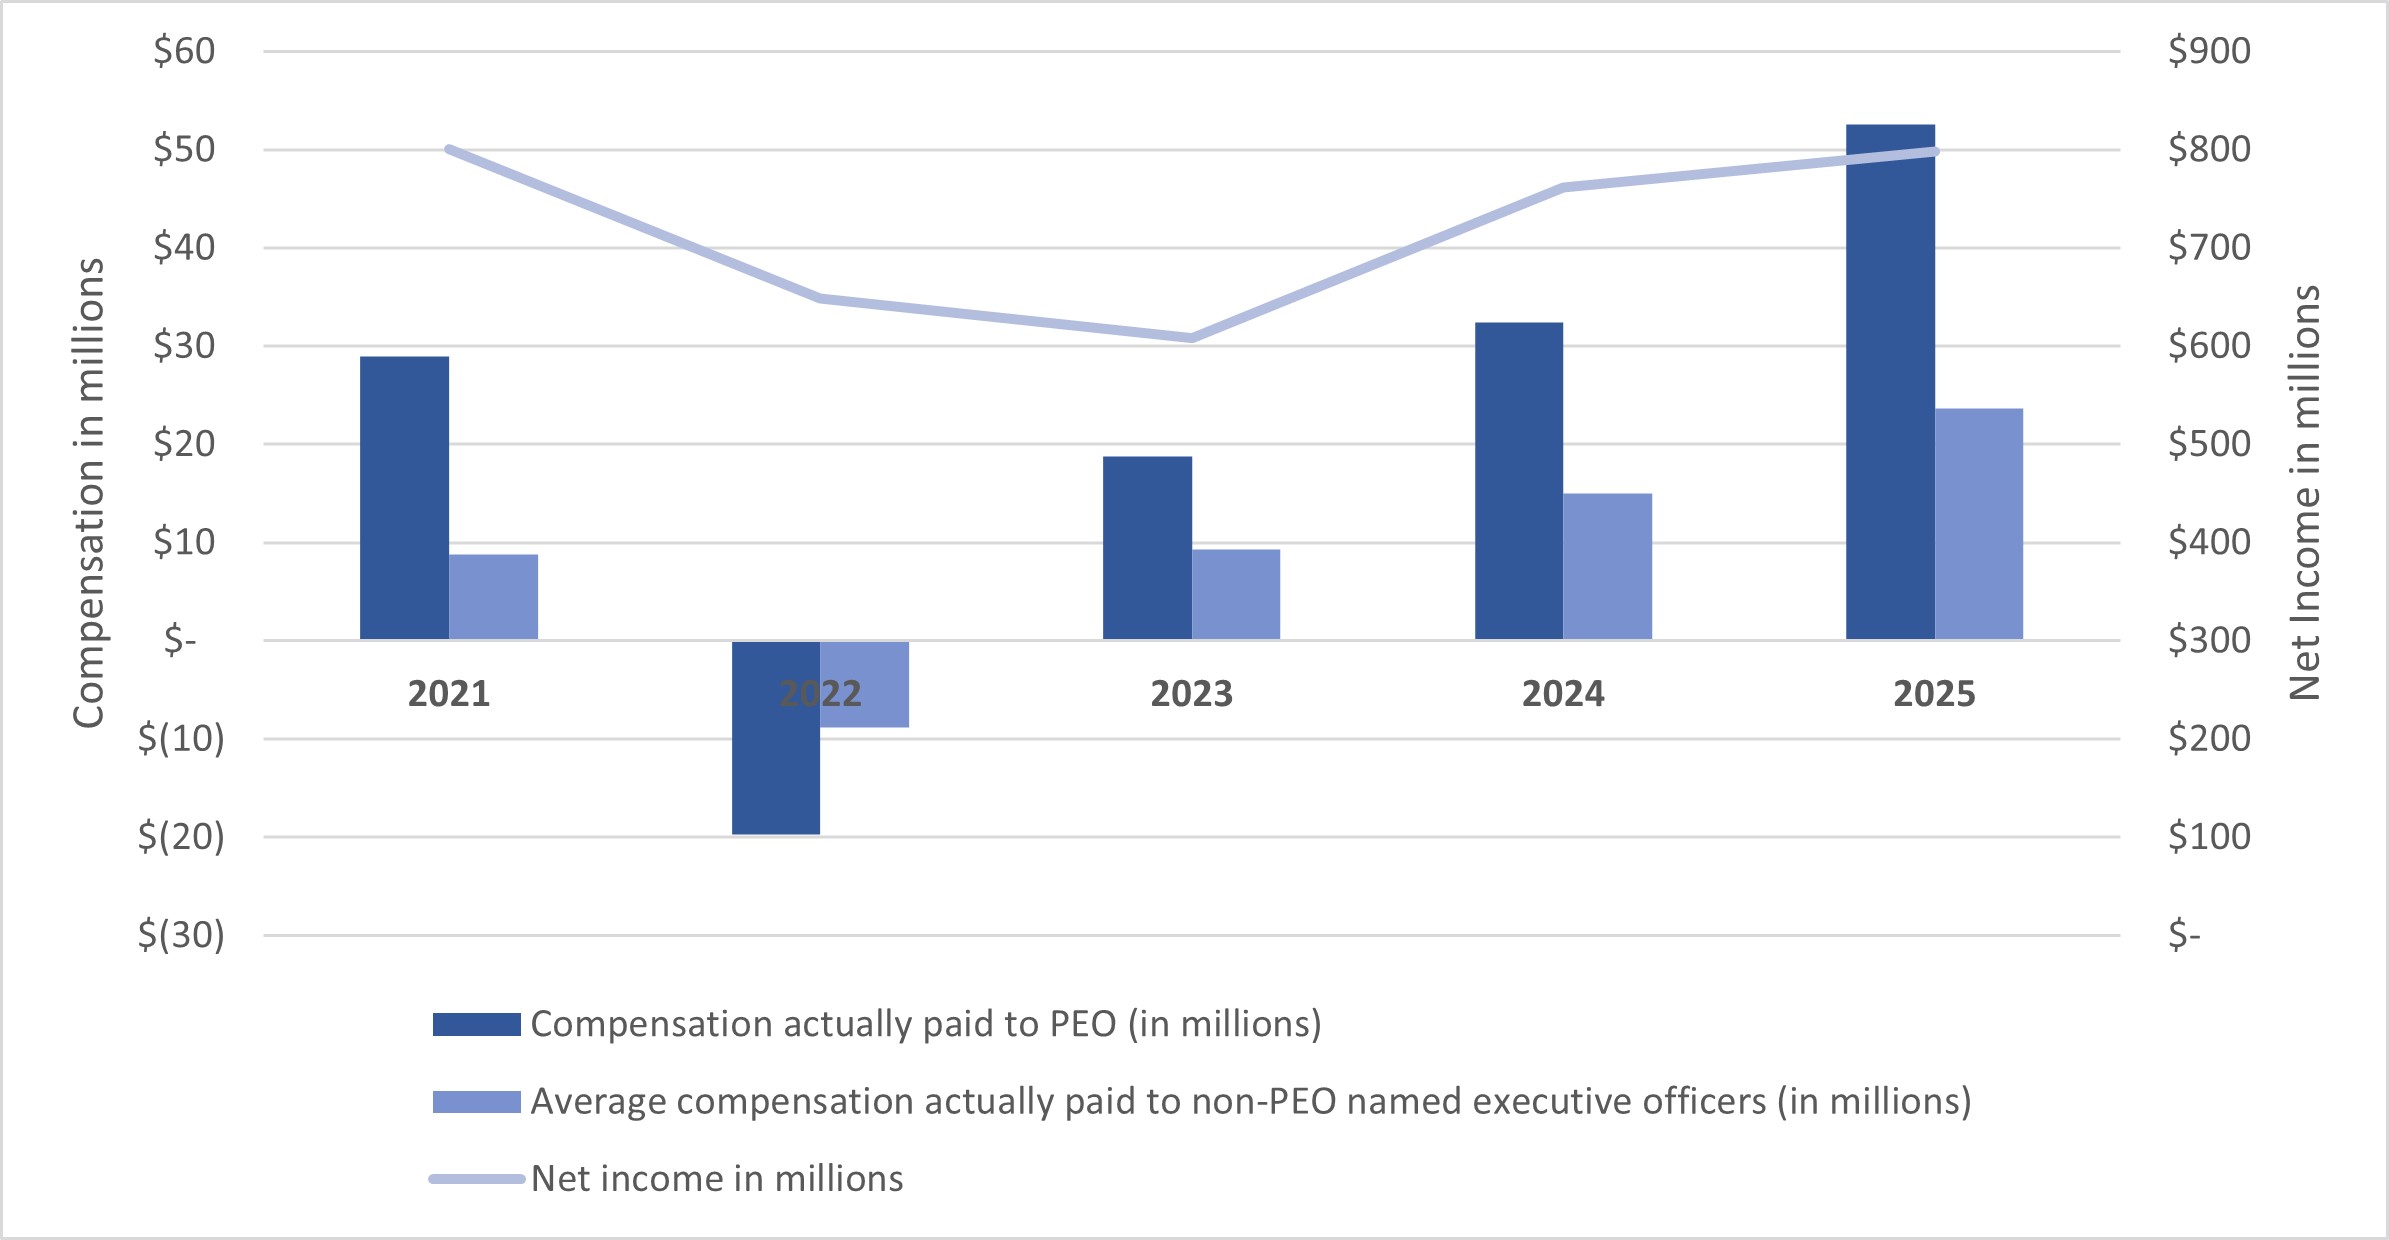
Compensation Actually Paid Compared to Net Income


img156643513_105.jpg

       
Compensation Actually Paid vs. Company Selected Measure

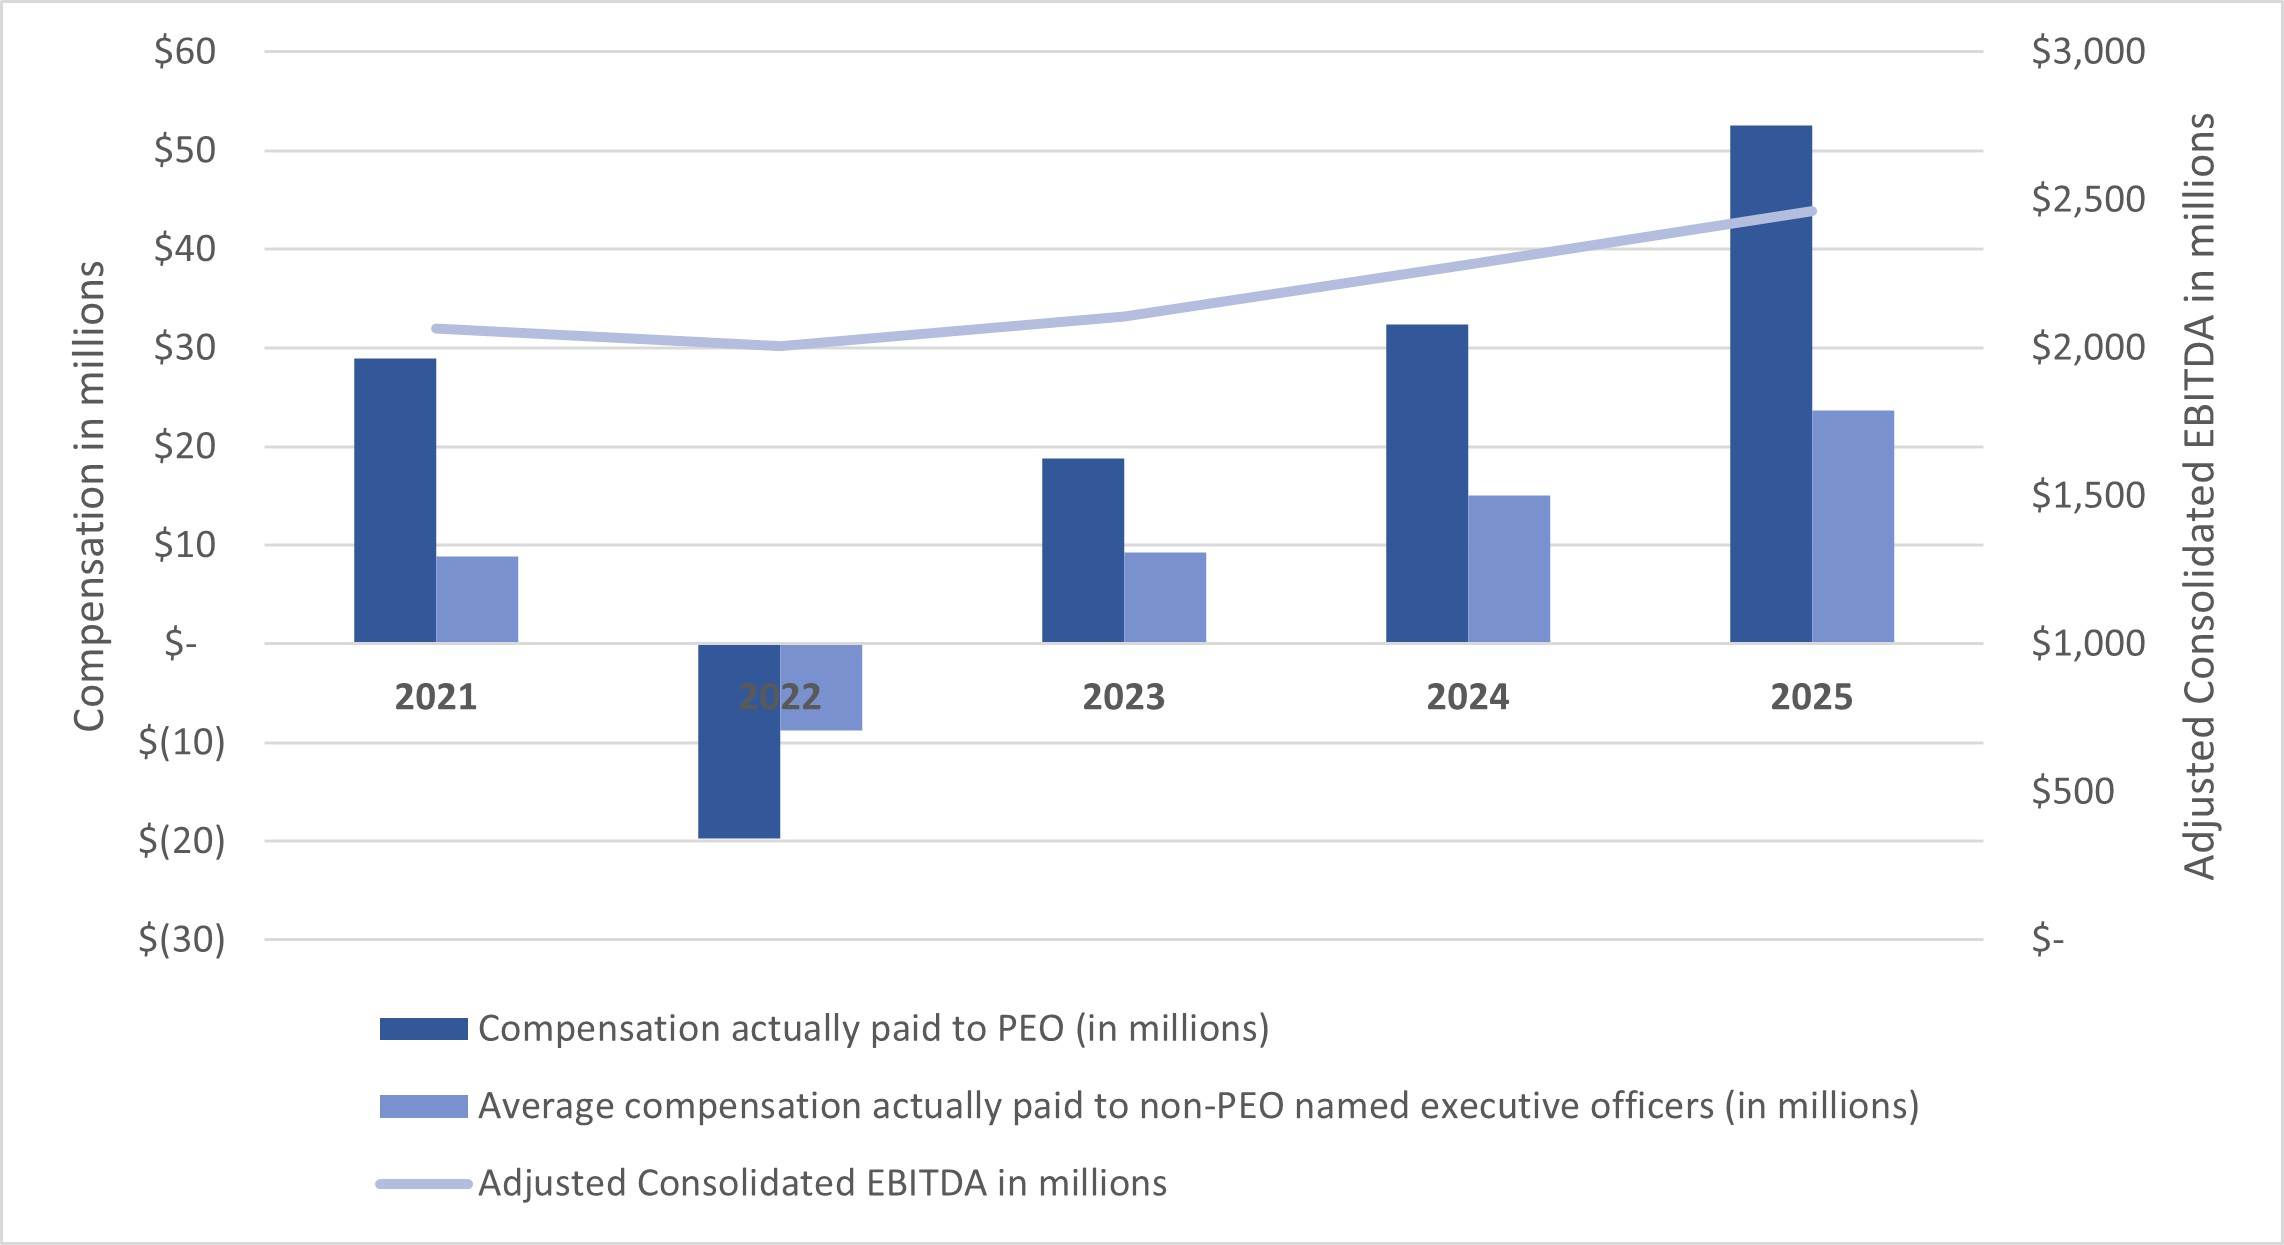
Compensation Actually Paid Compared to Adjusted Consolidated EBITDA


img156643513_106.jpg

       
Tabular List, Table
(6)
The most important financial performance measures used to link compensation for the most recently completed fiscal year were the following:


Adjusted Consolidated EBITDA

Adjusted Revenue

Adjusted EPS Growth

Operating Cash Flow

Organic Revenue Growth

       
Total Shareholder Return Amount $ 128.08 109.69 87.22 73.17 113.74
Peer Group Total Shareholder Return Amount 221.73 176.05 140.53 102.01 130.41
Net Income (Loss) $ 798,700,000 $ 761,700,000 $ 608,600,000 $ 649,000,000 $ 800,600,000
Company Selected Measure Amount 2,462,300,000 2,281,000,000 2,107,700,000 2,006,100,000 2,064,800,000
PEO Name William Stone William Stone William Stone William Stone William Stone
Measure:: 1          
Pay vs Performance Disclosure          
Name Adjusted Consolidated EBITDA        
Measure:: 2          
Pay vs Performance Disclosure          
Name Adjusted Revenue        
Measure:: 3          
Pay vs Performance Disclosure          
Name Adjusted EPS Growth        
Measure:: 4          
Pay vs Performance Disclosure          
Name Operating Cash Flow        
Measure:: 5          
Pay vs Performance Disclosure          
Name Organic Revenue Growth        
PEO | Year-end Fair Value of Equity Awards Granted in Covered Year that are Outstanding and Unvested          
Pay vs Performance Disclosure          
Adjustment to Compensation, Amount $ (15,729,268)        
PEO | Year-over-Year Change in Fair Value of Equity Awards Granted in Prior Years That are Outstanding and Unvested          
Pay vs Performance Disclosure          
Adjustment to Compensation, Amount 30,089,048        
PEO | Vesting Date Fair Value of Equity Awards Granted and Vested in Covered Year          
Pay vs Performance Disclosure          
Adjustment to Compensation, Amount 10,765,235        
PEO | Change in Fair Value as of Vesting Date of Prior Year Equity Awards Vested in Covered Year          
Pay vs Performance Disclosure          
Adjustment to Compensation, Amount 2,435,700        
Non-PEO NEO | Year-end Fair Value of Equity Awards Granted in Covered Year that are Outstanding and Unvested          
Pay vs Performance Disclosure          
Adjustment to Compensation, Amount (7,165,643)        
Non-PEO NEO | Year-over-Year Change in Fair Value of Equity Awards Granted in Prior Years That are Outstanding and Unvested          
Pay vs Performance Disclosure          
Adjustment to Compensation, Amount 13,541,118        
Non-PEO NEO | Vesting Date Fair Value of Equity Awards Granted and Vested in Covered Year          
Pay vs Performance Disclosure          
Adjustment to Compensation, Amount 4,904,215        
Non-PEO NEO | Change in Fair Value as of Vesting Date of Prior Year Equity Awards Vested in Covered Year          
Pay vs Performance Disclosure          
Adjustment to Compensation, Amount $ 1,019,738