Pay vs Performance Disclosure
Dec. 31, 2025
Pay Versus Performance Table
Average Summary Compensation Table Total for Non-PEO NEOs(1) ($) (d) | Average Compensation Actually Paid to Non-PEO NEOs(1)(2) ($) (e) | Value of Initial Fixed $100 Investment Based On: | Net Income ($ in millions) (h) | Attributable AFFO per Share ($) (i) | ||||||||||||||||||||||||||||
| Year (a) | Summary Compensation Table Total for PEO(1) ($) (b) | Compensation Actually Paid to PEO(1)(2) ($) (c) | Total Shareholder Return ($) (f) | Peer Group Total Shareholder Return(3) ($) (g) | ||||||||||||||||||||||||||||
First PEO | Second PEO | First PEO | Second PEO | |||||||||||||||||||||||||||||
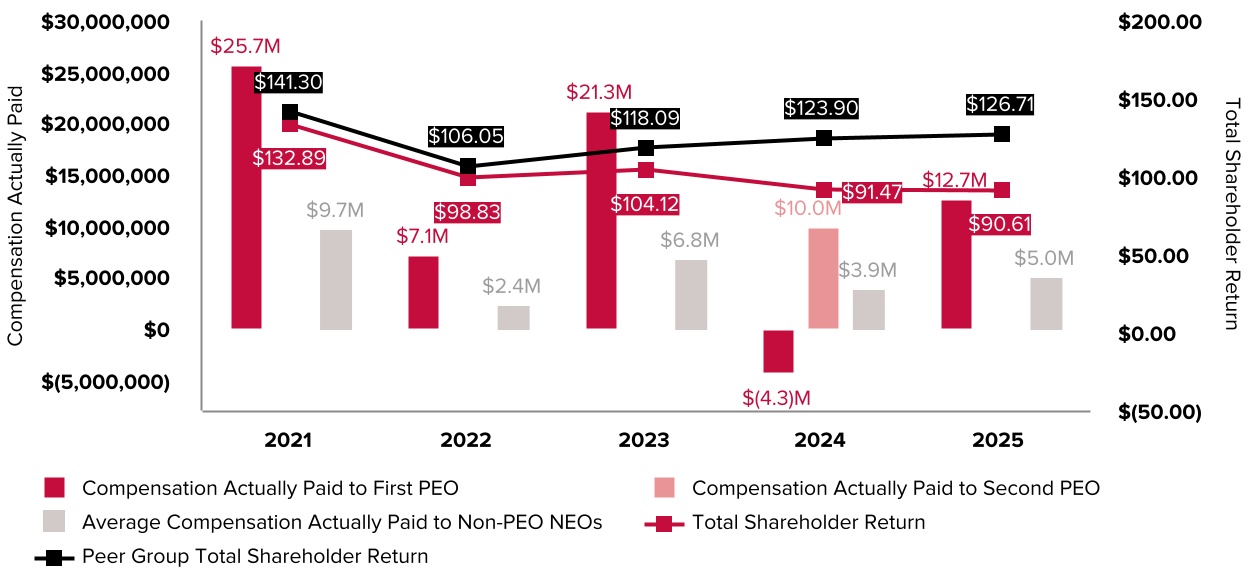
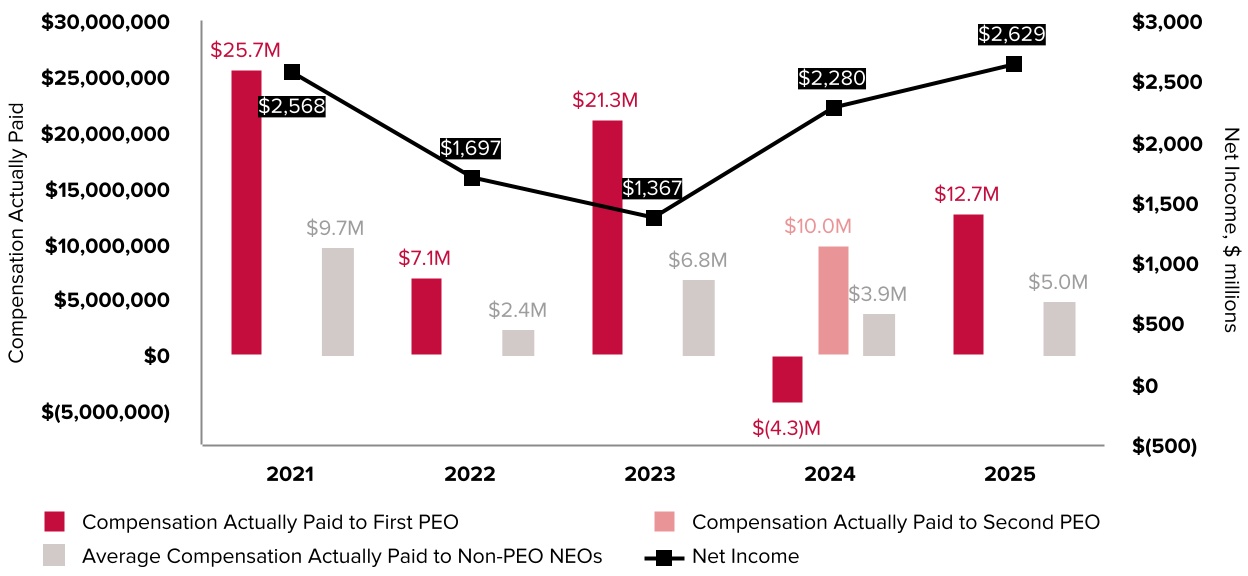
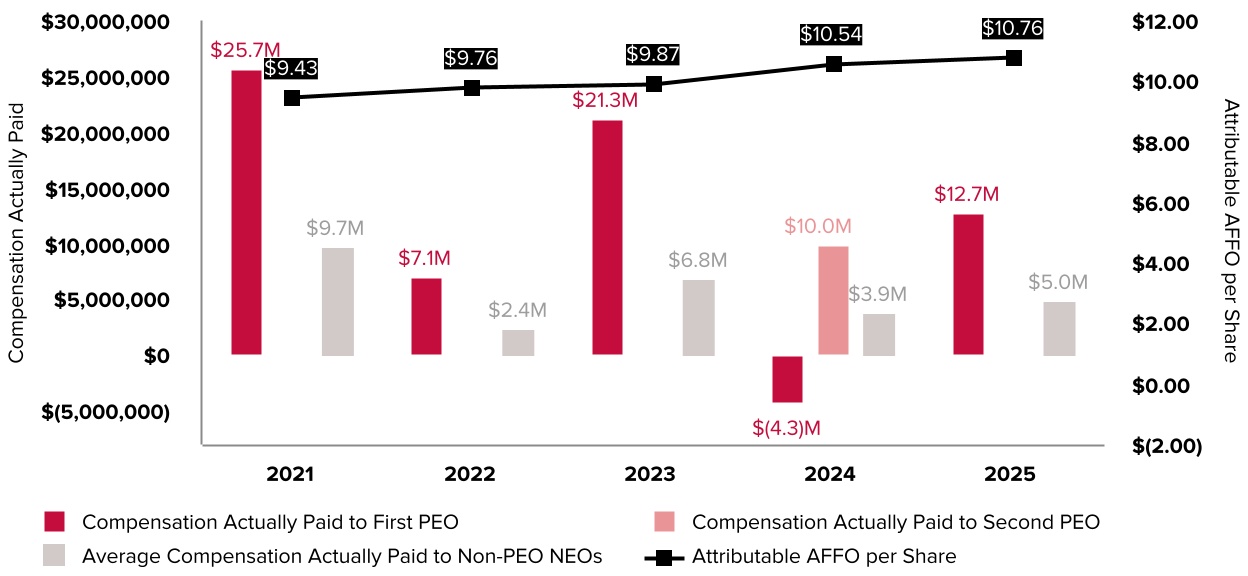
| 2025 | $ | 14,854,505 | N/A | $ | 12,726,064 | N/A | $ | 5,602,992 | $ | 4,975,350 | $ | 90.61 | $ | 126.71 | $ | 2,629 | $ | 10.76 | ||||||||||||||
| 2024 | $ | 1,180,670 | $ | 13,426,944 | $ | (4,286,218) | $ | 9,983,934 | $ | 5,740,405 | $ | 3,885,817 | $ | 91.47 | $ | 123.90 | $ | 2,280 | $ | 10.54 | ||||||||||||
| 2023 | $ | 19,709,245 | N/A | $ | 21,275,411 | N/A | $ | 6,329,634 | $ | 6,804,693 | $ | 104.12 | $ | 118.09 | $ | 1,367 | $ | 9.87 | ||||||||||||||
| 2022 | $ | 18,306,709 | N/A | $ | 7,107,859 | N/A | $ | 6,533,531 | $ | 2,404,100 | $ | 98.83 | $ | 106.05 | $ | 1,697 | $ | 9.76 | ||||||||||||||
| 2021 | $ | 16,114,574 | N/A | $ | 25,716,706 | N/A | $ | 6,009,705 | $ | 9,674,287 | $ | 132.89 | $ | 141.30 | $ | 2,568 | $ | 9.43 | ||||||||||||||
(1)For 2025, the principal executive officer (PEO) was Steven O. Vondran and the other NEOs were Rodney M. Smith, Olivier Puech, Ruth T. Dowling and Eugene M. Noel. For 2024, the first PEO was Thomas A. Bartlett and the second PEO was Steven O. Vondran, and the other NEOs were Rodney M. Smith, Olivier Puech, Sanjay Goel and Ruth T. Dowling. For 2023, the PEO was Thomas A. Bartlett and the other NEOs were Rodney M. Smith, Olivier Puech, Steven O. Vondran and Sanjay Goel. For 2022 and 2021, the PEO was Thomas A. Bartlett and the other NEOs were Rodney M. Smith, Edmund DiSanto, Olivier Puech and Steven O. Vondran.
(2)The following table summarizes the adjustments made in accordance with Item 402(v) of Regulation S-K in order to determine the amounts shown in the table above as “Compensation Actually Paid” for 2025 (a summary of adjustments made for 2020–2022 is included in our proxy statement for our 2023 Annual Meeting, a summary of adjustments made for 2023 is included in our proxy statement for our 2024 Annual Meeting and a summary of adjustments made for 2024 is included in our proxy statement for our 2025 Annual Meeting):
| 2025 | ||||||||
| Adjustments for Stock and Option Awards | PEO | Other NEOs(i) | ||||||
| Summary Compensation Table Total | $ | 14,854,505 | $ | 5,602,992 | ||||
(Minus): “Stock Awards” amount in Summary Compensation Total(ii) | $ | (11,528,748) | $ | (3,956,605) | ||||
Plus: Fair value at year end of awards granted during the covered fiscal year that are outstanding and unvested at year end(iii) | $ | 9,183,615 | $ | 3,166,661 | ||||
Plus (Minus): Year-over-year change in fair value of awards granted in any prior fiscal year that are outstanding and unvested at year end(iv) | $ | (608,522) | $ | (277,285) | ||||
Plus (Minus): Change as of the vesting date in fair value of awards granted in any prior fiscal year that vested during the covered fiscal year(v) | $ | 825,214 | $ | 439,587 | ||||
| Compensation Actually Paid (as calculated) | $ | 12,726,064 | $ | 4,975,350 | ||||
(i)Amounts presented are averages for the entire group of other NEOs.
(ii)Calculated by multiplying the number of shares of Common Stock underlying the RSU and PSU awards (at target) by $213.07, the closing market price of shares of our Common Stock on the grant date, March 10, 2025. For the component of the PSUs granted in 2025 (2025 PSUs) that are subject to a market condition, calculated by multiplying the number of shares of Common Stock underlying the 2025 PSUs (at target) by $286.21, the fair value on the grant date, March 10, 2025, determined using a Monte Carlo simulation model.
(iii)Calculated by multiplying the number of shares of Common Stock underlying the RSU and PSU awards (at target) by $175.57, the closing market price of shares of our Common Stock on December 31, 2025. For the component of the 2025 PSUs that are subject to a market condition, calculated by multiplying the number of shares of Common Stock underlying the 2025 PSUs (at target) by $192.10, the fair value on December 31, 2025, determined using a Monte Carlo simulation model.
(iv)Calculated by multiplying the number of shares of Common Stock underlying the RSU and PSU awards by the difference of $175.57, the closing market price of shares of our Common Stock on December 31, 2025, and $183.41, the closing market price of shares of our Common Stock on December 31, 2024. For the component of the PSUs granted in 2024 (2024 PSUs) that are subject to a market condition, calculated by multiplying the number of shares of Common Stock underlying the PSU awards by the difference of $84.20, the fair value of the 2024 PSUs on December 31, 2025, and $96.67, the fair value of the 2024 PSUs on December 31, 2024, both determined using a Monte Carlo simulation model. For 2025, PSU awards granted in 2024 are calculated based on the target award amounts and PSU awards granted in 2023 are calculated based on a 157% payout performance level.
(v)Calculated by multiplying the number of shares of Common Stock underlying the RSU and PSU awards by the difference of the closing market price of shares of our Common Stock on the vesting dates and $183.41, the closing market price of shares of our Common Stock on December 31, 2024.
(3)Peer Group TSR consists of the FTSE Nareit All Equity REITs Index.
Compensation Actually Paid to PEO and Average Compensation
Actually Paid to Non-PEO NEOs Versus Total Shareholder Return
and Peer Group Total Shareholder Return
Actually Paid to Non-PEO NEOs Versus Total Shareholder Return
and Peer Group Total Shareholder Return
Compensation Actually Paid to PEO and Average Compensation Actually Paid to
Non-PEO NEOs Versus Net Income
Non-PEO NEOs Versus Net Income
Compensation Actually Paid to PEO and Average Compensation Actually Paid to
Non-PEO NEOs Versus Attributable AFFO Per Share
Non-PEO NEOs Versus Attributable AFFO Per Share
Listed below are the financial performance measures that represent, in our assessment, the most important financial performance measures used by the Company to link compensation actually paid to our NEOs for the fiscal year ending December 31, 2025 to Company performance:
•Property Revenue, excluding pass-through revenue | ||
•Adjusted EBITDA | ||
•Attributable AFFO per Share | ||
•ROIC | ||