Pay Versus Performance
The following summarizes the relationship between Sphere’s CEO, and Sphere other NEO’s total compensation paid, and Sphere’s financial performance for the years shown in the table (in this discussion, Sphere’s CEO is also referred to as Sphere’s principal executive officer or “PEO”, and Sphere’s NEO other than Sphere’s CEO are referred to as Sphere’s “Non-PEO NEO”):
Summary Compensation Table Total for PEO(2) | Compensation Actually Paid to PEO(3) | Average Summary Compensation Table Total for | Average Compensation Actually Paid to | Value of Initial Fixed $100 Investment Based On Total | Net Loss(5) | |||||||||||||||||||||||||||
| Year(1) | Current PEO | Former PEO | Current PEO | Former PEO | Non-PEO NEO(2) | Non-PEO NEO(3) | Shareholder Return(4) | (in thousands) | ||||||||||||||||||||||||
| 2025 | $ | 1,972,391 | $ | 1,202,414 | $ | 1,598,796 | $ | 340,756 | $ | 687,739 | $ | 586,572 | $ | 32 | $ | (21,482 | ) | |||||||||||||||
| 2024 | N/A | $ | 3,276,449 | N/A | $ | 2,464,284 | $ | 1,090,487 | $ | 971,305 | $ | 28 | $ | (9,470 | ) | |||||||||||||||||
| 2023 | N/A | $ | 1,422,327 | N/A | $ | 1,328,674 | $ | 713,376 | $ | 602,077 | $ | 172 | $ | (23,330 | ) | |||||||||||||||||
| (1) | Kurt L. Kalbfleisch became Sphere’s CEO November 5, 2025 and was previously Acting CEO since January 31, 2025. Patricia Trompeter was Sphere’s CEO for January 2025 and during the fiscal years ended December 31, 2024 and 2023. During the fiscal year ended December 31, 2025, Sphere’s Non-PEO NEO was Tiah Reppas. During the fiscal years ended December 31, 2024 and 2023, Sphere’s Non-PEO NEO was Kurt L. Kalbfleisch. |
| (2) | See the Summary Compensation Table above for detail on the Summary Compensation Table total compensation for Sphere’s CEO and Sphere’s Non-PEO NEO for each fiscal year covered in the table. The total compensation for Sphere’s CEO and the compensation for Sphere’s Non-PEO NEO for 2023 was calculated from the Summary Compensation Table as disclosed in Sphere’s definitive proxy statement for its annual meeting filed with the SEC on April 5, 2024. |
| (3) | Reflects “compensation actually paid” (“CAP”) to each of Sphere’s NEOs (including for purposes of this table, former NEOs who are included in Sphere’s Non-PEO NEO group for the applicable year). |
| 2025 | 2024 | 2023 | ||||||||||||||||||||||||||
| Current PEO ($) | Former PEO ($) | Non-PEO NEO ($) | PEO ($) | Non-PEO NEO ($) | PEO ($) | Non-PEO NEO ($) | ||||||||||||||||||||||
| Reported Summary Compensation Table | 1,972,391 | 1,202,414 | 687,739 | 3,276,449 | 1,090,487 | 1,422,327 | 713,376 | |||||||||||||||||||||
| Reported Grant Date Value of Equity Awards | (1,034,238 | ) | (917,240 | ) | (291,560 | ) | (2,178,850 | ) | (294,425 | ) | (400,455 | ) | (227,589 | ) | ||||||||||||||
| Year-End Fair Value of Equity Awards Granted During the Year | 260,400 | — | 167,400 | 354,075 | 55,324 | — | — | |||||||||||||||||||||
| Change in Fair Value as of the Year-End for Unvested Equity Awards Granted in Prior Years | (15,150 | ) | — | — | (89,215 | ) | (44,204 | ) | 95,969 | 24,693 | ||||||||||||||||||
| Fair Value as of Vesting Date of Equity Awards Granted and Vested in the Year | 446,263 | 80,014 | 22,993 | 1,153,619 | 201,663 | 152,905 | 86,898 | |||||||||||||||||||||
| Change in Fair Value as of Vest Date for Equity Awards Granted in Prior Years that Vested in the Year | (30,870 | ) | (24,432 | ) | — | (51,794 | ) | (37,540 | ) | 57,928 | 4,699 | |||||||||||||||||
| Compensation Actually Paid | 1,598,796 | 340,756 | 586,572 | 2,464,284 | 971,305 | 1,328,674 | 602,077 | |||||||||||||||||||||
| (1) | Total Shareholder Return (“TSR”) illustrates the value, as of the last day of the indicated fiscal year, of a hypothetical investment of $100 in Sphere Common Shares on the last trading day of the year. TSR is calculated by dividing the sum of the cumulative amount of dividends for the fiscal year, assuming dividend reinvestment, and the difference between Sphere Common Share price at the end and the beginning of the fiscal year, by Sphere Common Share price at the beginning of the measurement period. |
| (2) | Represents the net loss reflected in Sphere’s consolidated audited financial statements for the applicable year. |
| (1) | Kurt L. Kalbfleisch became Sphere’s CEO November 5, 2025 and was previously Acting CEO since January 31, 2025. Patricia Trompeter was Sphere’s CEO for January 2025 and during the fiscal years ended December 31, 2024 and 2023. During the fiscal year ended December 31, 2025, Sphere’s Non-PEO NEO was Tiah Reppas. During the fiscal years ended December 31, 2024 and 2023, Sphere’s Non-PEO NEO was Kurt L. Kalbfleisch. |
| 2025 | 2024 | 2023 | ||||||||||||||||||||||||||
| Current PEO ($) | Former PEO ($) | Non-PEO NEO ($) | PEO ($) | Non-PEO NEO ($) | PEO ($) | Non-PEO NEO ($) | ||||||||||||||||||||||
| Reported Summary Compensation Table | 1,972,391 | 1,202,414 | 687,739 | 3,276,449 | 1,090,487 | 1,422,327 | 713,376 | |||||||||||||||||||||
| Reported Grant Date Value of Equity Awards | (1,034,238 | ) | (917,240 | ) | (291,560 | ) | (2,178,850 | ) | (294,425 | ) | (400,455 | ) | (227,589 | ) | ||||||||||||||
| Year-End Fair Value of Equity Awards Granted During the Year | 260,400 | — | 167,400 | 354,075 | 55,324 | — | — | |||||||||||||||||||||
| Change in Fair Value as of the Year-End for Unvested Equity Awards Granted in Prior Years | (15,150 | ) | — | — | (89,215 | ) | (44,204 | ) | 95,969 | 24,693 | ||||||||||||||||||
| Fair Value as of Vesting Date of Equity Awards Granted and Vested in the Year | 446,263 | 80,014 | 22,993 | 1,153,619 | 201,663 | 152,905 | 86,898 | |||||||||||||||||||||
| Change in Fair Value as of Vest Date for Equity Awards Granted in Prior Years that Vested in the Year | (30,870 | ) | (24,432 | ) | — | (51,794 | ) | (37,540 | ) | 57,928 | 4,699 | |||||||||||||||||
| Compensation Actually Paid | 1,598,796 | 340,756 | 586,572 | 2,464,284 | 971,305 | 1,328,674 | 602,077 | |||||||||||||||||||||
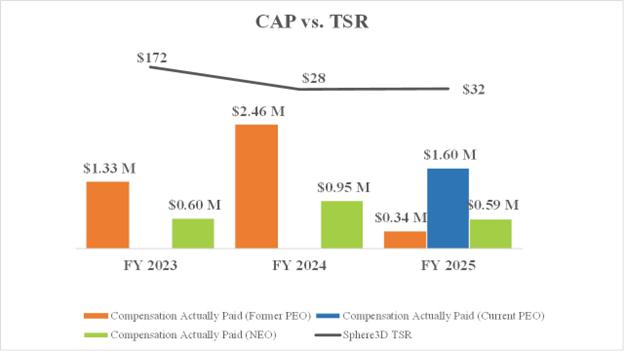
Compensation Actually Paid and Sphere TSR
The following chart sets forth the relationship between Compensation Actually Paid to Sphere’s current PEO, former PEO, Non-PEO NEO, and Sphere’s TSR over the fiscal three-year period from January 1, 2023 through December 31, 2025.
Compensation Actually Paid and Net Loss
The following chart sets forth the relationship between Compensation Actually Paid to Sphere’s Current PEO, former PEO, Non-PEO NEO, and Sphere’s net loss over the fiscal three-year period from January 1, 2023 through December 31, 2025.
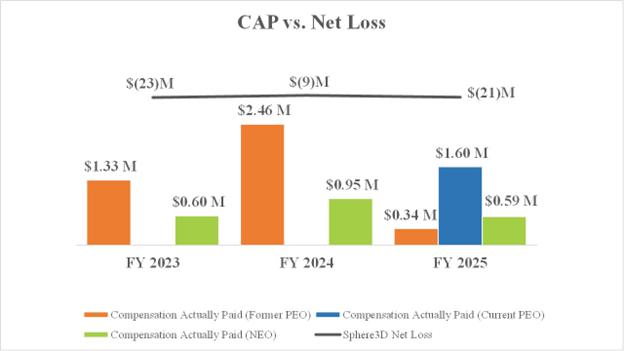
The graphical disclosures above reveal a decrease to Compensation Actually Paid to the current PEO, and Non-PEO NEO from 2023 to 2025. The decrease to Compensation Actually Paid was due to Sphere’s CEO transition during 2025. In addition, Sphere is an early-stage company, that has had limited revenue during the periods presented, and has incurred operating losses since inception. Significant upward and downward shifts in Bitcoin pricing have also impacted the net loss. Consequently, Sphere does not believe there is any meaningful relationship between Sphere’s TSR and Compensation Actually Paid to Sphere’s PEO and NEO during the periods presented, nor any meaningful relationship between Sphere’s net loss and Compensation Actually Paid to Sphere’s PEO and NEO during the periods presented.