Pay vs Performance Disclosure
Dec. 31, 2025
USD ($)
$ / shares
Dec. 31, 2024
USD ($)
$ / shares
Dec. 31, 2023
USD ($)
$ / shares
Dec. 31, 2022
USD ($)
$ / shares
Dec. 31, 2021
USD ($)
$ / shares
| Year | Summary Compensation Table (SCT) Total for PEO1 ($) | Compensation Actually Paid to PEO2 ($) | Average Summary Compensation Table Total for Non-PEO NEOs1 ($) | Average Compensation Actually Paid to Non-PEO NEOs3 ($) | Total Shareholder Return4 ($) | Peer Group Total Shareholder Return4 ($) | Net Income (Loss) (in $M) | Adjusted Diluted Net Earnings (Loss) Per Share5 ($) | ||||||||||||||||||||||||
| 2025 | 7,634,873 | 2,516,627 | 2,091,684 | 640,936 | 37.86 | 126.87 | 47.1 | 4.59 | ||||||||||||||||||||||||
| 2024 | 7,366,555 | (4,765,014) | 2,766,144 | (45,286) | 63.84 | 137.81 | 132.4 | 4.17 | ||||||||||||||||||||||||
| 2023 | 7,764,615 | 13,280,569 | 2,498,754 | 3,900,605 | 101.04 | 124.22 | 64.5 | 3.45 | ||||||||||||||||||||||||
| 2022 | 7,835,495 | (8,291,607) | 3,060,984 | (792,323) | 81.19 | 113.92 | (80.6) | 2.65 | ||||||||||||||||||||||||
| 2021 | 9,374,480 | 23,174,447 | 2,345,015 | 5,176,896 | 128.81 | 140.40 | 62.5 | 3.21 | ||||||||||||||||||||||||
| Fiscal Year | PEO | Non-PEO NEOs | ||||||||||||
| 2025 | Patrick J. Beyer | Todd W. Garner, Hollie Foust, Brent Lalomia, Peter K. Shagory | ||||||||||||
| 2024 | Curt R. Hartman | Todd W. Garner, Patrick J. Beyer, Stanley (Bill) W. Peters, Heather L. Cohen, Peter K. Shagory, Brent Lalomia | ||||||||||||
| 2023 | Curt R. Hartman | Todd W. Garner, Patrick J. Beyer, Stanley (Bill) W. Peters, Heather L. Cohen | ||||||||||||
| 2022 | Curt R. Hartman | Todd W. Garner, Patrick J. Beyer, Stanley (Bill) W. Peters, Heather L. Cohen | ||||||||||||
| 2021 | Curt R. Hartman | Todd W. Garner, Patrick J. Beyer, Stanley (Bill) W. Peters, Daniel S. Jonas | ||||||||||||
| Fiscal Year | 2025 ($) | ||||
SCT Total | 7,634,873 | ||||
| Grant Date Fair Value of Option Awards and Stock Awards Granted in Fiscal Year | (4,999,948) | ||||
| Fair Value at Fiscal Year-End of Outstanding and Unvested Option Awards and Stock Awards Granted in Fiscal Year | 2,178,924 | ||||
| Change in Fair Value of Outstanding and Unvested Option Awards and Stock Awards Granted in Prior Fiscal Years | (2,032,144) | ||||
| Change in Fair Value as of Vesting Date of Option Awards and Stock Awards Granted in Prior Fiscal Years For Which Applicable Vesting Conditions Were Satisfied During Fiscal Year | (265,078) | ||||
Compensation Actually Paid | 2,516,627 | ||||
| Fiscal Year | 2025 ($) | ||||
SCT Total | 2,091,684 | ||||
| Grant Date Fair Value of Option Awards and Stock Awards Granted in Fiscal Year | (1,181,273) | ||||
| Fair Value at Fiscal Year-End of Outstanding and Unvested Option Awards and Stock Awards Granted in Fiscal Year | 725,939 | ||||
| Change in Fair Value of Outstanding and Unvested Option Awards and Stock Awards Granted in Prior Fiscal Years | (840,440) | ||||
| Change in Fair Value as of Vesting Date of Option Awards and Stock Awards Granted in Prior Fiscal Years For Which Applicable Vesting Conditions Were Satisfied During Fiscal Year | (154,975) | ||||
Compensation Actually Paid | 640,936 | ||||
The table below shows the alignment between Compensation Actually Paid (CAP) to the CEO and Average CAP to our non-CEO NEOs, and our performance, consistent with our compensation philosophy as described in “Compensation Discussion and Analysis.” The following graph displays CONMED TSR, Peer Group TSR, the CAP for the PEO and the average non-PEO NEO CAP, for the years 2021, 2022, 2023, 2024, and 2025.
CONMED Corporation CAP vs TSR
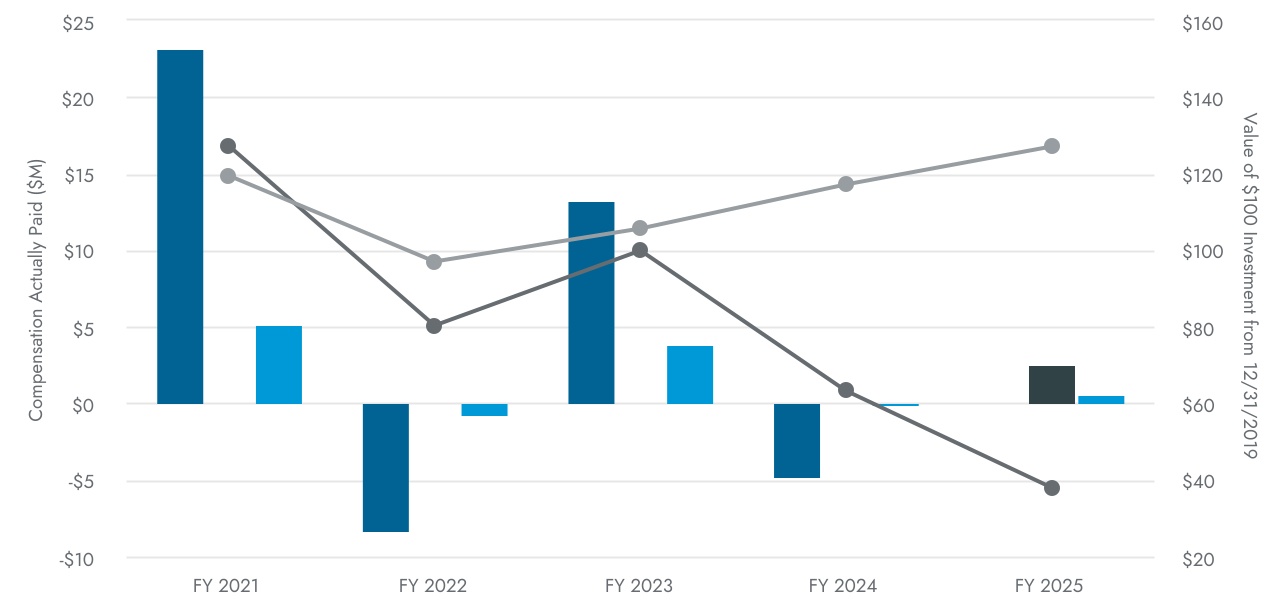
PEO CAP ($M) - HARTMAN, CURT | PEO CAP ($M) - BEYER, PAT | AVG NEO CAP ($M) | CNMD TSR | S&P 500 Health Care Equipment (Sub Ind) TSR | ||||||||||||||||||||||||||||||||||||||||||||||||||||
The following graph displays Net Income and CAP of the PEO and the average non-PEO NEOs for the years 2021, 2022, 2023, 2024, and 2025.
CONMED Corporation CAP vs Net Income
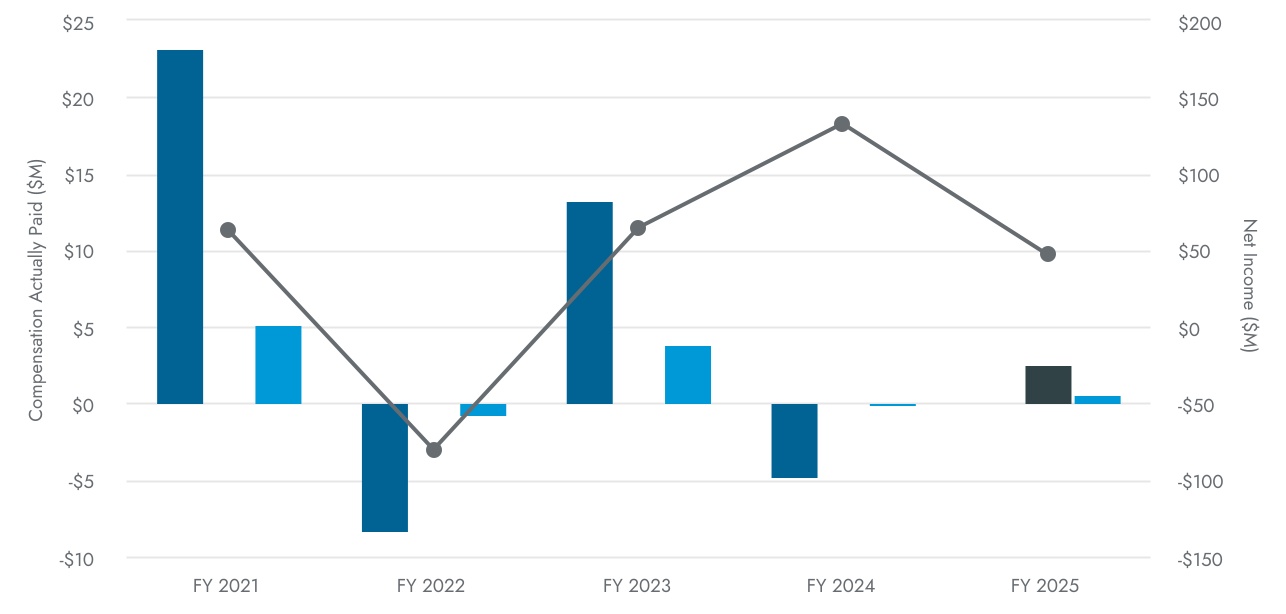
PEO CAP ($M) - HARTMAN, CURT | PEO CAP ($M) - BEYER, PAT | AVG NEO CAP ($M) | Net Income ($M) | |||||||||||||||||||||||||||||||||||||||||
The following graph displays the Company selected measure, Adjusted Diluted Net EPS, and the CAP for the PEO and the average non-PEO NEO CAP for the years 2021, 2022, 2023, 2024, and 2025.
CONMED Corporation CAP vs Adjusted Diluted Net Earnings Per Share
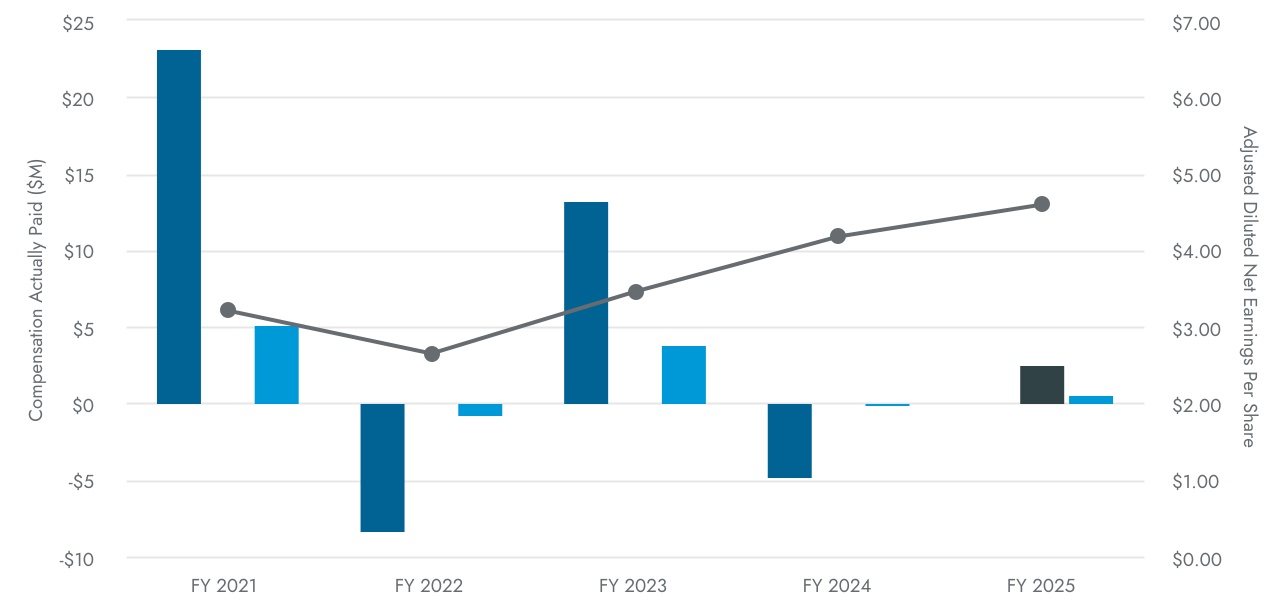
PEO CAP ($M) - HARTMAN, CURT | PEO CAP ($M) - BEYER, PAT | AVG NEO CAP ($M) | Adjusted Diluted Net Earnings Per Share | |||||||||||||||||||||||||||||||||||||||||
The table below shows the alignment between Compensation Actually Paid (CAP) to the CEO and Average CAP to our non-CEO NEOs, and our performance, consistent with our compensation philosophy as described in “Compensation Discussion and Analysis.” The following graph displays CONMED TSR, Peer Group TSR, the CAP for the PEO and the average non-PEO NEO CAP, for the years 2021, 2022, 2023, 2024, and 2025.
CONMED Corporation CAP vs TSR
PEO CAP ($M) - HARTMAN, CURT | PEO CAP ($M) - BEYER, PAT | AVG NEO CAP ($M) | CNMD TSR | S&P 500 Health Care Equipment (Sub Ind) TSR | ||||||||||||||||||||||||||||||||||||||||||||||||||||