PAY VERSUS PERFORMANCE
As required by Section 953(a) of the Dodd-Frank Wall Street Reform and Consumer Protection Act and Item 402(v) of Regulation S-K, we are providing the following information about the relationship between executive compensation of our Named Executive Officers (“NEOs”) including our Principal Executive Officer (“PEO”) and certain financial performance measures of the Company.
The table below presents information on the compensation of our PEO and our other NEOs in comparison to certain performance metrics for 2025 and 2024. The use of the term “compensation actually paid” (“CAP”) is required by the SEC’s rules. Neither CAP nor the total amount reported in the Summary Compensation Table reflect the amount of compensation actually paid, earned or received during the applicable year. Per SEC rules, CAP was calculated by adjusting the Summary Compensation Table Total values for the applicable year as described in the footnotes to the table.
Pay Versus Performance Table for 2025
| Year | Summary Compensation Table Total for PEO Gary Schubert (1)(2) | Compensation Actually Paid to PEO Gary Schubert (1)(3) | Summary Compensation Table Total for PEO Bill Bennett (1)(2) | Compensation Actually Paid to PEO Bill Bennett (1)(3) | Summary Compensation Table Total for PEO Sam Klepfish (1)(2) | Compensation Actually Paid to PEO Sam Klepfish (1)(3) | Average Summary Compensation Table Total for Non-PEO NEOs (1)(2) | Average Compensation Actually Paid to Non-PEO NEOs (1)(3) | Value of Initial Fixed $100 Investment Based On Total Shareholder Return | Net Income (loss) (millions) | ||||||||||||||||||||||||||||||
| 2025 | $ | 377,416 | $ | 208,904 | $ | 485,516 | $ | 728,156 | $ | - | $ | - | $ | 442,285 | $ | (1,011,857 | ) | $ | 132 | $ | (2.0 | ) | ||||||||||||||||||
| 2024 | $ | - | $ | - | $ | 732,846 | $ | 2,632,635 | $ | - | $ | - | $ | 543,035 | $ | 2,363,478 | $ | 548 | $ | 2.6 | ||||||||||||||||||||
| 2023 | $ | - | $ | - | $ | 1,615,172 | $ | 3,213,953 | $ | 1,988,891 | $ | 1,988,891 | $ | 337,686 | $ | 466,805 | $ | 227 | $ | (4.4 | ) | |||||||||||||||||||
| (1) | In 2025, we had two CEOs: Gary Schubert and Robert W. (Bill) Bennett; our non-PEO NEO was Brady Smallwood. In 2024, our PEO was Robert W. (Bill) Bennett; our non-PEO NEOs were Brady Smallwood and Gary Schubert. In 2023, we had two CEOs: Robert W. (Bill) Bennett and Sam Klepfish; the non-PEO NEOs were Justin Wiernasz, Richard Tang, Brady Smallwood, and Gary Schubert. |
| (2) | Amounts represent the “Total” column as set forth in the Summary Compensation Table on page 13 of this Proxy Statement. |
| (3) | Amounts represent the “compensation actually paid” as computed in accordance with Item 402(v) of Regulation S-K. |
The table below reconciles the amount of compensation reported for our PEO Gary Schubert to the amount of compensation actually paid for 2025. During the year ended 2024, Mr. Schubert was not our PEO.
| Year | Reported Summary Compensation Table Total for PEO | Reported Value of Equity Awards (4) | Equity Award Adjustments (5) | Reported Change in the Actuarial Present Value of Pension Benefits | Pension Benefit Adjustments | Compensation Actually Paid to PEO | ||||||||||||||||||
| 2025 | $ | 377,416 | $ | - | $ | (168,512 | ) | $ | - | $ | - | $ | 208,904 | |||||||||||
| 2024 | $ | - | $ | - | $ | - | $ | - | $ | - | $ | - | ||||||||||||
| 2023 | $ | - | $ | - | $ | - | $ | - | $ | - | $ | - | ||||||||||||
The table below reconciles the amount of compensation reported for our PEO Robert W. (Bill) Bennett to the amount of compensation actually paid:
| Year | Reported Summary Compensation Table Total for PEO | Reported Value of Equity Awards (4) | Equity Award Adjustments (5) | Reported Change in the Actuarial Present Value of Pension Benefits | Pension Benefit Adjustments | Compensation Actually Paid to PEO | ||||||||||||||||||
| 2025 | $ | 485,516 | $ | - | $ | 242,640 | $ | $ | $ | 728,156 | ||||||||||||||
| 2024 | $ | 732,846 | $ | - | $ | 1,899,789 | $ | $ | $ | 2,632,635 | ||||||||||||||
| 2023 | $ | 1,615,172 | $ | (660,541 | ) | $ | 2,259,322 | $ | - | $ | - | $ | 3,213,953 | |||||||||||
The table below reconciles the amount of compensation reported for our PEO Sam Klepfish to the amount of compensation actually paid:
| Year | Reported Summary Compensation Table Total for PEO Sam Klepfish | Reported Value of Equity Awards (4) | Equity Award Adjustments (5) | Reported Change in the Actuarial Present Value of Pension Benefits | Pension Benefit Adjustments | Compensation Actually Paid to PEO Sam Klepfish | ||||||||||||||||||
| 2025 | $ | - | $ | - | $ | - | $ | $ | $ | - | ||||||||||||||
| 2024 | $ | - | $ | - | $ | - | $ | - | $ | - | $ | - | ||||||||||||
| 2023 | $ | 1,988,891 | $ | (40,681 | ) | $ | 40,681 | $ | - | $ | - | $ | 1,988,891 | |||||||||||
| (4) | The grant date fair value of equity awards represents the total of the amounts reported in the “Stock Awards” and “Option Awards” columns in the Summary Compensation Table for the applicable year. |
| (5) | The equity award adjustments for each applicable year include the addition (or subtraction, as applicable) of the following: (i) the year-end fair value of any equity awards granted in the applicable year that are outstanding and unvested as of the end of the year; (ii) the amount of change as of the end of the applicable year (from the end of the prior fiscal year) in fair value of any awards granted in prior years that are outstanding and unvested as of the end of the applicable year; (iii) for awards that are granted and vest in the same applicable year, the fair value as of the vesting date; (iv) for awards granted in prior years that vest in the applicable year, the amount equal to the change as of the vesting date (from the end of the prior fiscal year) in fair value; (v) for awards granted in prior years that are determined to fail to meet the applicable vesting conditions during the applicable year, a deduction for the amount equal to the fair value at the end of the prior fiscal year; and (vi) the dollar value of any dividends or other earnings paid on stock in the applicable year prior to the vesting date that are not otherwise reflected in the fair value of such award or included in any other component of total compensation for the applicable year. The valuation assumptions used to calculate fair values did not materially differ from those disclosed at the time of grant. |
The amounts deducted or added in calculating the equity award adjustments for our PEO Gary Schubert are as follows:
| Year | Year End Fair Remain Unvested | Year Over Year Change in Fair Value of Outstanding and Unvested Equity Awards That Were Granted in a Prior Fiscal Year | Fair Value as of Vesting Date of Equity Awards Granted and Vested in the Year | Year Over Year Change in Fair Value of Equity Awards Granted in Prior Years that Vested in the Year | Fair Value at the End of the Prior Year of Equity Awards that Failed to Meet Vesting Conditions in the Year | Value of Dividends or other Earnings Paid on Stock or Option Awards not Otherwise Reflected in Fair Value or Total Compensation | Total Equity Award Adjustments | |||||||||||||||||||||
| 2025 | $ | - | $ | (221,459 | ) | $ | - | $ | 52,947 | $ | - | $ | - | $ | (168,512 | ) | ||||||||||||
| 2024 | $ | - | $ | - | $ | - | $ | - | $ | - | $ | - | $ | - | ||||||||||||||
| 2023 | $ | - | $ | - | $ | - | $ | - | $ | - | $ | - | $ | - | ||||||||||||||
The amounts deducted or added in calculating the equity award adjustments for our PEO Robert W. (Bill) Bennett are as follows:
| Year | Year End Fair Remain Unvested | Year Over Year Change in Fair Value of Outstanding and Unvested Equity Awards That Were Granted in a Prior Fiscal Year | Fair Value as of Vesting Date of Equity Awards Granted and Vested in the Year | Year Over Year Change in Fair Value of Equity Awards Granted in Prior Years that Vested in the Year | Fair Value at the End of the Prior Year of Equity Awards that Failed to Meet Vesting Conditions in the Year | Value of Dividends or other Earnings Paid on Stock or Option Awards not Otherwise Reflected in Fair Value or Total Compensation | Total Equity Award Adjustments | |||||||||||||||||||||
| 2025 | $ | - | $ | - | $ | - | $ | 242,640 | $ | $ | $ | 242,640 | ||||||||||||||||
| 2024 | $ | - | $ | 510,158 | $ | - | $ | 1,389,631 | $ | $ | $ | 1,899,789 | ||||||||||||||||
| 2023 | $ | 1,631,824 | $ | - | $ | 627,498 | $ | - | $ | - | $ | - | $ | 2,259,322 | ||||||||||||||
The amounts deducted or added in calculating the equity award adjustments for our PEO Sam Klepfish are as follows:
| Year | Year End Fair Value of Equity Awards Granted During Applicable Fiscal Year that Remain Unvested as of Applicable Fiscal Year End | Year over Year Change in Fair Value of Outstanding and Unvested Equity Awards in a Prior Fiscal Year | Fair Value as of Vesting Date of Granted and Vested in the Year | Year Over Year Change in Fair Value of Equity Awards Granted in Prior Years that Vested in the Year | Fair Value at the Awards that Failed to Meet Vesting Conditions in the Year | Value of Dividends or other Earnings Paid on Stock Reflected in Fair Value or Total Compensation | Total Equity Awards Adjustments | |||||||||||||||||||||
| 2025 | $ | - | $ | - | $ | - | $ | - | $ | - | $ | - | $ | - | ||||||||||||||
| 2024 | $ | - | $ | - | $ | - | $ | - | $ | - | $ | - | $ | - | ||||||||||||||
| 2023 | $ | - | $ | - | $ | 40,681 | $ | - | $ | - | $ | - | $ | 40,681 | ||||||||||||||
The table below reconciles the average amount of compensation reported for our non-PEO NEOs to the average amount of compensation actually paid:
| Year | Average Reported Summary Compensation Table Total for Non-PEO NEOs | Average Reported Value of Equity Awards | Average Equity Award Adjustments | Average Reported Change in the Actuarial Present Value of Pension Benefits | Average Pension Benefit Adjustments | Average Compensation Actually Paid to Non-PEO NEOs | ||||||||||||||||||
| 2025 | $ | 442,285 | $ | - | $ | (1,454,142 | ) | $ | - | $ | - | $ | (1,011,857 | ) | ||||||||||
| 2024 | $ | 543,035 | $ | (119,374 | ) | $ | 1,939,817 | $ | - | $ | - | $ | 2,363,478 | |||||||||||
| 2023 | $ | 337,686 | $ | (52,437 | ) | $ | 181,556 | $ | - | $ | - | $ | 466,805 | |||||||||||
The amounts deducted or added in calculating the total average equity award adjustments are as follows:
| Year | Average Year End Fair Value of Equity Awards Granted During Applicable Fiscal Year that Remain Unvested as of Applicable Fiscal Year End | Year Over Year Average Change in Fair Value of Outstanding and Unvested Equity Awards That Were Granted In a Prior Fiscal Year | Average Fair Value as of Vesting Date of Equity Awards Granted and Vested in the Year | Year Over Year Average Change in Fair Value of Equity Awards Granted in Prior Years that Vested in the Year | Average Fair Value at the End of the Prior Year of Equity Awards that Failed to Meet Vesting Conditions in the Year | Average Value of Dividends or other Earnings Paid on Stock or Option Awards not Otherwise Reflected in Fair Value or Total Compensation | Total Average Equity Award Adjustments | |||||||||||||||||||||
| 2025 | $ | - | $ | (1,511,537 | ) | $ | - | $ | 57,395 | $ | $ | $ | (1,454,142 | ) | ||||||||||||||
| 2024 | $ | 800,817 | $ | 767,086 | $ | 91,760 | $ | 280,154 | $ | $ | $ | 1,939,817 | ||||||||||||||||
| 2023 | $ | 181,556 | $ | - | $ | - | $ | - | $ | - | $ | - | $ | 181,556 | ||||||||||||||
In 2025, we had two CEOs: Gary Schubert and Robert W. (Bill) Bennett; our non-PEO NEO was Brady Smallwood.
In 2024, our PEO was Robert W. (Bill) Bennett; our non-PEO NEOs were Brady Smallwood and Gary Schubert.
In 2023, we had two CEOs: Robert W. (Bill) Bennett and Sam Klepfish; the non-PEO NEOs were Justin Wiernasz, Richard Tang, Brady Smallwood, and Gary Schubert.
The table below reconciles the amount of compensation reported for our PEO Gary Schubert to the amount of compensation actually paid for 2025. During the year ended 2024, Mr. Schubert was not our PEO.
| Year | Reported Summary Compensation Table Total for PEO | Reported Value of Equity Awards (4) | Equity Award Adjustments (5) | Reported Change in the Actuarial Present Value of Pension Benefits | Pension Benefit Adjustments | Compensation Actually Paid to PEO | ||||||||||||||||||
| 2025 | $ | 377,416 | $ | - | $ | (168,512 | ) | $ | - | $ | - | $ | 208,904 | |||||||||||
| 2024 | $ | - | $ | - | $ | - | $ | - | $ | - | $ | - | ||||||||||||
| 2023 | $ | - | $ | - | $ | - | $ | - | $ | - | $ | - | ||||||||||||
The table below reconciles the amount of compensation reported for our PEO Robert W. (Bill) Bennett to the amount of compensation actually paid:
| Year | Reported Summary Compensation Table Total for PEO | Reported Value of Equity Awards (4) | Equity Award Adjustments (5) | Reported Change in the Actuarial Present Value of Pension Benefits | Pension Benefit Adjustments | Compensation Actually Paid to PEO | ||||||||||||||||||
| 2025 | $ | 485,516 | $ | - | $ | 242,640 | $ | $ | $ | 728,156 | ||||||||||||||
| 2024 | $ | 732,846 | $ | - | $ | 1,899,789 | $ | $ | $ | 2,632,635 | ||||||||||||||
| 2023 | $ | 1,615,172 | $ | (660,541 | ) | $ | 2,259,322 | $ | - | $ | - | $ | 3,213,953 | |||||||||||
The table below reconciles the amount of compensation reported for our PEO Sam Klepfish to the amount of compensation actually paid:
| Year | Reported Summary Compensation Table Total for PEO Sam Klepfish | Reported Value of Equity Awards (4) | Equity Award Adjustments (5) | Reported Change in the Actuarial Present Value of Pension Benefits | Pension Benefit Adjustments | Compensation Actually Paid to PEO Sam Klepfish | ||||||||||||||||||
| 2025 | $ | - | $ | - | $ | - | $ | $ | $ | - | ||||||||||||||
| 2024 | $ | - | $ | - | $ | - | $ | - | $ | - | $ | - | ||||||||||||
| 2023 | $ | 1,988,891 | $ | (40,681 | ) | $ | 40,681 | $ | - | $ | - | $ | 1,988,891 | |||||||||||
| (4) | The grant date fair value of equity awards represents the total of the amounts reported in the “Stock Awards” and “Option Awards” columns in the Summary Compensation Table for the applicable year. |
| (5) | The equity award adjustments for each applicable year include the addition (or subtraction, as applicable) of the following: (i) the year-end fair value of any equity awards granted in the applicable year that are outstanding and unvested as of the end of the year; (ii) the amount of change as of the end of the applicable year (from the end of the prior fiscal year) in fair value of any awards granted in prior years that are outstanding and unvested as of the end of the applicable year; (iii) for awards that are granted and vest in the same applicable year, the fair value as of the vesting date; (iv) for awards granted in prior years that vest in the applicable year, the amount equal to the change as of the vesting date (from the end of the prior fiscal year) in fair value; (v) for awards granted in prior years that are determined to fail to meet the applicable vesting conditions during the applicable year, a deduction for the amount equal to the fair value at the end of the prior fiscal year; and (vi) the dollar value of any dividends or other earnings paid on stock in the applicable year prior to the vesting date that are not otherwise reflected in the fair value of such award or included in any other component of total compensation for the applicable year. The valuation assumptions used to calculate fair values did not materially differ from those disclosed at the time of grant. |
The amounts deducted or added in calculating the equity award adjustments for our PEO Gary Schubert are as follows:
| Year | Year End Fair Remain Unvested | Year Over Year Change in Fair Value of Outstanding and Unvested Equity Awards That Were Granted in a Prior Fiscal Year | Fair Value as of Vesting Date of Equity Awards Granted and Vested in the Year | Year Over Year Change in Fair Value of Equity Awards Granted in Prior Years that Vested in the Year | Fair Value at the End of the Prior Year of Equity Awards that Failed to Meet Vesting Conditions in the Year | Value of Dividends or other Earnings Paid on Stock or Option Awards not Otherwise Reflected in Fair Value or Total Compensation | Total Equity Award Adjustments | |||||||||||||||||||||
| 2025 | $ | - | $ | (221,459 | ) | $ | - | $ | 52,947 | $ | - | $ | - | $ | (168,512 | ) | ||||||||||||
| 2024 | $ | - | $ | - | $ | - | $ | - | $ | - | $ | - | $ | - | ||||||||||||||
| 2023 | $ | - | $ | - | $ | - | $ | - | $ | - | $ | - | $ | - | ||||||||||||||
The amounts deducted or added in calculating the equity award adjustments for our PEO Robert W. (Bill) Bennett are as follows:
| Year | Year End Fair Remain Unvested | Year Over Year Change in Fair Value of Outstanding and Unvested Equity Awards That Were Granted in a Prior Fiscal Year | Fair Value as of Vesting Date of Equity Awards Granted and Vested in the Year | Year Over Year Change in Fair Value of Equity Awards Granted in Prior Years that Vested in the Year | Fair Value at the End of the Prior Year of Equity Awards that Failed to Meet Vesting Conditions in the Year | Value of Dividends or other Earnings Paid on Stock or Option Awards not Otherwise Reflected in Fair Value or Total Compensation | Total Equity Award Adjustments | |||||||||||||||||||||
| 2025 | $ | - | $ | - | $ | - | $ | 242,640 | $ | $ | $ | 242,640 | ||||||||||||||||
| 2024 | $ | - | $ | 510,158 | $ | - | $ | 1,389,631 | $ | $ | $ | 1,899,789 | ||||||||||||||||
| 2023 | $ | 1,631,824 | $ | - | $ | 627,498 | $ | - | $ | - | $ | - | $ | 2,259,322 | ||||||||||||||
The amounts deducted or added in calculating the equity award adjustments for our PEO Sam Klepfish are as follows:
| Year | Year End Fair Value of Equity Awards Granted During Applicable Fiscal Year that Remain Unvested as of Applicable Fiscal Year End | Year over Year Change in Fair Value of Outstanding and Unvested Equity Awards in a Prior Fiscal Year | Fair Value as of Vesting Date of Granted and Vested in the Year | Year Over Year Change in Fair Value of Equity Awards Granted in Prior Years that Vested in the Year | Fair Value at the Awards that Failed to Meet Vesting Conditions in the Year | Value of Dividends or other Earnings Paid on Stock Reflected in Fair Value or Total Compensation | Total Equity Awards Adjustments | |||||||||||||||||||||
| 2025 | $ | - | $ | - | $ | - | $ | - | $ | - | $ | - | $ | - | ||||||||||||||
| 2024 | $ | - | $ | - | $ | - | $ | - | $ | - | $ | - | $ | - | ||||||||||||||
| 2023 | $ | - | $ | - | $ | 40,681 | $ | - | $ | - | $ | - | $ | 40,681 | ||||||||||||||
The table below reconciles the average amount of compensation reported for our non-PEO NEOs to the average amount of compensation actually paid:
| Year | Average Reported Summary Compensation Table Total for Non-PEO NEOs | Average Reported Value of Equity Awards | Average Equity Award Adjustments | Average Reported Change in the Actuarial Present Value of Pension Benefits | Average Pension Benefit Adjustments | Average Compensation Actually Paid to Non-PEO NEOs | ||||||||||||||||||
| 2025 | $ | 442,285 | $ | - | $ | (1,454,142 | ) | $ | - | $ | - | $ | (1,011,857 | ) | ||||||||||
| 2024 | $ | 543,035 | $ | (119,374 | ) | $ | 1,939,817 | $ | - | $ | - | $ | 2,363,478 | |||||||||||
| 2023 | $ | 337,686 | $ | (52,437 | ) | $ | 181,556 | $ | - | $ | - | $ | 466,805 | |||||||||||
The amounts deducted or added in calculating the total average equity award adjustments are as follows:
| Year | Average Year End Fair Value of Equity Awards Granted During Applicable Fiscal Year that Remain Unvested as of Applicable Fiscal Year End | Year Over Year Average Change in Fair Value of Outstanding and Unvested Equity Awards That Were Granted In a Prior Fiscal Year | Average Fair Value as of Vesting Date of Equity Awards Granted and Vested in the Year | Year Over Year Average Change in Fair Value of Equity Awards Granted in Prior Years that Vested in the Year | Average Fair Value at the End of the Prior Year of Equity Awards that Failed to Meet Vesting Conditions in the Year | Average Value of Dividends or other Earnings Paid on Stock or Option Awards not Otherwise Reflected in Fair Value or Total Compensation | Total Average Equity Award Adjustments | |||||||||||||||||||||
| 2025 | $ | - | $ | (1,511,537 | ) | $ | - | $ | 57,395 | $ | $ | $ | (1,454,142 | ) | ||||||||||||||
| 2024 | $ | 800,817 | $ | 767,086 | $ | 91,760 | $ | 280,154 | $ | $ | $ | 1,939,817 | ||||||||||||||||
| 2023 | $ | 181,556 | $ | - | $ | - | $ | - | $ | - | $ | - | $ | 181,556 | ||||||||||||||
Compensation Actually Paid and Cumulative Total Shareholder Return (“TSR”)
As demonstrated by the following graph, the amount of total compensation actually paid to our CEOs and the average amount of compensation actually paid to the Company’s NEOs as a group (excluding our CEOs) is generally aligned with the Company’s cumulative TSR over the three years presented in the “Pay Versus Performance Table for 2025.” For additional information, see the section captioned “Executive Compensation” beginning on page 13 of this Proxy Statement.
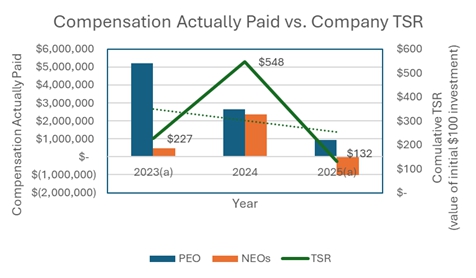
| a. | The 2023 and 2025 PEO bars include the combined compensation of the Company’s two CEOs who served during those years. |
Compensation Actually Paid and Net Income
As demonstrated by the following graph, the amount of total compensation actually paid to our CEOs and the average amount of compensation actually paid to the Company’s NEOs as a group (excluding our CEOs) is generally aligned with the Company’s net income over the three years presented in the “Pay Versus Performance Table for 2025.” The Company uses net income as a specific performance measure in the overall executive compensation program along with gross margin levels, which the Company considers a leading indicator of profitability over the long term. For additional information regarding the performance measures used to determine cash- and equity-based incentive compensation for the Company’s NEOs, see the section captioned “Executive Compensation” beginning on page 13 of this Proxy Statement.
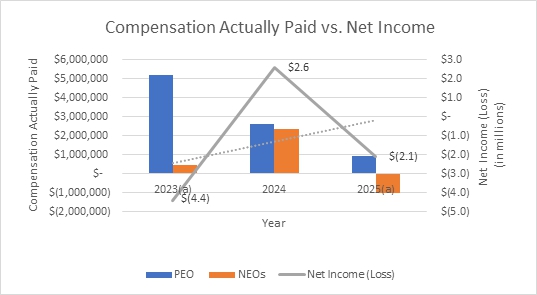
| a. | The 2023 and 2025 PEO bars include the combined compensation of the Company’s two CEOs who served during those years. |