Pay vs Performance Disclosure - USD ($)
Dec. 31, 2025
Dec. 31, 2024
Dec. 31, 2023
| Year | Summary Compensation Table for CEO1 ($) | Compensation Actually Paid to CEO1,2 ($) |
Average | Average Compensation Actually Paid to Non-CEO NEOs1,3 ($) | Value
of |
Net Income | ||||||||||||||||||
| 2025 | 975,531 | 1,238,703 | 699,914 | 855,226 | 147.05 | 19,205 | ||||||||||||||||||
| 2024 | 980,055 | 1,134,850 | 655,172 | 743,351 | 116.16 | 13,955 | ||||||||||||||||||
| 2023 | 891,500 | 893,256 | 494,245 | 495,626 | 101.23 | 11,843 | ||||||||||||||||||
| 1 | For the years 2025 and 2024 in the above table, the CEO is Michael C. Crapps, president and chief executive officer, and the Non-CEO NEOs are J. Ted Nissen, executive vice president and chief banking officer, and D. Shawn Jordan, executive vice president and chief financial officer. For the years 2023 in the above table, the CEO is Michael C. Crapps, president and chief executive officer, and the Non-CEO NEOs are J. Ted Nissen, executive vice president and chief banking officer, and Tanya A. Butts, former executive vice president and chief operations/risk officer. |
| 2 | This column represents the “compensation actually paid” to our CEO for each year, determined by starting with the amount set forth in the Summary Compensation Table (“SCT”) in the column entitled “Total Compensation” for the applicable year and adjusting that amount as follows (totaling $263,172, $154,795 and $1,756 for the years 2025, 2024 and 2023, respectively): |
| - | Increase for fair value of awards granted during year that remain unvested as of year-end |
| o | 2025 = $24,170 |
| o | 2024 = $58,888 |
| o | 2023 = $8,847 |
| - | Increase / decrease for change in fair value from prior year-end to current year-end of awards granted prior to year that were outstanding and unvested as of year-end |
| o | 2025 = $180,787 |
| o | 2024 = $46,949 |
| o | 2023 = ($5,153) |
| - | Increase / decrease for change in fair value from prior year-end to vesting date of awards granted prior to year that vested during year |
| o | 2025 = $58,215 |
| o | 2024 = $48,958 |
| o | 2023 = ($1,938) |
| 3 | This column represents the “compensation actually paid” to our Non-CEO NEOs for each year, determined by starting with the amount set forth in the SCT in the column entitled “Total Compensation” for the applicable year (and taking the average of those amounts for the non-CEO NEOs) and adjusting that amount as follows (totaling $155,312, $88,179 and $1,381 for the years 2025, 2024 and 2023, respectively): |
| - | Increase for fair value of awards granted during year that remain unvested as of year-end |
| o | 2025 = $16,250 |
| o | 2024 = $34,642 |
| o | 2023 = $4,845 |
| - | Increase / decrease for change in fair value from prior year-end to current year-end of awards granted prior to year that were outstanding and unvested as of year-end |
| o | 2025 = $106,239 |
| o | 2024 = $26,484 |
| o | 2023 = ($675) |
| - | Increase / decrease for change in fair value from prior year-end to vesting date of awards granted prior to year that vested during year |
| o | 2025 = $32,823 |
| o | 2024 = $27,053 |
| o | 2023 = ($2,789) |
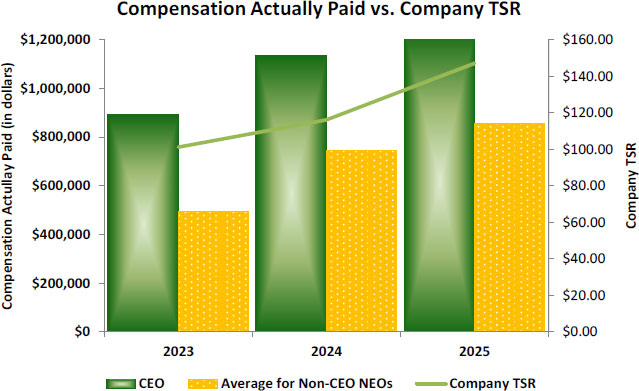
| 4 | Total Shareholder Return assumes $100 was invested in our common stock on December 31, 2022 and assumes the reinvestment of all cash dividends prior to any tax effect and retention of all stock dividends. |
The graph below shows the relationship between the compensation actually paid to our CEO and the average compensation actually paid to our non-CEO NEOs and our TSR.
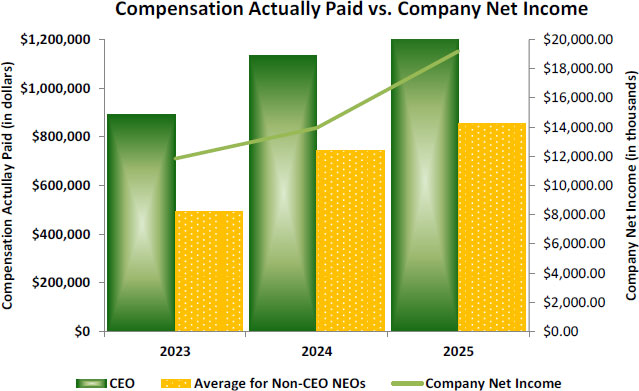
Relationship Between Compensation Actually Paid and Our Net Income
The graph below shows the relationship between the compensation actually paid to our CEO and the average compensation actually paid to our non-CEO NEOs and our net income.
| [1] | For the years 2025 and 2024 in the above table, the CEO is Michael C. Crapps, president and chief executive officer, and the Non-CEO NEOs are J. Ted Nissen, executive vice president and chief banking officer, and D. Shawn Jordan, executive vice president and chief financial officer. For the years 2023 in the above table, the CEO is Michael C. Crapps, president and chief executive officer, and the Non-CEO NEOs are J. Ted Nissen, executive vice president and chief banking officer, and Tanya A. Butts, former executive vice president and chief operations/risk officer. |
| [2] | This column represents the “compensation actually paid” to our CEO for each year, determined by starting with the amount set forth in the Summary Compensation Table (“SCT”) in the column entitled “Total Compensation” for the applicable year and adjusting that amount as follows (totaling $263,172, $154,795 and $1,756 for the years 2025, 2024 and 2023, respectively): |
| [3] | This column represents the “compensation actually paid” to our Non-CEO NEOs for each year, determined by starting with the amount set forth in the SCT in the column entitled “Total Compensation” for the applicable year (and taking the average of those amounts for the non-CEO NEOs) and adjusting that amount as follows (totaling $155,312, $88,179 and $1,381 for the years 2025, 2024 and 2023, respectively): |
| [4] | Total Shareholder Return assumes $100 was invested in our common stock on December 31, 2022 and assumes the reinvestment of all cash dividends prior to any tax effect and retention of all stock dividends. |