Pay-Versus-Performance Disclosure
As required by Item 402(v) of Regulation S-K, we are providing the following information about the relationship between the compensation actually paid (or “CAP”) to our Named Executive Officers ("NEOs”) and required financial performance measures. For a more complete explanation of “pay for performance” philosophy and how executive compensation aligns with our performance, please refer to “Executive Compensation – Compensation Discussion and Analysis.”
Pay-Versus-Performance Table
|
Value of Initial Fixed $100 Investment Based On: (5) |
||||||||
|
Fiscal Year |
Summary Compensation Table Total for PEO Alan H. Auerbach (1) |
Compensation Actually Paid to PEO Alan H. Auerbach (2) |
Average Summary Compensation Table Total for non-PEO NEOs (3) |
Average Compensation Actually Paid to non-PEO NEOs (4) |
PBYI Total Shareholder Return |
Peer Group Total Shareholder Return (6) |
Net Income ($) |
Company-Selected Measure (Product Revenue, net) (7) |
|
2025 |
$3,062,337 | $4,428,395 | $1,259,594 | $1,404,367 | $58 | $125 | $31,111,000 | $204,074,000 |
|
2024 |
$3,969,931 | $2,549,176 | $1,297,384 | $846,583 | $30 | $93 | $30,278,000 | $195,186,000 |
|
2023 |
$2,944,748 | $2,802,956 | $1,216,273 | $1,176,749 | $42 | $94 | $21,591,000 | $203,107,000 |
|
2022 |
$2,532,761 | $3,249,847 | $982,214 | $1,174,336 | $41 | $90 | $2,000 | $200,023,000 |
|
2021 |
$18,453,610 | $14,666,241 | $1,478,175 | $462,002 | $30 | $100 | ($29,126,000) | $189,064,000 |
| (1) | The dollar amounts represent the amount of total compensation reported for Alan H. Auerbach (our “PEO”) for each covered fiscal year in the “Total” column of the Summary Compensation Table for each applicable year. Please refer to “Executive Compensation – Executive Compensation Tables – 2025 Summary Compensation Table.” |
| (2) | The dollar amounts reported represent the amount of CAP of Alan H. Auerbach, as computed in accordance with Item 402(v) of Regulation S-K for each covered fiscal year. The dollar amounts do not reflect the actual amount of compensation earned or received by or paid to Alan H. Auerbach during the applicable fiscal year. No adjustment is made for dividends (if any were paid) as dividends are factored into the fair value of the award. In accordance with the requirements of Item 402(v) of Regulation S-K, the below adjustments were made to Alan H. Auerbach’s Summary Compensation Table Total Compensation for the 2025 fiscal year to determine the CAP for him for 2025. |
|
Fiscal Year |
Executives |
SCT(a) | Grant Date Value of New Awards(b) | Year End Value of New Awards(c) | Change in Value of Unvested Awards Granted in Prior Fiscal Years(d) | Change in Value of Vested Awards Granted in Prior Fiscal Years(e) | Fair Value of Vested Awards Granted and Vested in Current Fiscal Year(f) | Fair Value at Start of Fiscal Year of Awards That Failed to Meet Vesting Conditions(g) | CAP(h) |
|
2025 |
PEO: Alan H. Auerbach |
$3,062,337 | ($1,087,062) | $1,830,211 | $237,656 | $32,917 | $352,335 | $0 | $4,428,395 |
|
non-PEO NEOs |
$1,259,594 | ($287,500) | $347,659 | $38,394 | $5,320 | $64,863 | ($23,963) | $1,404,367 |
|
(a) |
The dollar amounts reported in the Summary Compensation Table for the applicable year. |
|
(b) |
The grant date fair value of equity awards represents the total of the amounts reported in the “Stock Awards” and “Option Awards” columns of the Summary Compensation Table for the applicable year. |
|
(c) |
The year-end fair value of any equity awards granted in the applicable year that are outstanding and unvested as of the end of the applicable year; |
|
(d) |
The amount of change as of the end of the applicable year (from the end of the prior fiscal year) in fair value of any awards granted in prior years that are outstanding and unvested as of the end of the applicable year; |
|
(e) |
For awards that vest in the applicable year, the change in the fair value as of the vesting date from the beginning of the applicable year; |
|
(f) |
For awards that failed to meet vesting conditions in the applicable year, the fair value from the end of prior fiscal year; and |
|
(g) |
For awards that failed to meet vesting conditions in the applicable year, the fair value from the end of prior fiscal year. |
|
(h) |
The CAP does not necessarily represent cash and/or equity value transferred to the applicable NEO without restriction, but rather is a value calculated under applicable SEC rules. |
|
Fiscal Year |
Executives |
SCT(a) | Grant Date Value of New Awards(b) | Year End Value of New Awards(c) | Change in Value of Unvested Awards Granted in Prior Fiscal Years(d) | Change in Value of Vested Awards Granted in Prior Fiscal Years(e) | Fair Value of Vested Awards Granted and Vested in Current Fiscal Year(f) | Fair Value at Start of Fiscal Year of Awards That Failed to Meet Vesting Conditions(g) | CAP(h) |
|
2025 |
PEO: Alan H. Auerbach |
$3,062,337 | ($1,087,062) | $1,830,211 | $237,656 | $32,917 | $352,335 | $0 | $4,428,395 |
|
non-PEO NEOs |
$1,259,594 | ($287,500) | $347,659 | $38,394 | $5,320 | $64,863 | ($23,963) | $1,404,367 |
|
(a) |
The dollar amounts reported in the Summary Compensation Table for the applicable year. |
|
(b) |
The grant date fair value of equity awards represents the total of the amounts reported in the “Stock Awards” and “Option Awards” columns of the Summary Compensation Table for the applicable year. |
|
(c) |
The year-end fair value of any equity awards granted in the applicable year that are outstanding and unvested as of the end of the applicable year; |
|
(d) |
The amount of change as of the end of the applicable year (from the end of the prior fiscal year) in fair value of any awards granted in prior years that are outstanding and unvested as of the end of the applicable year; |
|
(e) |
For awards that vest in the applicable year, the change in the fair value as of the vesting date from the beginning of the applicable year; |
|
(f) |
For awards that failed to meet vesting conditions in the applicable year, the fair value from the end of prior fiscal year; and |
|
(g) |
For awards that failed to meet vesting conditions in the applicable year, the fair value from the end of prior fiscal year. |
|
(h) |
The CAP does not necessarily represent cash and/or equity value transferred to the applicable NEO without restriction, but rather is a value calculated under applicable SEC rules. |
Analysis of Information Presented in Pay-Versus-Performance Table
As described in more detail in “Executive Compensation – Compensation Discussion and Analysis,” our executive compensation program reflects a variable “pay-for-performance” philosophy. While over the years we have used different performance measures to align executive compensation with our performance, all of these performance measures are not presented in the Pay-Versus-Performance Table. Moreover, while we generally seek to prioritize long-term performance as our primary incentive for Alan H. Auerbach and our other Named Executive Officers, we do not specifically align our performance measures with CAP (as computed in accordance with Item 402(v) of Regulation S-K) for a particular fiscal year. In accordance with Item 402(v) of Regulation S-K, we are providing the following descriptions of the relationships between the information presented in the Pay-Versus-Performance Table.
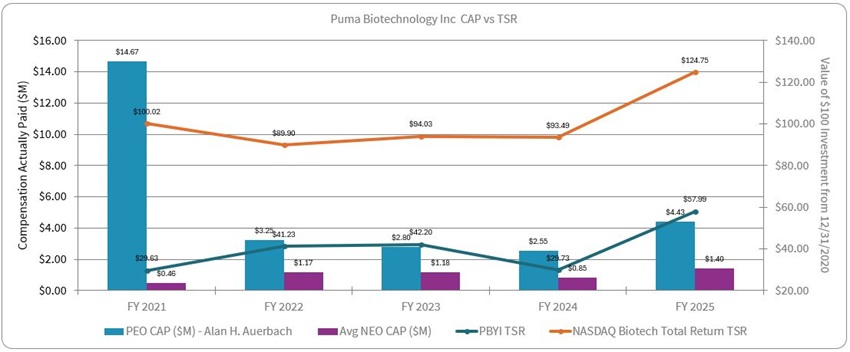
CAP Compared to Company and Peer Group TSR
The following graph sets forth the relationship between (i) the CAP for Alan H. Auerbach and the average CAP for our other NEOs as a group (except Alan H. Auerbach) and (ii) our TSR and the TSR of our peer group, the NASDAQ Biotechnology Index, over the periods presented in the Pay-Versus-Performance Table.
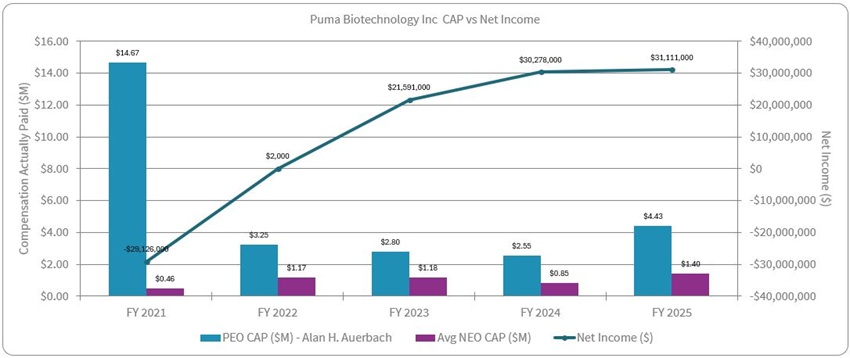
CAP Compared to Net Income
The following graph sets forth the relationship between (i) the CAP for Alan H. Auerbach and the average CAP for our other NEOs as a group (except Alan H. Auerbach) and (ii) our Net Income over the periods presented in the Pay-Versus-Performance Table.
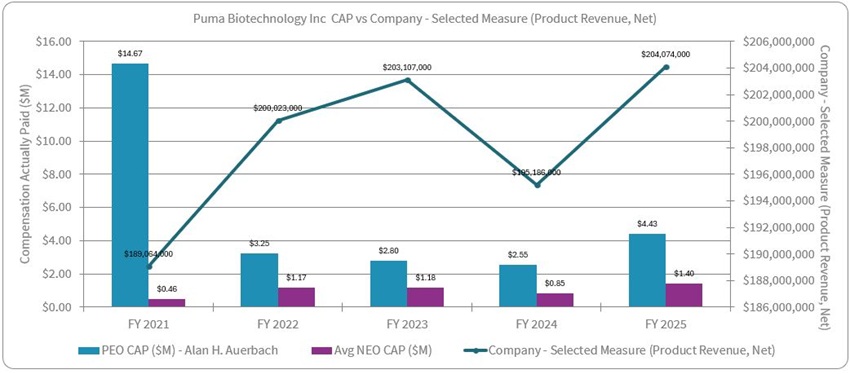
CAP Compared to Product Revenue, net
The following graph sets forth the relationship between (i) the CAP for Alan H. Auerbach and the average CAP for our other NEOs as a group (except Alan H. Auerbach) and (ii) Product Revenue, net over the periods presented in the Pay-Versus-Performance Table.
Tabular List of Financial Performance Measures
The most important financial and non-financial performance measures that link CAP to our performance are as follows:
| • | Bottles of NERLYNX sold | |
| • | Product revenue, net (which reflects bottles of NERLYNX sold, less gross-to-net deductions) | |
| • | Royalty revenue | |
|
• |
Cash management | |
|
• |
Alisertib clinical milestones |
Additional information about each of these performance measures and the role of our performance in each of these measures in determining our executive compensation are discussed in greater detail in “Executive Compensation – Compensation Discussion and Analysis.”