Pay vs Performance Disclosure - USD ($)
Jan. 31, 2026
Feb. 01, 2025
Feb. 03, 2024
Jan. 28, 2023
Jan. 29, 2022
| Pay versus Performance | ||||||||||||||||||||||||||
| Year | Summary Compensation Table Total for PEO(1) | Compensation Actually Paid to PEO(3) | Average Summary Compensation Table Total for Non-PEO NEOs(2) | Average Compensation Actually Paid to Non-PEO NEOs(3) | Value of Initial Fixed $100 Investment Based On: | Net Income ($000) | Pre-Tax Earnings ($000) | |||||||||||||||||||
| Total Shareholder Return | Peer Group Total Shareholder Return(4) | |||||||||||||||||||||||||
| 2025 | $ | 17,406,705 | $ | 29,424,552 | $ | 7,345,548 | $ | 10,081,910 | $ | 179 | $ | 209 | $ | 2,145,044 | $ | 2,842,157 | ||||||||||
| 2024 | $ | 16,994,251 | $ | 22,248,191 | $ | 18,106,568 | $ | 19,259,807 | $ | 141 | $ | 173 | $ | 2,090,730 | $ | 2,757,154 | ||||||||||
| 2023 | $ | 18,094,944 | $ | 32,986,019 | $ | 8,413,633 | $ | 11,031,541 | $ | 134 | $ | 135 | $ | 1,874,520 | $ | 2,471,781 | ||||||||||
| 2022 | $ | 11,335,069 | $ | 11,165,315 | $ | 4,347,931 | $ | 5,456,168 | $ | 110 | $ | 121 | $ | 1,512,041 | $ | 1,987,489 | ||||||||||
| 2021 | $ | 15,989,635 | $ | 16,497,110 | $ | 6,292,515 | $ | 5,601,094 | $ | 87 | $ | 111 | $ | 1,722,589 | $ | 2,258,540 | ||||||||||
a.2025: William W. Sheehan II, Michael Balmuth, Michael J. Hartshorn, Karen Fleming, and Adam Orvos.
b.2024: Adam Orvos, James G. Conroy, Michael Balmuth, and Michael J. Hartshorn.
c.2023: Adam Orvos, Michael Balmuth, Michael J. Hartshorn, and Stephen Brinkley.
d.2022: Adam Orvos, Michael J. Hartshorn, Michael Kobayashi, and Brian Morrow.
e.2021: Adam Orvos, Michael J. Hartshorn, Michael Kobayashi, Brian Morrow, Michael Balmuth, and Travis Marquette.
| Adjustments Table | ||||||||||||||||||||||||||
| Year | NEO | Grant Date Fair Value of Equity Awards Granted During Applicable Year(1) | Year-End Fair Value of Equity Awards Granted During Applicable Year(2) | Change in Fair Value as of Year-End of Any Prior Year Awards that Remain Unvested as of Year-End(3) | Change in Fair Value as of the Vesting Date of Any Prior Year Awards that Vested During Applicable Year(4) | Change in Fair Value as of Year-End of Any Awards Forfeited During Applicable Year(5) | Value of Dividends or other Earnings Paid on Stock not Otherwise Reflected in Fair Value or Total Compensation(6) | Total Adjustments Reflected in Compensation Actually Paid | ||||||||||||||||||
| 2025 | PEO | $ | (10,650,100) | $ | 16,694,204 | $ | 5,838,186 | $ | (219,118) | $ | — | $ | 354,674 | $ | 12,017,847 | |||||||||||
| Average non-PEO NEOs | $ | (4,060,111) | $ | 6,234,996 | $ | 1,744,537 | $ | (456,400) | $ | (832,567) | $ | 105,908 | $ | 2,736,363 | ||||||||||||
| 2024 | PEO | $ | (10,700,209) | $ | 13,918,519 | $ | 1,494,763 | $ | 184,815 | $ | — | $ | 356,052 | $ | 5,253,940 | |||||||||||
| Average non-PEO NEOs | $ | (13,112,524) | $ | 13,788,393 | $ | 218,273 | $ | 169,959 | $ | — | $ | 89,138 | $ | 1,153,239 | ||||||||||||
| 2023 | PEO | $ | (10,700,095) | $ | 22,796,125 | $ | 4,064,656 | $ | (1,575,360) | $ | — | $ | 305,749 | $ | 14,891,075 | |||||||||||
| Average non-PEO NEOs | $ | (3,875,104) | $ | 5,844,040 | $ | 731,856 | $ | (149,678) | $ | — | $ | 66,794 | $ | 2,617,908 | ||||||||||||
| 2022 | PEO | $ | (9,800,093) | $ | 4,316,812 | $ | 5,269,903 | $ | (281,593) | $ | — | $ | 325,216 | $ | (169,755) | |||||||||||
| Average non-PEO NEOs | $ | (2,750,090) | $ | 2,084,209 | $ | 1,744,487 | $ | (86,429) | $ | — | $ | 116,060 | $ | 1,108,237 | ||||||||||||
| 2021 | PEO | $ | (9,800,128) | $ | 12,088,760 | $ | (3,281,621) | $ | 1,240,177 | $ | — | $ | 260,287 | $ | 507,475 | |||||||||||
| Average non-PEO NEOs | $ | (2,975,067) | $ | 3,364,001 | $ | (635,040) | $ | 264,203 | $ | (771,203) | $ | 61,685 | $ | (691,421) | ||||||||||||
Note: For each year, we have re-valued performance share awards at their final settlement payout level following the performance period that aligns with our fiscal year.
(1)Deduct the amounts shown in the “Stock Awards” column in the Summary Compensation Table with respect to awards granted during the applicable fiscal year.
(2)For awards granted in the covered fiscal year which are outstanding and unvested at year-end, add the Fair Value as of the end of the applicable year.
(3)For awards granted in the prior fiscal years that are outstanding and unvested at the end of the applicable year, add (or subtract) the amount equal to the changes in Fair Value as of the end of the applicable year (from the end of the prior year).
(4)For awards granted in prior fiscal years that vested during the applicable year, add (or subtract) the amount equal to the changes in Fair Value as of the vesting date (from the end of the prior year).
(5)For awards forfeited in the applicable fiscal year, subtract the amount equal to the Fair Value at the end of the prior year.
(6)Add the dollar value of any dividends paid on stock awards in the applicable year if prior to the vesting date.
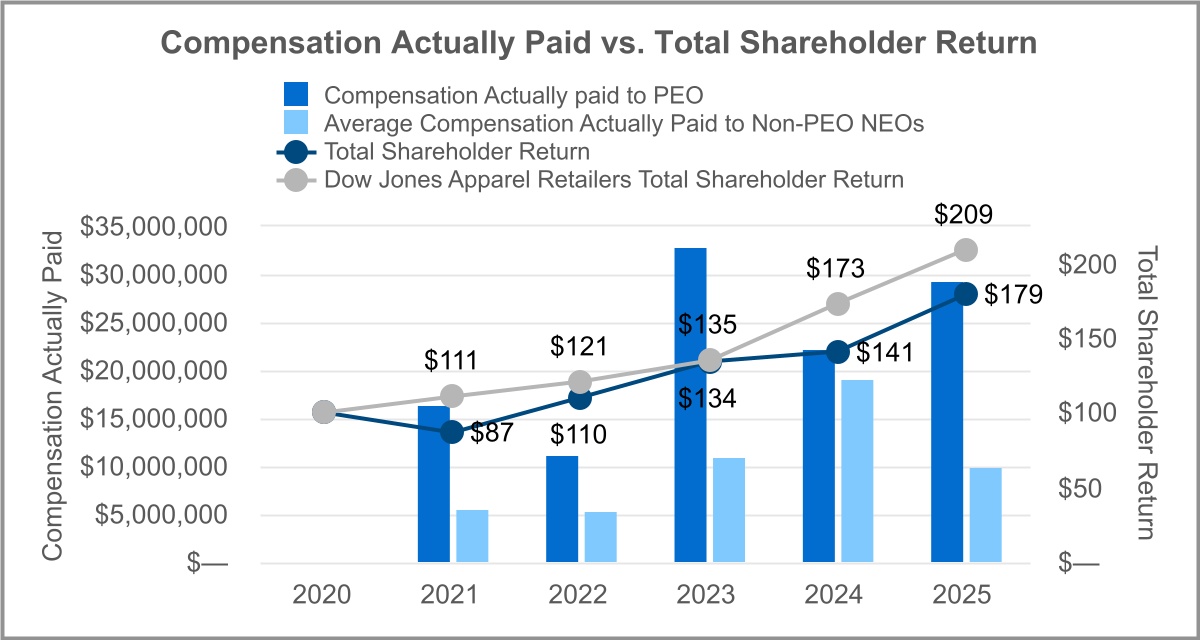
The chart below shows the relationship between Compensation Actually Paid to our PEO and our other NEOs to our total shareholder return during fiscal 2021, 2022, 2023, 2024, and 2025, indexed to the end of fiscal 2020. We have also included the Total Shareholder Return of the Dow Jones Apparel Retailers Index (Item 5 of our Annual Report on Form 10-K) on this chart for the same period.
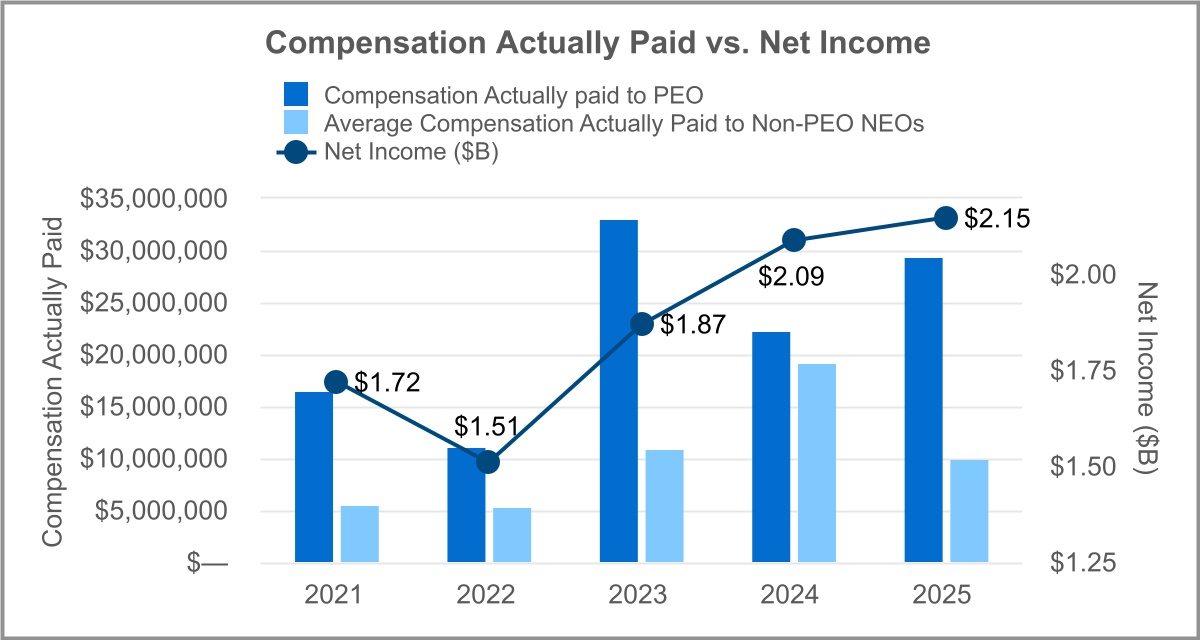
The chart below shows the relationship between Compensation Actually Paid to our PEO and our other NEOs to our net income during fiscal 2021, 2022, 2023, 2024, and 2025.
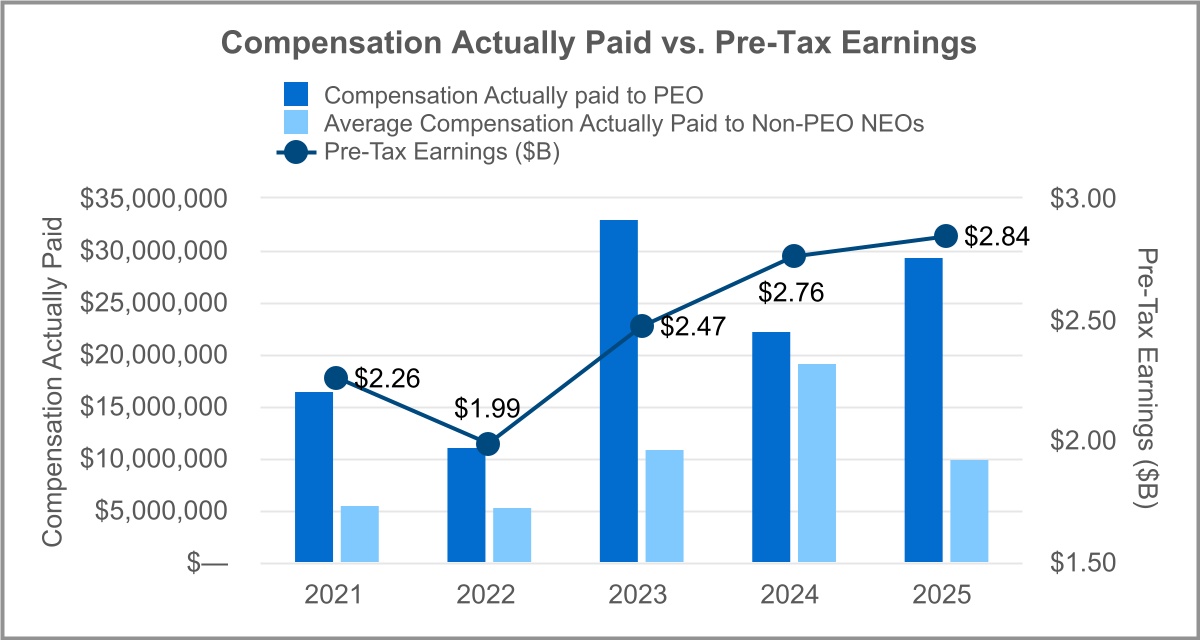
The chart below shows the relationship between Compensation Actually Paid to our PEO and our other NEOs to our pre-tax earnings during fiscal 2021, 2022, 2023, 2024, and 2025.
The chart below shows the relationship between Compensation Actually Paid to our PEO and our other NEOs to our total shareholder return during fiscal 2021, 2022, 2023, 2024, and 2025, indexed to the end of fiscal 2020. We have also included the Total Shareholder Return of the Dow Jones Apparel Retailers Index (Item 5 of our Annual Report on Form 10-K) on this chart for the same period.
| Most Important Performance Measure | ||
| Pre-Tax Earnings | ||
The table below includes the most important financial measure that we use to link compensation actually paid to our NEOs to our company performance for fiscal 2025. We have listed pre-tax earnings as the sole financial performance measure. Pre-tax earnings is a GAAP-disclosed metric and serves as the starting point for adjusted pre-tax earnings, which is the key and only metric used under our annual cash incentive bonus program and for our performance share awards applicable to the NEOs who received grants in fiscal 2025. The Compensation
Committee selected adjusted pre-tax earnings as the metric in our incentive compensation plans because the Committee believes that measure is the key driver of stockholder value in the Company’s business.