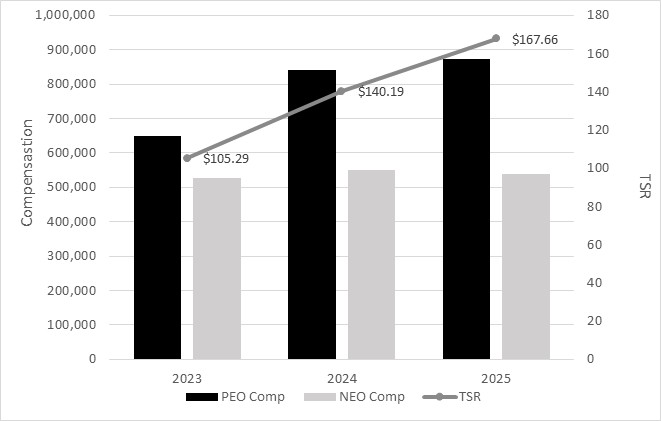
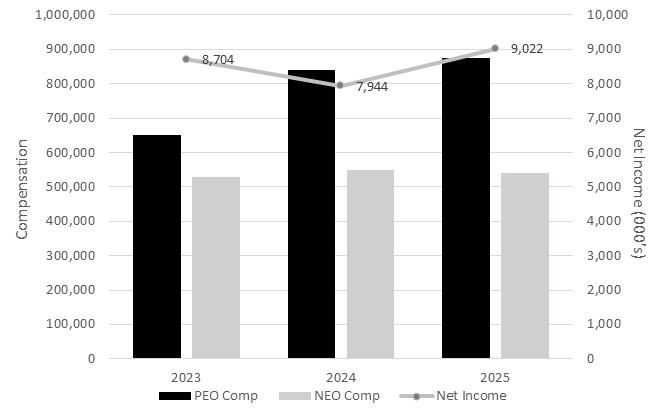
As required by Item 402(v) of Regulation S-K, the following table presents information regarding compensation actually paid (“CAP”) to the Company’s Principal Executive Officer (“PEO”) and the average compensation actually paid to the Company’s other Named Executive Officers (“Non-PEO NEOs”), as compared to the Company’s cumulative total shareholder return (“TSR”) and net income for the fiscal years ended December 31, 2025, 2024, and 2023.
For purposes of this disclosure, Robert R. Chapman III served as the Company’s Principal Executive Officer for each of the years presented. The Company’s Non-PEO NEOs for 2025, 2024, and 2023 were J. Todd Scruggs and Michael A. Syrek.
Because the Company did not grant any equity awards during 2025, 2024, or 2023 and the Named Executive Officers held no outstanding or unvested equity awards during those years, no equity-related adjustments were required in determining compensation actually paid under Item 402(v).
Accordingly, compensation actually paid for each Named Executive Officer for each year presented is equal to the total compensation reported in the Summary Compensation Table.
|
|
|
|
|
|
|
Pay-Versus-Performance Table | ||||||
Year | Summary Compensation Table Total for PEO ($)(1) | Compensation Actually Paid to PEO($)(3) | Average Summary Compensation table total for Non-PEO NEOs($)(2) | Average Compensation Actually Paid to Non-PEO NEOs($)(3) | Value of Initial Fixed Investment Based on Total Shareholder Return($) (4) | Net Income($) (000’s) (5) |
2025 | $ 873,895 | $ 873,895 | $ 538,897 | $ 538,897 | $ 167.66 | $ 9,022 |
2024 | 839,936 | 839,936 | 550,051 | 550,051 | 140.19 | 7,944 |
2023 | 650,513 | 650,513 | 527,855 | 527,855 | 105.29 | 8,704 |
(1)Robert R. Chapman III was the Registrant’s Principal Executive Officer (PEO) for each of the 2025, 2024, and 2023 fiscal years.
(2)For the 2025, 2024, and 2023 fiscal years, the Registrant’s Non-PEO NEOs were J. Todd Scruggs and Michael A. Syrek.
(3)No adjustments were required by Item 402(v) of Regulation S-K to total compensation for any year presented in determining compensation actually paid. The 2024 and Summary Compensation Table totals used in this table reflect corrected Salary Continuation Plan expense accrual amounts as described in footnote (4) to the Summary Compensation Table above, which also affect the 2024 and 2023 average Non-PEO NEO compensation shown in this table.
(4)Represents the cumulative total return on a hypothetical $100 investment in the Company’s Common Stock made on December 31, 2022, through the end of the applicable fiscal year, calculated in accordance with Item 201(e) of Regulation S-K, assuming reinvestment of dividends.
(5)As reported on the Registrant’s Consolidated Statements of Income for the applicable fiscal year, as provided under Part II, Item 8, of the Registrant’s Annual Report on Form 10-K.
(2)For the 2025, 2024, and 2023 fiscal years, the Registrant’s Non-PEO NEOs were J. Todd Scruggs and Michael A. Syrek.
|
|
|
|
|
|
|
|
| Equity Award Adjustments -PEO |
| |
Year | Summary Compensation | Reported Value of | Year End Fair Value of | Change in Fair Value of | Compensation Actually |
2025 | 873,895 | - | - | - | 873,895 |
2024 | 839,936 | - | - | - | 839,936 |
2023 | 650,513 | - | - | - | 650,513 |
|
|
|
|
|
|
|
|
| Equity Award Adjustments -Non-PEO NEOs |
| |
Year | Summary compensation table total for Non-PEO NEOs ($) (1) | Reported Value of | Year End Fair Value of | Change in Fair Value of | Compensation actually paid to Non-PEO NEOs ($) |
2025 | 538,897 | - | - | - | 538,897 |
2024 | 550,051 | - | - | - | 550,051 |
2023 | 527,855 | - | - | - | 527,855 |