|
|
|
|
|
|
|
|
|
|
|
|
|
|
|
|
|
|
|
|
| Average Summary | Average |
|
|
|
|
| Summary | Compensation | Compensation | Compensation |
| Peer Group |
|
|
| Compensation | Actually | Table Total | Actually Paid | Total | Total | Net |
|
| Table for | Paid to | For Non-PEO | Non-PEO | Shareholder | Shareholder | Income | Adjusted |
| PEO | PEO | NEOs | NEOs | Return | Return | (000) | EPS |
Year | ($) | ($)(1) | ($)(1) | ($)(2) | ($) | ($)(3) | ($)(a) | ($)(b)(4) |
|
|
|
|
|
|
|
|
|
2025 | 12,904,720 | 4,075,434 | 3,385,471 | 1,872,406 | 81.68 | 182.29 | 265,238 | 22.61 |
2024 | 12,769,564 | 6,002,636 | 3,551,842 | 1,385,989 | 122.41 | 190.22 | 301,999 | 23.85 |
2023 | 12,625,106 | 19,202,131 | 3,681,708 | 5,745,392 | 134.68 | 151.02 | 272,509 | 21.21 |
2022 | 11,609,033 | 10,125,511 | 3,852,849 | 3,590,451 | 117.23 | 126.17 | 249,624 | 19.91 |
2021 | 11,659,622 | 13,278,416 | 3,807,705 | 4,473,652 | 121.14 | 128.47 | 268,550 | 20.25 |
|
|
|
|
|
|
|
|
|
(a)U.S. GAAP, as reported.
(b)Adjusted Earnings Per Shares as used to calculated key executive incentive compensation, as shown on page 19.
|
|
|
|
Named Executive Officers | Years Included |
|
|
Kevin J. McNamara (PEO) | 2021-2025 |
Michael D. Witzeman | 2021-2025 |
Nicholas M. Westfall | 2021-2025 |
Spencer S. Lee | 2021-2025 |
Joel L. Wherley | 2025 |
Brian C. Judkins | 2024-2025 |
David P. Williams | 2021-2023 |
|
|
|
ABM Industries, Inc. |
| Option Care Health, Inc. |
Acadia Healthcare Co., Inc. |
| Pediatrix Medical Group |
Addus Homecare Corp. |
| (formerly MEDNAX, INC.) |
AMN Healthcare Services, Inc. |
| RadNet, Inc. |
Brookdale Senior Living, Inc. |
| Rollins, Inc. |
Clean Harbors, Inc. |
| Select Medical Holdings Corp. |
Comfort Systems USA, Inc. |
| Surgery Partners, Inc. |
Encompass Health Corp. |
| Team, Inc. |
Healthcare Services Group, Inc. |
| Tetra Tech, Inc. |
National Healthcare Corp. |
| The Ensign Group, Inc. |
|
|
|
|
|
|
|
|
|
|
|
|
PEO | 12/31/2021 | 12/31/2022 | 12/31/2023 | 12/31/2024 | 12/31/2025 |
|
|
|
|
|
|
|
|
|
|
|
|
Summary Compensation Table Total | $11,659,622 | $11,609,033 | $12,625,106 | $12,769,564 | $12,904,720 |
|
|
|
|
|
|
|
|
|
|
|
|
Aggregate change in the actuarial present value of pension | (39,857) | (31,266) | (25,165) | (14,969) | (30,181) |
Actuarially determined service costs of pension | 26,356 | 26,356 | 26,356 | 26,356 | 26,356 |
Values reported in the stock awards column on |
|
|
|
|
|
Summary Compensation Table | (1,893,990) | (2,135,216) | (2,511,638) | (2,375,477) | (2,883,553) |
Values reported in the stock options column on |
|
|
|
|
|
Summary Compensation Table | (3,566,649) | (3,744,820) | (4,200,094) | (4,619,937) | (5,036,021) |
Year-end fair value for stock awards granted in covered fiscal year |
|
|
|
|
|
(outstanding and unvested) | 2,987,111 | 2,510,610 | 3,221,154 | 2,315,424 | 678,638 |
Year-end fair value for stock options granted in covered fiscal year |
|
|
|
|
|
(outstanding and unvested) | 4,986,266 | 4,944,102 | 5,933,790 | 3,143,815 | 4,524,779 |
Prior year stock awards fair value (CY vs. PY change only) | (1,042,355) | (1,545,245) | 1,317,900 | (1,496,915) | (3,288,531) |
Prior year stock options fair value (CY vs. PY change only) | 161,912 | (1,508,043) | 2,814,722 | (3,745,225) | (2,820,773) |
Total adjustments | 1,618,794 | (1,483,522) | 6,577,025 | (6,766,928) | (8,829,286) |
|
|
|
|
|
|
Total Compensation Actually Paid | $13,278,416 | $10,125,511 | $19,202,131 | $6,002,636 | $4,075,434 |
|
|
|
|
|
|
NEO | 12/31/2021 | 12/31/2022 | 12/31/2023 | 12/31/2024 | 12/31/2025 |
|
|
|
|
|
|
|
|
|
|
|
|
Summary Compensation Table Total | $3,807,705 | $3,852,849 | $3,681,708 | $3,551,842 | $3,385,471 |
|
|
|
|
|
|
|
|
|
|
|
|
Aggregate change in the actuarial present value of pension | (9,130) | (7,162) | (5,765) | (1,699) | (2,740) |
Actuarially determined service costs of pension | 6,038 | 6,038 | 6,038 | 2,991 | 2,393 |
Values reported in the stock awards column on |
|
|
|
|
|
Summary Compensation Table | (479,222) | (545,942) | (592,308) | (535,270) | (438,469) |
Values reported in the stock options column on |
|
|
|
|
|
Summary Compensation Table | (1,347,630) | (1,409,987) | (1,055,725) | (1,420,707) | (1,111,337) |
Year-end fair value for stock awards granted in covered fiscal year |
|
|
|
|
|
(outstanding and unvested) | 755,806 | 641,924 | 759,630 | 521,738 | 97,205 |
Year-end fair value for stock options granted in covered fiscal year |
|
|
|
|
|
(outstanding and unvested) | 1,884,025 | 1,861,536 | 1,491,502 | 966,775 | 998,518 |
Prior year stock awards fair value (CY vs. PY change only) | (189,503) | (391,251) | 336,753 | (547,263) | (760,263) |
Prior year stock options fair value (CY vs. PY change only) | 45,563 | (417,554) | 1,123,559 | (1,152,418) | (298,372) |
Total adjustments | 665,947 | (262,398) | 2,063,684 | (2,165,853) | (1,513,065) |
|
|
|
|
|
|
Total Compensation Actually Paid | $4,473,652 | $3,590,451 | $5,745,392 | $1,385,989 | $1,872,406 |
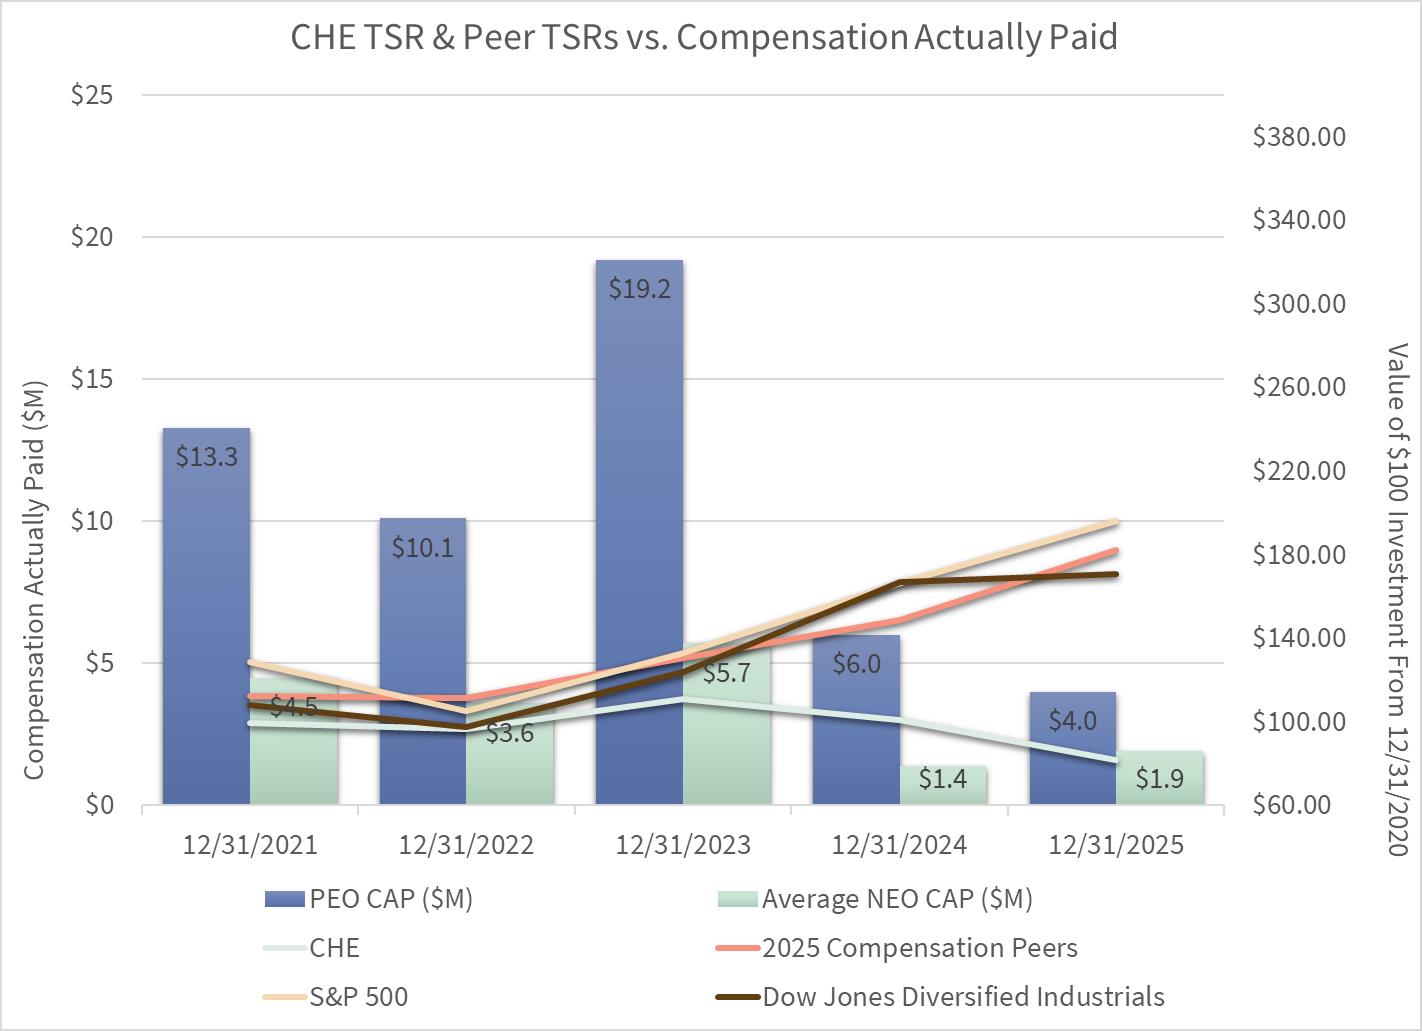
Below is a graph showing the relationship of Compensation Actually Paid to our Chief Executive Officer and other named excecutive officers in 2021, 2022, 2023, 2024 and 2025 to the TSR of Chemed Corporation, the S&P 500 and the Dow Jones Diversified Industrials. Compensation Actually Paid as required under SEC rules, reflects adjusted values to unvested and vested equity awards during the years shown in the table based on year-end stock prices, various accounting valuations assumptions and projected performance modifers but does not reflect actual amounts paid for those awards.
|
|
Measure | Explanation |
Adjusted Earnings Per Share | A non-GAAP measure that consists of diluted net income per share that is then adjusted to eliminate the effect of certain items that the Compensation Committee determines in its discretion should be excluded for compensation purposes.
|
Total Stockholder Return | A measure of financial performance, indicating the total amount a stockholder earns from an investment in the Company. Based on the change in stock price over a given period of time, and assuming the reinvestment of dividends.
|
Return on Assets | A financial ratio that indicates how profitable the Company is in relation to its total assets.
|