Pay vs Performance Disclosure
|
12 Months Ended |
|
Dec. 31, 2025
USD ($)
|
Dec. 31, 2024
USD ($)
|
Dec. 31, 2023
USD ($)
|
Dec. 31, 2022
USD ($)
|
Dec. 31, 2021
USD ($)
|
| Pay vs Performance Disclosure |
|
|
|
|
|
| Pay vs Performance Disclosure, Table |
| | | | | | | | | | | | | | | | | | | | | | | | | | | | | | | | | | | | | | | | | | | | | | | | | | | | | | | | | | | | | | | Year(1) | | Summary Compensation Table Total for PEO Joseph W. Dziedzic ($) | | Compensation Actually Paid to PEO Joseph W. Dziedzic(2)
($) | | Summary Compensation Table Total for PEO Payman Khales ($) | | Compensation Actually Paid to PEO Payman Khales(2)
($) | | Average Summary Compensation Table Total for Non-PEO NEOs ($) | | Average Compensation Actually Paid to Non-PEO NEOs(2) ($) | | Value of Initial Fixed $100 Investment Based On: | | Net Income
(thousands)
($) | | Organic Sales Growth(5) (%) | | | | | | | | Total Shareholder Return(3) ($) | | Peer Group Total Shareholder Return(4) ($) | | | | | | | | | | | | | | | | | | | | | | | | | 2025 | | 8,671,332 | | | (5,377,560) | | | 3,211,860 | | | (1,660,895) | | | 1,903,359 | | | 470,718 | | | 96.60 | | | 116.30 | | | 102,808 | | | 6.4 | | 2024 | | 8,675,379 | | | 23,575,569 | | | — | | | — | | | 1,979,423 | | | 3,664,889 | | | 163.22 | | | 108.93 | | | 119,896 | | | 7.3 | | 2023 | | 8,738,497 | | | 25,228,291 | | | — | | | — | | | 1,969,459 | | | 2,431,453 | | | 122.03 | | 100.29 | | | 90,650 | | | 15.0 | | 2022 | | 11,495,237 | | | 9,908,982 | | | — | | | — | | | 2,010,130 | | | 1,937,603 | | | 84.32 | | 97.17 | | | 66,377 | | | 6.5 | | 2021 | | 6,922,075 | | | 5,987,158 | | | — | | | — | | | 1,456,322 | | | 1,337,867 | | | 105.42 | | 121.04 | | | 96,808 | | | 13.2 |
|
|
|
|
|
| Named Executive Officers, Footnote |
The following table lists the PEO and non-PEO NEOs for 2025, 2024, 2023, 2022 and 2021: | | | | | | | | | | | | | | | | Year | | PEO | | Non-PEO NEOs | 2025
| | Joseph W. Dziedzic, Payman Khales | | Diron Smith, Lindsay K. Blackwood, Andrew Senn and Jim Stephens
| | 2024 | | Joseph W. Dziedzic | | Diron Smith, John Harris, Payman Khales and Jim Stephens | 2023
| | Joseph W. Dziedzic
| | Diron Smith, Payman Khales, McAlister Marshall, Kirk Thor, Jason K. Garland and Jennifer M. Bolt | | 2022 | | Joseph W. Dziedzic | | Jason K. Garland, Jennifer M. Bolt, Carter Houghton and Payman Khales | | 2021 | | Joseph W. Dziedzic | | Jason K. Garland, Joel Becker, Jennifer M. Bolt and Payman Khales |
|
|
|
|
|
| Peer Group Issuers, Footnote |
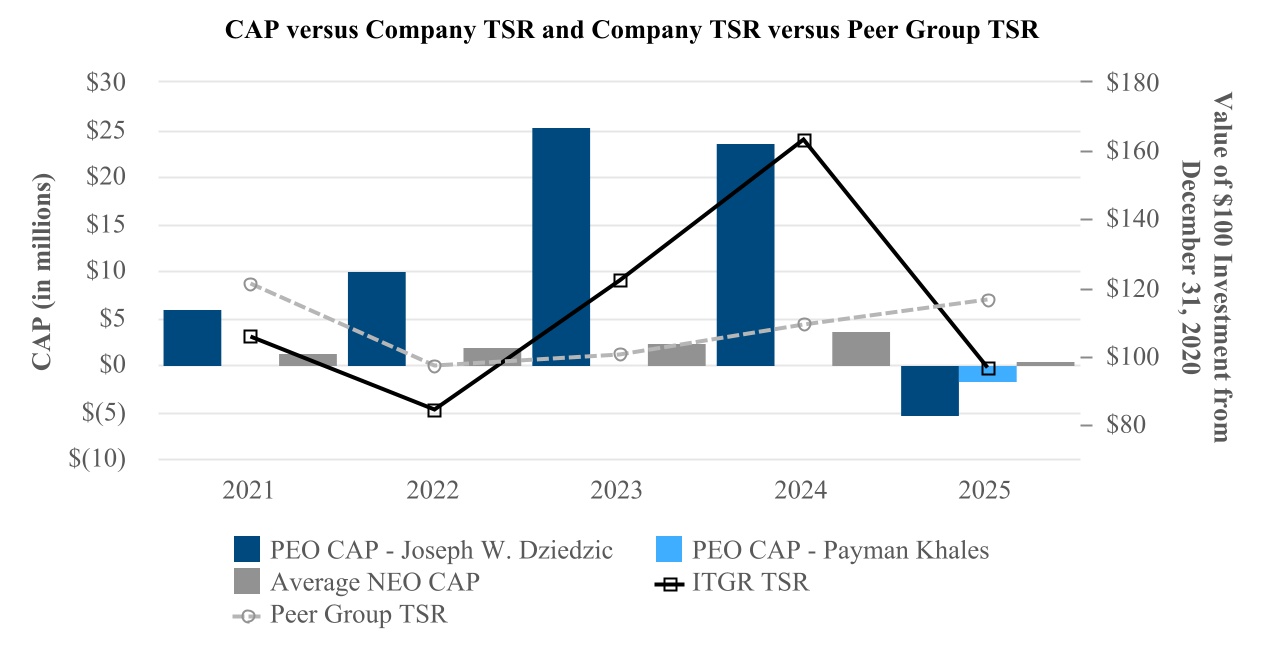
The Peer Group Total Shareholder Return column shows the value at each year end (including dividend reinvestment, to the extent applicable) of $100 invested on December 31, 2020 in the iShares US Medical Devices EFT, which aligns with the Peer Group used in our Annual Report on Form 10-K for the year ended December 31, 2025.
|
|
|
|
|
| PEO Total Compensation Amount |
|
$ 8,675,379
|
$ 8,738,497
|
$ 11,495,237
|
$ 6,922,075
|
| Adjustment To PEO Compensation, Footnote |
Compensation Actually Paid (“CAP”) does not necessarily reflect compensation actually earned, realized, or received by the PEO or the non-PEO NEOs, but reflects adjustments made to the Summary Compensation Table totals for the PEO and non-PEO NEOs in accordance with Item 402(v) of Regulation S-K as set forth below. The valuation assumptions used to calculate fair value, or change in fair value, as applicable, were made in accordance with FASB ASC Topic 718 and the valuation assumptions did not materially differ from those disclosed at the time of the grant. | | | | | | | | | | | | | | | | | | | | | | | | | | | Summary Compensation Table Total to CAP Reconciliation | | | Fiscal Year 2025 | | Names | | Reported Summary Compensation Table Total ($) | | Minus: Reported Summary Compensation Table Value of Equity Awards ($) | | Plus: Equity Award Adjustments ($)(i) | | Compensation Actually Paid ($) | | Joseph W. Dziedzic | | 8,671,332 | | | 5,999,951 | | | (8,048,941) | | | (5,377,560) | | | Payman Khales | | 3,211,860 | | | 2,149,878 | | | (2,722,877) | | | (1,660,895) | | Average for Non-PEO NEOs | | 1,903,359 | | | 1,124,887 | | | (307,754) | | | 470,718 | | | | | | | | | | | | | | | | | | | | | | | | | | | | | | | | | | | | | |
(i)The equity award adjustments were calculated in accordance with the methodology required by Item 402(v) of Regulation S-K. The amounts deducted or added in calculating the equity award adjustments for the PEO are provided in the table below. | | | | | | | | | | | | | | | | | | | | | | | | | | | | | | | | | | | | | | | | | Equity Award Adjustments | | | Fiscal Year 2025 | | Names | | Year End Fair Value of Awards Granted in the Year that remain Outstanding and Unvested as of the last day
of the Year
($) | | Year over Year Change in Fair Value of Outstanding and Unvested Awards ($) | | Fair Value as of Vesting Date of Awards Granted
and Vested in
the Year
($) | |
Change in Fair Value of Awards Granted in Prior Years that Vested in the Year ($) | |
Change in Fair Value of Awards Forfeited in the Year ($) | | Total Equity
Award
Adjustments
($) | | Joseph W. Dziedzic | | 3,173,418 | | | (11,236,620) | | | — | | | 14,261 | | | — | | | (8,048,941) | | | Payman Khales | | 1,437,788 | | | (4,167,788) | | | — | | | 7,123 | | | — | | | (2,722,877) | | Average for Non-PEO NEOs | | 630,930 | | | (940,367) | | | — | | | 1,683 | | | — | | | (307,754) | | | | | | | | | | | | | | | | | | | | | | | | | | | | | | | | | | | | | | | | | | | | | | | | | | | | | |
|
|
|
|
|
| Non-PEO NEO Average Total Compensation Amount |
$ 1,903,359
|
|
|
|
|
| Non-PEO NEO Average Compensation Actually Paid Amount |
$ 470,718
|
|
|
|
|
| Compensation Actually Paid vs. Total Shareholder Return |
|
|
|
|
|
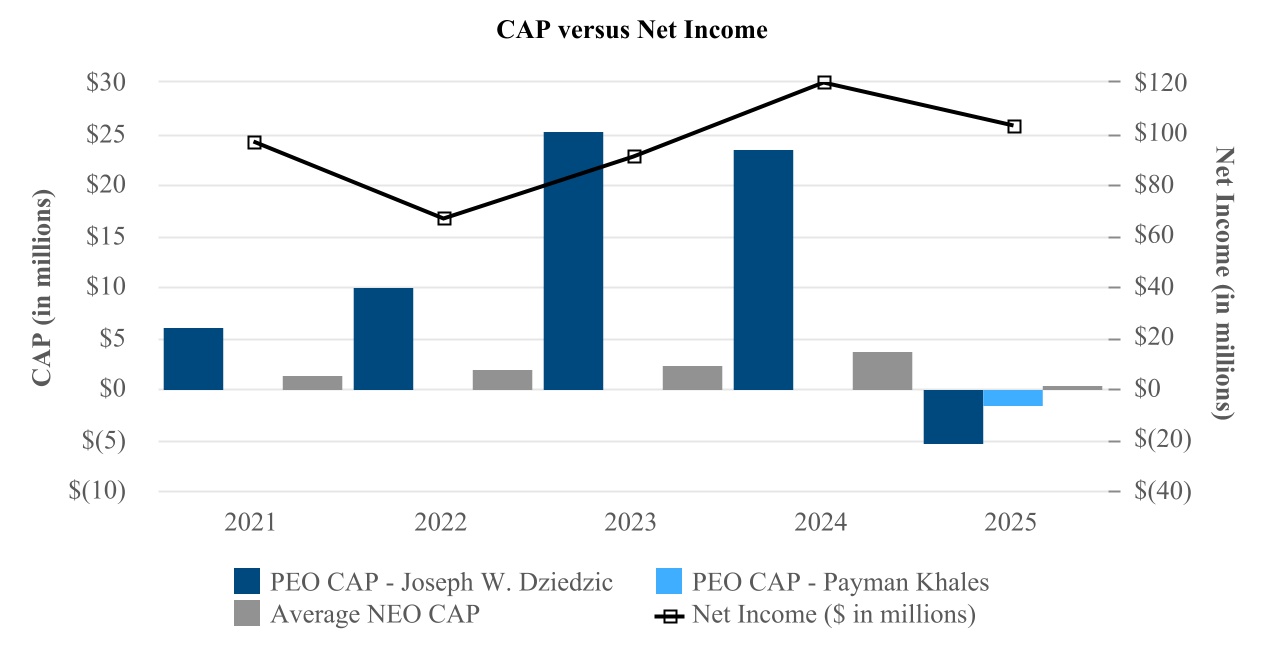
| Compensation Actually Paid vs. Net Income |
Relationship Between PEO & Average Non-PEO NEO CAP and Net Income
|
|
|
|
|
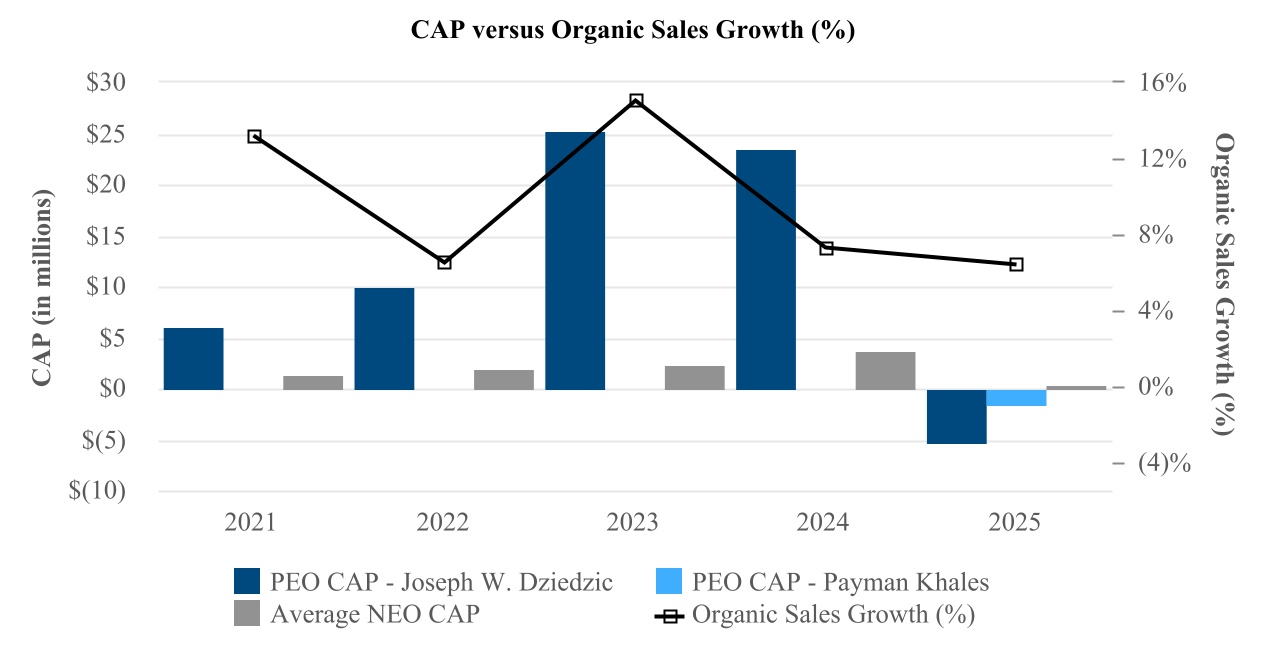
| Compensation Actually Paid vs. Company Selected Measure |
Relationship Between PEO & Average Non-PEO NEO CAP and Organic Sales Growth
|
|
|
|
|
| Total Shareholder Return Vs Peer Group |
|
|
|
|
|
| Tabular List, Table |
| | | Organic Sales Growth | Relative TSR | STI AOI | | | | |
|
|
|
|
|
| Total Shareholder Return Amount |
$ 96.60
|
163.22
|
122.03
|
84.32
|
105.42
|
| Peer Group Total Shareholder Return Amount |
116.30
|
108.93
|
100.29
|
97.17
|
121.04
|
| Net Income (Loss) |
$ 102,808,000
|
$ 119,896,000
|
$ 90,650,000
|
$ 66,377,000
|
$ 96,808,000
|
| Company Selected Measure Amount |
0.064
|
0.073
|
0.150
|
0.065
|
0.132
|
| PEO Name |
|
Joseph W. Dziedzic
|
Joseph W. Dziedzic
|
Joseph W. Dziedzic
|
Joseph W. Dziedzic
|
| Additional 402(v) Disclosure |
The Total Shareholder Return column shows the value at each year end (including dividend reinvestment, to the extent applicable) of $100 invested in our common stock on December 31, 2020.
|
|
|
|
|
| Measure:: 1 |
|
|
|
|
|
| Pay vs Performance Disclosure |
|
|
|
|
|
| Name |
Organic Sales Growth
|
|
|
|
|
| Non-GAAP Measure Description |
Organic Sales Growth is reported sales growth adjusted to remove the impact of foreign currency, acquisitions and strategic exits. To calculate the impact of foreign currency on sales growth rates, we convert any sale made in a foreign currency by converting current period sales into prior period sales using the exchange rate in effect at that time and then compare the two, negating any effect foreign currency had on our transactional revenue. For acquisitions, we exclude the impact on the growth rate attributable to the contribution of acquisitions in all periods where there were no comparable sales. For strategic exits, for all periods presented we exclude the impact on the growth rate attributable to sales from the market being exited.
|
|
|
|
|
| Measure:: 2 |
|
|
|
|
|
| Pay vs Performance Disclosure |
|
|
|
|
|
| Name |
Relative TSR
|
|
|
|
|
| Measure:: 3 |
|
|
|
|
|
| Pay vs Performance Disclosure |
|
|
|
|
|
| Name |
STI AOI
|
|
|
|
|
| Joseph W. Dziedzic [Member] |
|
|
|
|
|
| Pay vs Performance Disclosure |
|
|
|
|
|
| PEO Total Compensation Amount |
$ 8,671,332
|
|
|
|
|
| PEO Actually Paid Compensation Amount |
$ (5,377,560)
|
$ 23,575,569
|
$ 25,228,291
|
$ 9,908,982
|
$ 5,987,158
|
| PEO Name |
Joseph W. Dziedzic
|
|
|
|
|
| Payman Khales [Member] |
|
|
|
|
|
| Pay vs Performance Disclosure |
|
|
|
|
|
| PEO Total Compensation Amount |
$ 3,211,860
|
|
|
|
|
| PEO Actually Paid Compensation Amount |
$ (1,660,895)
|
|
|
|
|
| PEO Name |
Payman Khales
|
|
|
|
|
| PEO | Joseph W. Dziedzic [Member] | Aggregate Grant Date Fair Value of Equity Award Amounts Reported in Summary Compensation Table |
|
|
|
|
|
| Pay vs Performance Disclosure |
|
|
|
|
|
| Adjustment to Compensation, Amount |
$ (5,999,951)
|
|
|
|
|
| PEO | Joseph W. Dziedzic [Member] | Equity Awards Adjustments, Excluding Value Reported in Compensation Table |
|
|
|
|
|
| Pay vs Performance Disclosure |
|
|
|
|
|
| Adjustment to Compensation, Amount |
(8,048,941)
|
|
|
|
|
| PEO | Joseph W. Dziedzic [Member] | Year-end Fair Value of Equity Awards Granted in Covered Year that are Outstanding and Unvested |
|
|
|
|
|
| Pay vs Performance Disclosure |
|
|
|
|
|
| Adjustment to Compensation, Amount |
3,173,418
|
|
|
|
|
| PEO | Joseph W. Dziedzic [Member] | Year-over-Year Change in Fair Value of Equity Awards Granted in Prior Years That are Outstanding and Unvested |
|
|
|
|
|
| Pay vs Performance Disclosure |
|
|
|
|
|
| Adjustment to Compensation, Amount |
(11,236,620)
|
|
|
|
|
| PEO | Joseph W. Dziedzic [Member] | Vesting Date Fair Value of Equity Awards Granted and Vested in Covered Year |
|
|
|
|
|
| Pay vs Performance Disclosure |
|
|
|
|
|
| Adjustment to Compensation, Amount |
0
|
|
|
|
|
| PEO | Joseph W. Dziedzic [Member] | Change in Fair Value as of Vesting Date of Prior Year Equity Awards Vested in Covered Year |
|
|
|
|
|
| Pay vs Performance Disclosure |
|
|
|
|
|
| Adjustment to Compensation, Amount |
14,261
|
|
|
|
|
| PEO | Joseph W. Dziedzic [Member] | Prior Year End Fair Value of Equity Awards Granted in Any Prior Year that Fail to Meet Applicable Vesting Conditions During Covered Year |
|
|
|
|
|
| Pay vs Performance Disclosure |
|
|
|
|
|
| Adjustment to Compensation, Amount |
0
|
|
|
|
|
| PEO | Payman Khales [Member] | Aggregate Grant Date Fair Value of Equity Award Amounts Reported in Summary Compensation Table |
|
|
|
|
|
| Pay vs Performance Disclosure |
|
|
|
|
|
| Adjustment to Compensation, Amount |
(2,149,878)
|
|
|
|
|
| PEO | Payman Khales [Member] | Equity Awards Adjustments, Excluding Value Reported in Compensation Table |
|
|
|
|
|
| Pay vs Performance Disclosure |
|
|
|
|
|
| Adjustment to Compensation, Amount |
(2,722,877)
|
|
|
|
|
| PEO | Payman Khales [Member] | Year-end Fair Value of Equity Awards Granted in Covered Year that are Outstanding and Unvested |
|
|
|
|
|
| Pay vs Performance Disclosure |
|
|
|
|
|
| Adjustment to Compensation, Amount |
1,437,788
|
|
|
|
|
| PEO | Payman Khales [Member] | Year-over-Year Change in Fair Value of Equity Awards Granted in Prior Years That are Outstanding and Unvested |
|
|
|
|
|
| Pay vs Performance Disclosure |
|
|
|
|
|
| Adjustment to Compensation, Amount |
(4,167,788)
|
|
|
|
|
| PEO | Payman Khales [Member] | Vesting Date Fair Value of Equity Awards Granted and Vested in Covered Year |
|
|
|
|
|
| Pay vs Performance Disclosure |
|
|
|
|
|
| Adjustment to Compensation, Amount |
0
|
|
|
|
|
| PEO | Payman Khales [Member] | Change in Fair Value as of Vesting Date of Prior Year Equity Awards Vested in Covered Year |
|
|
|
|
|
| Pay vs Performance Disclosure |
|
|
|
|
|
| Adjustment to Compensation, Amount |
7,123
|
|
|
|
|
| PEO | Payman Khales [Member] | Prior Year End Fair Value of Equity Awards Granted in Any Prior Year that Fail to Meet Applicable Vesting Conditions During Covered Year |
|
|
|
|
|
| Pay vs Performance Disclosure |
|
|
|
|
|
| Adjustment to Compensation, Amount |
0
|
|
|
|
|
| Non-PEO NEO | Aggregate Grant Date Fair Value of Equity Award Amounts Reported in Summary Compensation Table |
|
|
|
|
|
| Pay vs Performance Disclosure |
|
|
|
|
|
| Adjustment to Compensation, Amount |
(1,124,887)
|
|
|
|
|
| Non-PEO NEO | Equity Awards Adjustments, Excluding Value Reported in Compensation Table |
|
|
|
|
|
| Pay vs Performance Disclosure |
|
|
|
|
|
| Adjustment to Compensation, Amount |
(307,754)
|
|
|
|
|
| Non-PEO NEO | Year-end Fair Value of Equity Awards Granted in Covered Year that are Outstanding and Unvested |
|
|
|
|
|
| Pay vs Performance Disclosure |
|
|
|
|
|
| Adjustment to Compensation, Amount |
630,930
|
|
|
|
|
| Non-PEO NEO | Year-over-Year Change in Fair Value of Equity Awards Granted in Prior Years That are Outstanding and Unvested |
|
|
|
|
|
| Pay vs Performance Disclosure |
|
|
|
|
|
| Adjustment to Compensation, Amount |
(940,367)
|
|
|
|
|
| Non-PEO NEO | Vesting Date Fair Value of Equity Awards Granted and Vested in Covered Year |
|
|
|
|
|
| Pay vs Performance Disclosure |
|
|
|
|
|
| Adjustment to Compensation, Amount |
0
|
|
|
|
|
| Non-PEO NEO | Change in Fair Value as of Vesting Date of Prior Year Equity Awards Vested in Covered Year |
|
|
|
|
|
| Pay vs Performance Disclosure |
|
|
|
|
|
| Adjustment to Compensation, Amount |
1,683
|
|
|
|
|
| Non-PEO NEO | Prior Year End Fair Value of Equity Awards Granted in Any Prior Year that Fail to Meet Applicable Vesting Conditions During Covered Year |
|
|
|
|
|
| Pay vs Performance Disclosure |
|
|
|
|
|
| Adjustment to Compensation, Amount |
$ 0
|
|
|
|
|