Pay vs Performance Disclosure
May 21, 2024
Dec. 31, 2024
Dec. 31, 2025
USD ($)
$ / shares
Dec. 31, 2024
USD ($)
$ / shares
Dec. 31, 2023
USD ($)
$ / shares
Dec. 31, 2022
USD ($)
$ / shares
Dec. 31, 2021
USD ($)
$ / shares
Pay Versus Performance
As required by Section 953(a) of the Dodd-Frank Wall Street Reform and Consumer Protection Act and Item 402(v) of Regulation S-K, the following disclosures provide information about the relationship between executive “Compensation Actually Paid” and the Company’s performance on select financial metrics. For further information regarding our executive compensation programs and our pay-for-performance philosophy, please refer to “Compensation Discussion and Analysis”.
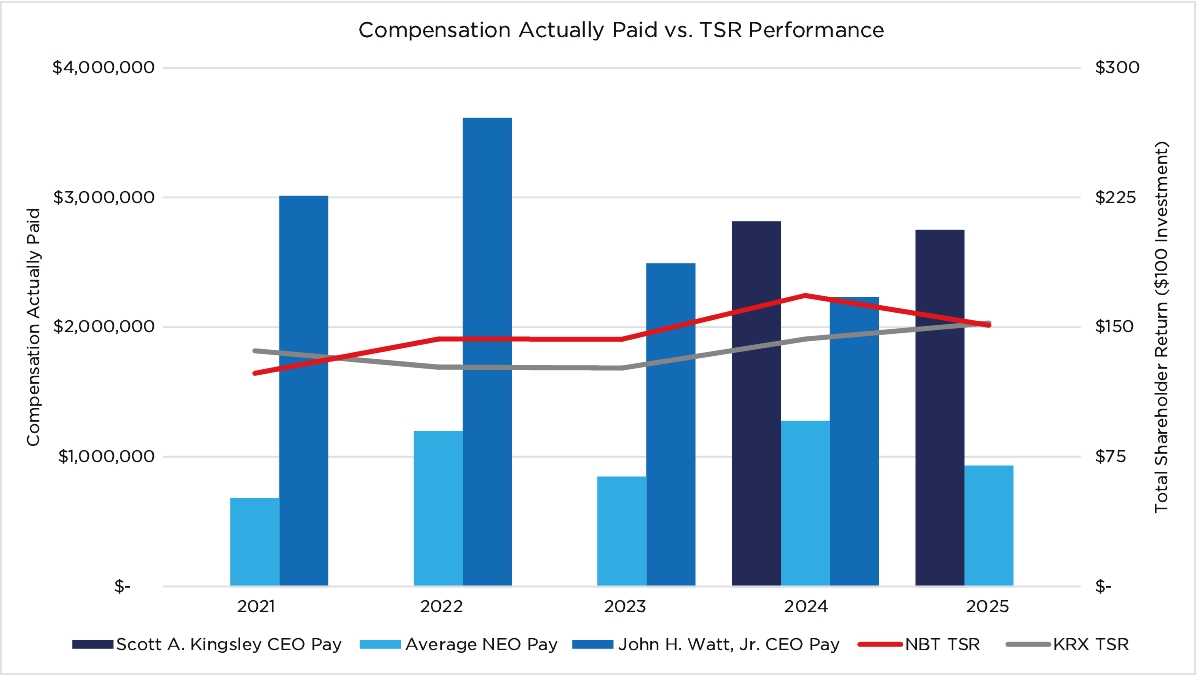
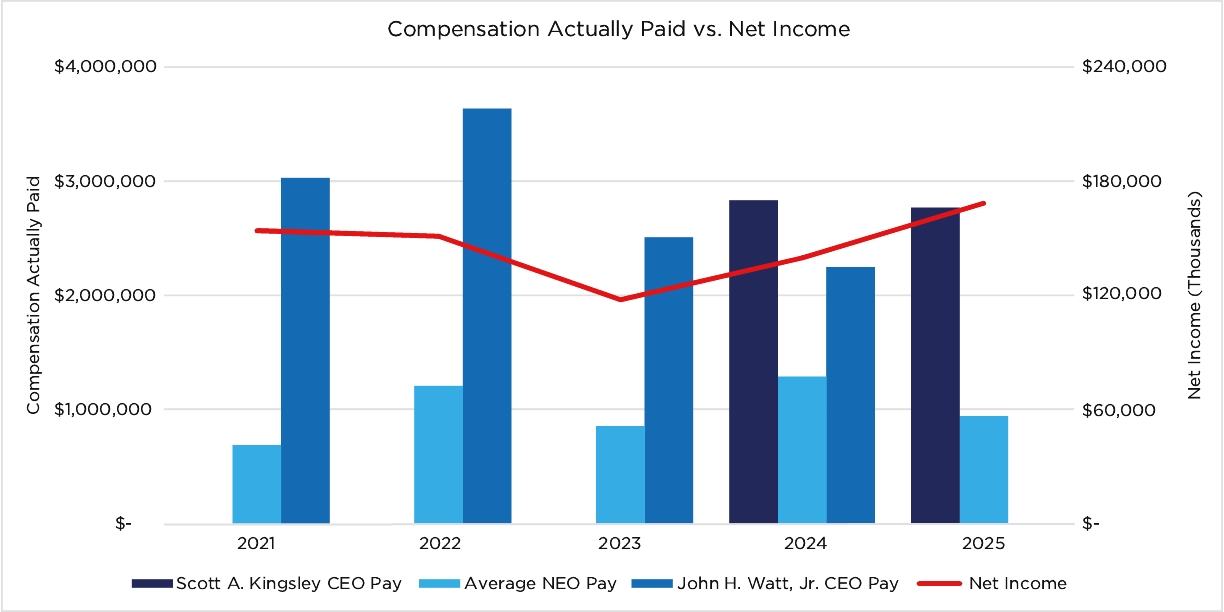
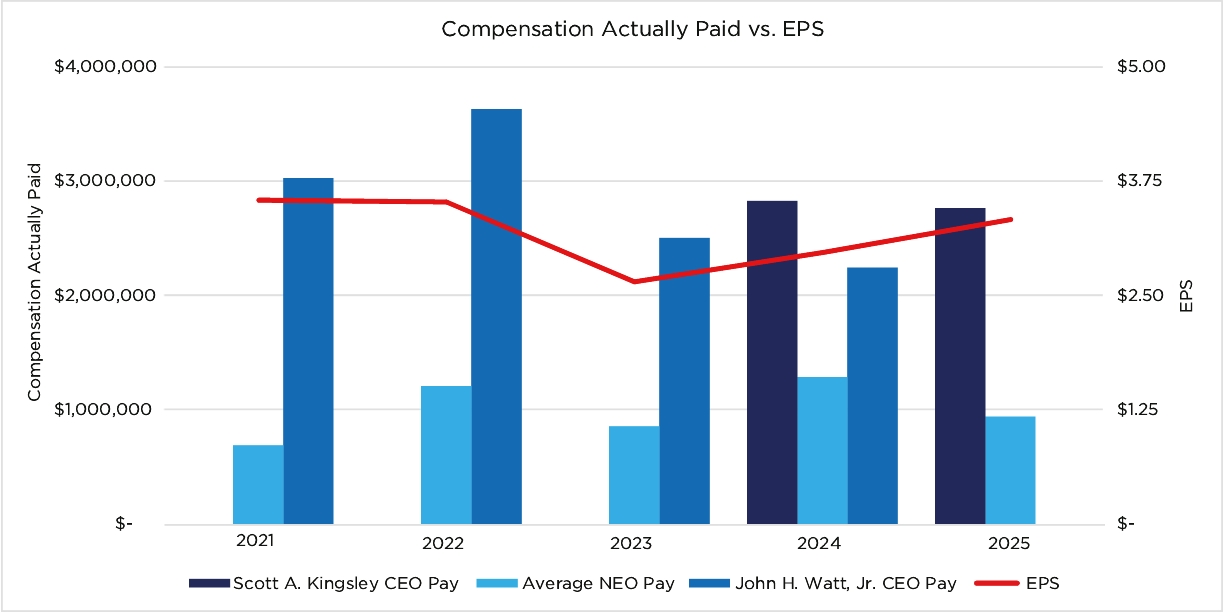
The following table sets forth the Compensation Actually Paid to the Company’s CEO and average Compensation Actually Paid to the Company’s other NEOs during 2021 through 2025, both as reported in the Summary Compensation Table and with certain adjustments to reflect the “Compensation Actually Paid”, as defined under SEC rules. In addition, the table provides our cumulative Total Shareholder Return (“TSR”), the cumulative TSR of our peer group TSR (using the KBW Regional Banking index), Net Income and EPS, which is the “company selected measure” chosen for purposes of this disclosure.
Year | Summary Compensation Table Total for CEO | Compensation Actually Paid to CEO (1) | Average Summary Compensation Table Total for Other NEOs(2) ($) | Average Compensation Actually Paid to Other NEOs(3) ($) | Value of Initial Fixed $100 Investment Based On: | Net Income(6) ($ thousands) | EPS(7) ($) | |||||||||||||||||||||||||
Scott A. Kingsley ($) | John H. Watt, Jr. ($) | Scott A. Kingsley ($) | John H. Watt, Jr. ($) | TSR(4) ($) | Peer Group TSR(5) ($) | |||||||||||||||||||||||||||
2025 | 2,990,037 | — | 2,753,440 | — | 1,057,971 | 937,193 | 151.44 | 152.74 | 169,235 | 3.33 | ||||||||||||||||||||||
2024 | 2,437,755 | 2,692,986 | 2,817,810 | 2,235,087 | 1,105,750 | 1,280,970 | 138.05 | 130.96 | 140,641 | 2.97 | ||||||||||||||||||||||
2023 | — | 2,522,200 | — | 2,494,953 | 793,495 | 851,280 | 117.35 | 115.69 | 118,782 | 2.65 | ||||||||||||||||||||||
2022 | — | 3,114,914 | — | 3,616,618 | 1,105,432 | 1,201,906 | 117.46 | 116.15 | 151,995 | 3.52 | ||||||||||||||||||||||
2021 | — | 2,766,141 | — | 3,014,358 | 653,695 | 685,710 | 101.22 | 124.78 | 154,885 | 3.54 | ||||||||||||||||||||||
(1) | The amounts shown above represent “Compensation Actually Paid” to Watt and Kingsley for each corresponding year which they served as CEO, in accordance with the requirements of Item 402(v) of Regulation S-K. For the years reported in the table Watt was CEO from January 2021 to May 2024 and Kingsley has been CEO since May 2024. The dollar amounts do not reflect the actual amount of compensation earned by or paid to Watt and Kingsley during the applicable year. The adjustments in the below table were made to Watt’s and Kingsley’s total compensation in the Summary Compensation Table for each year to determine the “Compensation Actually Paid” pursuant to Item 402(v) of Regulation S-K. |
(2) | These amounts reflect the average total compensation reported for the Company’s NEOs as a group (excluding Watt and Kingsley) in the “Total” column of the Summary Compensation Table in each applicable year. The names of each of the NEOs (excluding Watt and Kingsley) included for purposes of calculating the average amounts in each applicable year are as follows: (i) for 2025 and 2024 Burns, Stagliano, Mahoney and Wiles; (ii) for 2023 and 2022 Kingsley, Stagliano, Sparks and Mahoney; and (iii) for 2021 Kingsley, Moran, Stagliano, Burns, Halliday and Wiles. |
(3) | The amounts shown above represent “Compensation Actually Paid” to the other NEOs for each corresponding year, in accordance with the requirements of Item 402(v) of Regulation S-K. The dollar amounts do not reflect the actual amount of compensation earned by or paid to the other NEOs during the applicable year. The adjustments in the below table were made to the other NEOs total compensation in the Summary Compensation Table for each year to determine the “Compensation Actually Paid” pursuant to Item 402(v) of Regulation S-K. |
(4) | The amounts shown above represent the Company’s cumulative TSR on an assumed investment of $100 in shares of our common stock over the indicated measurement period. The cumulative TSR reported above was calculated by dividing the sum of the cumulative amount of dividends for the measurement period, assuming dividend reinvestment and the difference between our share price at the end and the beginning of the indicated measurement period by our share price at the beginning of the measurement period. |
(5) | The peer group for purposes of this table is the KBW Regional Banking Index (“KRX”), which is the same peer group disclosed in the Company’s Annual Report on Form 10-K. |
(6) | The dollar amounts reported represent the amount of net income reflected in the Company’s audited financial statements for the applicable year. |
(7) | The dollar amounts reported represent the amount of EPS reflected in the Company’s audited financial statements for the applicable year. |
The following table reconciles the Summary Compensation Table to the Pay Versus Performance Table above for the CEO. The valuation assumptions used to calculate fair values did not materially differ from those disclosed at the time of grant.
Scott A. Kingsley 2025 ($) | Scott A. Kingsley 2024 ($) | John H. Watt, Jr. 2024 ($) | John H. Watt, Jr. 2023 ($) | John H. Watt, Jr. 2022 ($) | John H. Watt, Jr. 2021 ($) | |||||||||||||||
Compensation from Summary Compensation Table | 2,990,037 | 2,437,755 | 2,692,986 | 2,522,200 | 3,114,914 | 2,766,141 | ||||||||||||||
Less Grant Date Fair Value of Stock Awards in Covered Year, as reported in the Summary Compensation Table | (663,375) | (628,585) | (718,354) | (685,744) | (718,779) | (725,136) | ||||||||||||||
Add the Fair Value of Equity Awards Granted During the Covered Year determined as of the end of the Covered Year | 613,700 | 911,161 | 933,405 | 892,414 | 854,897 | 719,074 | ||||||||||||||
Add Change in Fair Value of Equity Awards Granted in Prior Years that remain outstanding and unvested at the end of the Covered Year | (193,631) | 86,202 | 250,390 | (27,867) | 250,000 | 277,295 | ||||||||||||||
Change in Fair Value for Equity Awards Granted in Prior Years that vested in the Covered Year | 1,775 | 4,514 | (32,051) | 24,787 | 97,000 | 51,767 | ||||||||||||||
Less Aggregate Change in the Actuarial Pension Value of the Accumulated Benefit, as Reported in the Summary Compensation Table for the Covered Year | (792,981) | (157,092) | (1,216,039) | (585,612) | (255,176) | (317,897) | ||||||||||||||
Add pension value attributable to Covered Year’s service and any change in pension value attributable to plan amendments made in the Covered Year | 797,915 | 163,855 | 324,750 | 354,775 | 273,762 | 243,114 | ||||||||||||||
Compensation Actually Paid | 2,753,440 | 2,817,810 | 2,235,087 | 2,494,953 | 3,616,618 | 3,014,358 | ||||||||||||||
The following table reconciles the Summary Compensation Table to the Pay Versus Performance Table above for the other NEOs. The valuation assumptions used to calculate fair values did not materially differ from those disclosed at the time of grant.
2025 ($) | 2024 ($) | 2023 ($) | 2022 ($) | 2021 ($) | |||||||||||||
Compensation from Summary Compensation Table | 1,057,971 | 1,105,750 | 793,495 | 1,105,432 | 653,695 | ||||||||||||
Less Grant Date Fair Value of Stock Awards in Covered Year, as reported in the Summary Compensation Table | (242,823) | (307,739) | (234,913) | (275,923) | (150,859) | ||||||||||||
Add the Fair Value of Equity Awards Granted During the Covered Year determined as of the end of the Covered Year | 224,640 | 430,289 | 305,373 | 332,066 | 154,751 | ||||||||||||
Add Change in Fair Value of Equity Awards Granted in Prior Years that remain outstanding and unvested at the end of the Covered Year | (95,673) | 59,540 | (6,906) | 29,504 | 55,992 | ||||||||||||
Change in Fair Value for Equity Awards Granted in Prior Years that vested in the Covered Year | 167 | (7,796) | (1,266) | 9,779 | 27,030 | ||||||||||||
Less the fair value of any equity awards granted in a Prior Year that were forfeited in the Covered Year determined as of the end of the Prior Year | — | — | — | — | (52,969) | ||||||||||||
Less Aggregate Change in the Actuarial Pension Value of the Accumulated Benefit, as Reported in the Summary Compensation Table for the Covered Year | (10,455) | (2,212) | (8,753) | (1,535) | (5,097) | ||||||||||||
Add pension value attributable to Covered Year’s service and any change in pension value attributable to plan amendments made in the Covered Year | 3,366 | 3,138 | 4,250 | 2,583 | 3,167 | ||||||||||||
Compensation Actually Paid | 937,193 | 1,280,970 | 851,280 | 1,201,906 | 685,710 | ||||||||||||
(1) | The amounts shown above represent “Compensation Actually Paid” to Watt and Kingsley for each corresponding year which they served as CEO, in accordance with the requirements of Item 402(v) of Regulation S-K. For the years reported in the table Watt was CEO from January 2021 to May 2024 and Kingsley has been CEO since May 2024. The dollar amounts do not reflect the actual amount of compensation earned by or paid to Watt and Kingsley during the applicable year. The adjustments in the below table were made to Watt’s and Kingsley’s total compensation in the Summary Compensation Table for each year to determine the “Compensation Actually Paid” pursuant to Item 402(v) of Regulation S-K. |
(2) | These amounts reflect the average total compensation reported for the Company’s NEOs as a group (excluding Watt and Kingsley) in the “Total” column of the Summary Compensation Table in each applicable year. The names of each of the NEOs (excluding Watt and Kingsley) included for purposes of calculating the average amounts in each applicable year are as follows: (i) for 2025 and 2024 Burns, Stagliano, Mahoney and Wiles; (ii) for 2023 and 2022 Kingsley, Stagliano, Sparks and Mahoney; and (iii) for 2021 Kingsley, Moran, Stagliano, Burns, Halliday and Wiles. |
(5) | The peer group for purposes of this table is the KBW Regional Banking Index (“KRX”), which is the same peer group disclosed in the Company’s Annual Report on Form 10-K. |
The following table reconciles the Summary Compensation Table to the Pay Versus Performance Table above for the CEO. The valuation assumptions used to calculate fair values did not materially differ from those disclosed at the time of grant.
Scott A. Kingsley 2025 ($) | Scott A. Kingsley 2024 ($) | John H. Watt, Jr. 2024 ($) | John H. Watt, Jr. 2023 ($) | John H. Watt, Jr. 2022 ($) | John H. Watt, Jr. 2021 ($) | |||||||||||||||
Compensation from Summary Compensation Table | 2,990,037 | 2,437,755 | 2,692,986 | 2,522,200 | 3,114,914 | 2,766,141 | ||||||||||||||
Less Grant Date Fair Value of Stock Awards in Covered Year, as reported in the Summary Compensation Table | (663,375) | (628,585) | (718,354) | (685,744) | (718,779) | (725,136) | ||||||||||||||
Add the Fair Value of Equity Awards Granted During the Covered Year determined as of the end of the Covered Year | 613,700 | 911,161 | 933,405 | 892,414 | 854,897 | 719,074 | ||||||||||||||
Add Change in Fair Value of Equity Awards Granted in Prior Years that remain outstanding and unvested at the end of the Covered Year | (193,631) | 86,202 | 250,390 | (27,867) | 250,000 | 277,295 | ||||||||||||||
Change in Fair Value for Equity Awards Granted in Prior Years that vested in the Covered Year | 1,775 | 4,514 | (32,051) | 24,787 | 97,000 | 51,767 | ||||||||||||||
Less Aggregate Change in the Actuarial Pension Value of the Accumulated Benefit, as Reported in the Summary Compensation Table for the Covered Year | (792,981) | (157,092) | (1,216,039) | (585,612) | (255,176) | (317,897) | ||||||||||||||
Add pension value attributable to Covered Year’s service and any change in pension value attributable to plan amendments made in the Covered Year | 797,915 | 163,855 | 324,750 | 354,775 | 273,762 | 243,114 | ||||||||||||||
Compensation Actually Paid | 2,753,440 | 2,817,810 | 2,235,087 | 2,494,953 | 3,616,618 | 3,014,358 | ||||||||||||||
The following table reconciles the Summary Compensation Table to the Pay Versus Performance Table above for the other NEOs. The valuation assumptions used to calculate fair values did not materially differ from those disclosed at the time of grant.
2025 ($) | 2024 ($) | 2023 ($) | 2022 ($) | 2021 ($) | |||||||||||||
Compensation from Summary Compensation Table | 1,057,971 | 1,105,750 | 793,495 | 1,105,432 | 653,695 | ||||||||||||
Less Grant Date Fair Value of Stock Awards in Covered Year, as reported in the Summary Compensation Table | (242,823) | (307,739) | (234,913) | (275,923) | (150,859) | ||||||||||||
Add the Fair Value of Equity Awards Granted During the Covered Year determined as of the end of the Covered Year | 224,640 | 430,289 | 305,373 | 332,066 | 154,751 | ||||||||||||
Add Change in Fair Value of Equity Awards Granted in Prior Years that remain outstanding and unvested at the end of the Covered Year | (95,673) | 59,540 | (6,906) | 29,504 | 55,992 | ||||||||||||
Change in Fair Value for Equity Awards Granted in Prior Years that vested in the Covered Year | 167 | (7,796) | (1,266) | 9,779 | 27,030 | ||||||||||||
Less the fair value of any equity awards granted in a Prior Year that were forfeited in the Covered Year determined as of the end of the Prior Year | — | — | — | — | (52,969) | ||||||||||||
Less Aggregate Change in the Actuarial Pension Value of the Accumulated Benefit, as Reported in the Summary Compensation Table for the Covered Year | (10,455) | (2,212) | (8,753) | (1,535) | (5,097) | ||||||||||||
Add pension value attributable to Covered Year’s service and any change in pension value attributable to plan amendments made in the Covered Year | 3,366 | 3,138 | 4,250 | 2,583 | 3,167 | ||||||||||||
Compensation Actually Paid | 937,193 | 1,280,970 | 851,280 | 1,201,906 | 685,710 | ||||||||||||
As also required by Section 953(a) of the Dodd-Frank Wall Street Reform and Consumer Protection Act and Item 402(v) of Regulation S-K, below is an unranked list of the most important financial measures used by the Committee to link executive compensation actually paid to each NEO to Company performance for the 2025 fiscal year:
• | Earnings per share |
• | Return on average tangible common equity |
• | Total shareholder return |
• | Net charge-offs to total loans |
• | Year-over-year loan growth |
• | Year-over-year deposit growth |