Pay vs Performance Disclosure - USD ($)
Dec. 31, 2025
Dec. 31, 2024
Dec. 31, 2023
Dec. 31, 2022
Dec. 31, 2021
Pay Versus Performance
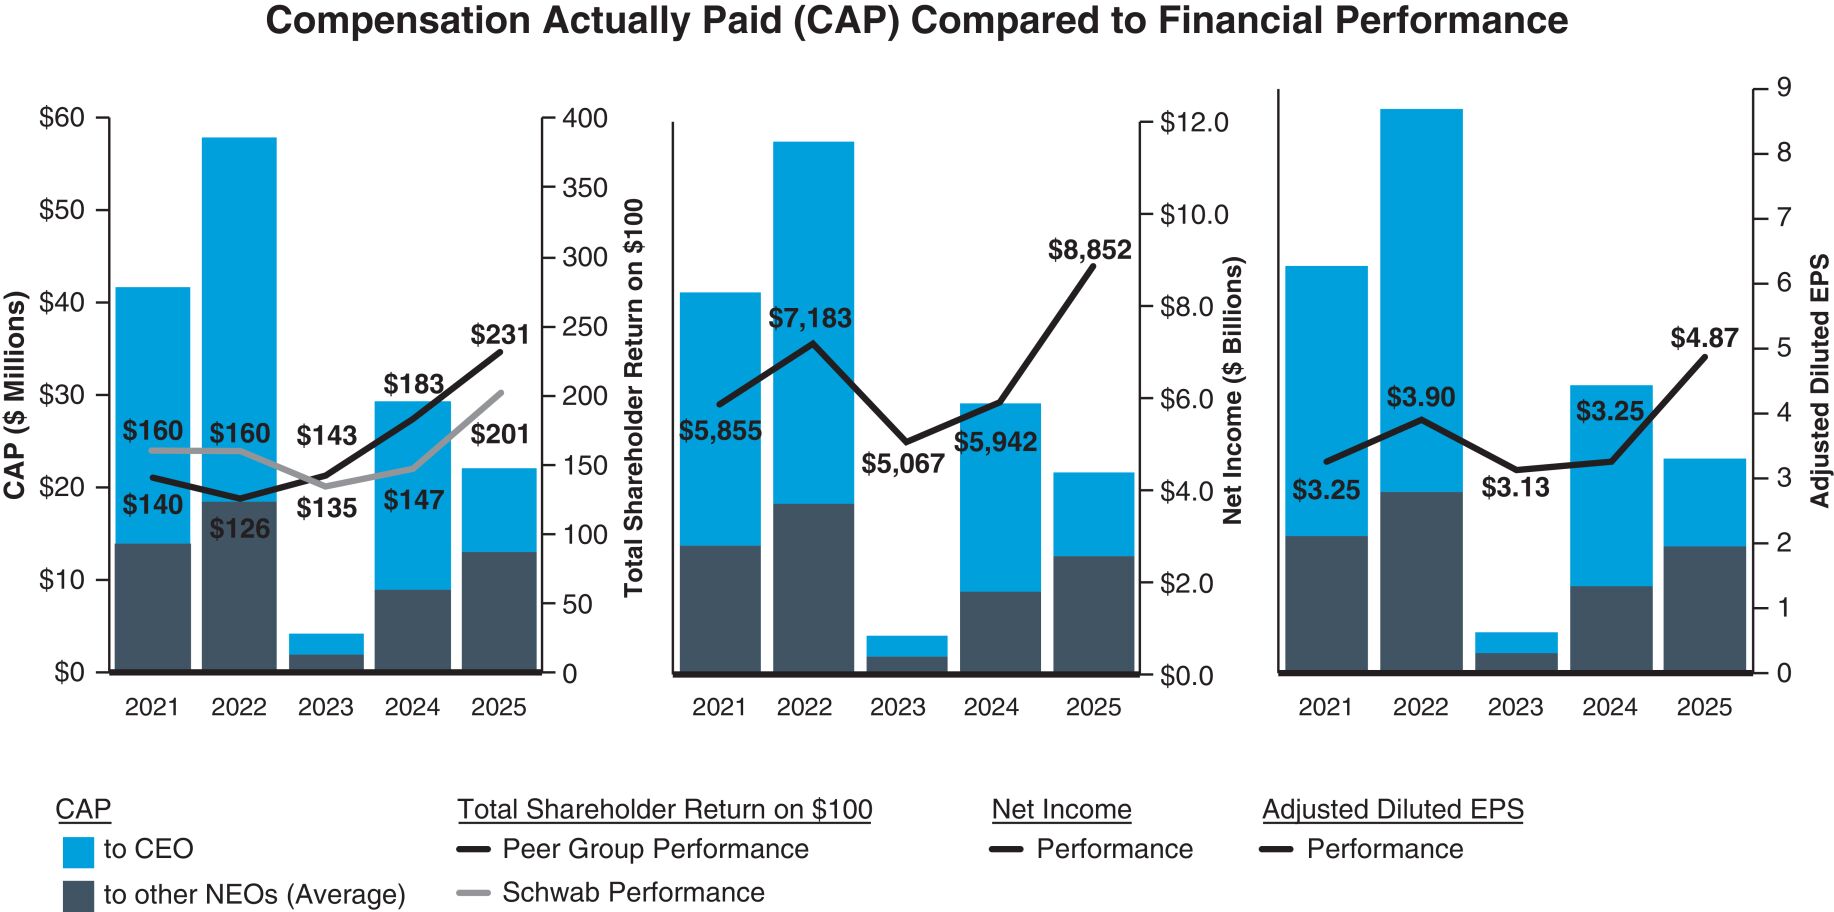
In accordance with SEC rules, the following table sets forth information with respect to how “compensation actually paid” (CAP) for our NEOs aligns with company performance. CAP is an please refer to the “Compensation Discussion and Analysis” section of this proxy statement.
SEC-defined
term that does not necessarily reflect the amounts realized by the NEOs or how the Compensation Committee evaluates the link between company performance and NEO compensation. In addition, a significant portion of CAP relates to changes in fair value of unvested awards over the course of each year. Unvested awards remain subject to vesting conditions and possible future declines in value based on changes in the price of our common stock. The ultimate value realized by our NEOs from unvested equity awards will not be determined until the awards vest. For further information regarding the executive compensation program, including how the Compensation Committee evaluates pay-for-performance,
Year 1 |
Summary Compensation Table Total for CEO 2 |
Compensation Actually Paid to CEO 3 |
Average Summary Compensation Table Total for Other NEOs 2 |
Average Compensation Actually Paid to Other NEOs 3 |
Value of Initial Fixed $100 Investment Based on: 4 |
Adjusted Diluted Earnings Per Common Share (EPS) 6 | ||||||||||
Total Shareholder Return |
Peer Group Total Shareholder Return |
Net Income 5 (000s) | ||||||||||||||
2025 |
$18,755,222 |
$27,233,933 |
$7,297,359 |
$12,964,187 |
$201 |
$231 |
$8,852 |
$4.87 | ||||||||
2024 |
$26,388,559 |
$29,406,845 |
$8,064,444 |
$ 8,950,965 |
$147 |
$183 |
$5,942 |
$3.25 | ||||||||
2023 |
$23,871,744 |
$ 4,173,708 |
$8,204,771 |
$ 1,878,242 |
$135 |
$143 |
$5,067 |
$3.13 | ||||||||
2022 |
$24,386,329 |
$57,877,151 |
$8,355,171 |
$18,470,980 |
$160 |
$126 |
$7,183 |
$3.90 | ||||||||
2021 |
$21,938,404 |
$41,631,785 |
$9,121,613 |
$14,041,967 |
$160 |
$140 |
$5,855 |
$3.25 | ||||||||
(1) |
Richard A. Wurster was the CEO in 2025 and an NEO for 2024, 2023, 2022 and 2021. Walter W. Bettinger II was an NEO in 2025 and the CEO for 2024, 2023, 2022, and 2021. Charles R. Schwab was an NEO for each year presented. Peter B. Crawford and Joseph R. Martinetto were NEOs for 2024, 2023, 2022 and 2021; Jonathan M. Craig and Michael D. Verdeschi were NEOs for 2025 and 2024. |
(2) |
As reported in or, with respect to the non-CEO NEOs, the average of the amounts reported in, the “Total” column of the SCT (the SCT Total) for the applicable year. See the footnotes to the SCTs for further detail regarding the amounts in this column. |
(3) |
The SCT Total or, with respect to the non-CEO NEOs, the average of the SCT Totals reported for the applicable year, adjusted as follows in accordance with Item 402(v) of Regulation S-K: |
Year |
SCT Total Compensation |
Minus SCT Equity Awards Total i |
Plus Fair Value of Current Year Equity Awards at Year-End ii |
Plus Change in Fair Value of Unvested Prior Year Equity Awards ii, iii |
Plus Change in Fair Value of Equity Awards Vested in Current Year ii, iii |
Plus Dividends Paid on Unvested RSUs |
Equals Compensation Actually Paid |
|||||||||||||||||||||||
2025 |
CEO |
$ |
18,755,222 |
$ |
12,687,572 |
$ |
15,674,049 |
$ |
4,393,388 |
$ |
1,086,710 |
$ |
12,136 |
$ |
27,233,933 |
|||||||||||||||
Other NEOs |
$ |
7,297,359 |
$ |
3,931,292 |
$ |
4,856,664 |
$ |
3,937,659 |
$ |
747,240 |
$ |
56,557 |
$ |
12,964,187 |
||||||||||||||||
(i) |
Amounts in this column reflect the totals or, with respect to the non-CEO NEOs, the average of the totals under the Stock Awards and Option Awards columns in the 2025 SCT. See the footnotes to the 2025 SCT for further detail regarding the amounts in this column. |
(ii) |
Fair value of equity awards is calculated in accordance with Financial Accounting Standards Board Accounting Standards Codification Topic 718. Fair value of PBRSUs with unsatisfied performance conditions as of the applicable measurement date also reflects the probable outcome of the applicable performance conditions as of that date. Fair value of unvested options is based on the fair value of the options as of the applicable measurement date as determined using an options pricing model. If a vesting event is on a weekend or holiday, the next preceding day’s prices are used for valuation purposes. Dividend equivalents accumulating on unvested PBRSUs are included in the year-end fair value for the year in which the dividends are accrued. |
(iii) |
Changes in fair value are measured by comparing fair value as of the end of the applicable year or at vesting, as applicable, to the fair value as of the end of the prior year. |
(4) |
Cumulative total shareholder return (TSR) of the company and the Dow Jones U.S. Investment Services Index, which is the same industry index included in Part II, Item 5, “Market for Registrant’s Common Equity, Related Stockholder Matters, and Issuer Purchases of Equity Securities,” of the company’s 2025 10-K, assuming an initial investment of $100 in the company’s common stock on December 31, 2020 and reinvestment of dividends. |
(5) |
Net Income as reported in Part II, Item 8, “Financial Statements and Supplementary Data—Consolidated Statements of Income” of the company’s 2025 10-K. |
(6) |
Adjusted Diluted EPS as reported on page 58 of the company’s 2025 10-K. For a reconciliation of diluted EPS in accordance with GAAP to the non-GAAP financial measure Adjusted Diluted EPS, please see Appendix A beginning on page Appendix A-1. |
10-K,
assuming an initial investment of $100 in the company’s common stock on December 31, 2020 and reinvestment of dividends.
(3) |
The SCT Total or, with respect to the non-CEO NEOs, the average of the SCT Totals reported for the applicable year, adjusted as follows in accordance with Item 402(v) of Regulation S-K: |
Year |
SCT Total Compensation |
Minus SCT Equity Awards Total i |
Plus Fair Value of Current Year Equity Awards at Year-End ii |
Plus Change in Fair Value of Unvested Prior Year Equity Awards ii, iii |
Plus Change in Fair Value of Equity Awards Vested in Current Year ii, iii |
Plus Dividends Paid on Unvested RSUs |
Equals Compensation Actually Paid |
|||||||||||||||||||||||
2025 |
CEO |
$ |
18,755,222 |
$ |
12,687,572 |
$ |
15,674,049 |
$ |
4,393,388 |
$ |
1,086,710 |
$ |
12,136 |
$ |
27,233,933 |
|||||||||||||||
Other NEOs |
$ |
7,297,359 |
$ |
3,931,292 |
$ |
4,856,664 |
$ |
3,937,659 |
$ |
747,240 |
$ |
56,557 |
$ |
12,964,187 |
||||||||||||||||
(i) |
Amounts in this column reflect the totals or, with respect to the non-CEO NEOs, the average of the totals under the Stock Awards and Option Awards columns in the 2025 SCT. See the footnotes to the 2025 SCT for further detail regarding the amounts in this column. |
(ii) |
Fair value of equity awards is calculated in accordance with Financial Accounting Standards Board Accounting Standards Codification Topic 718. Fair value of PBRSUs with unsatisfied performance conditions as of the applicable measurement date also reflects the probable outcome of the applicable performance conditions as of that date. Fair value of unvested options is based on the fair value of the options as of the applicable measurement date as determined using an options pricing model. If a vesting event is on a weekend or holiday, the next preceding day’s prices are used for valuation purposes. Dividend equivalents accumulating on unvested PBRSUs are included in the year-end fair value for the year in which the dividends are accrued. |
(iii) |
Changes in fair value are measured by comparing fair value as of the end of the applicable year or at vesting, as applicable, to the fair value as of the end of the prior year. |
Measures Schwab Considers Important in Evaluating Executive Pay for Performance |
Adjusted Diluted EPS |
ROTCE / Cost of Equity (COE) |
Stock Price |
10-K.
For a reconciliation of diluted EPS in accordance with GAAP to the non-GAAP
financial measure Adjusted Diluted EPS, please see Appendix A beginning on page Appendix A-1.