Exhibit 99.1
TOYO Co., Ltd 1 (NASDAQ: TOYO) Investor Deck March 2026
Forward - Looking Statements This presentation includes “forward - looking statements” within the meaning of the “safe harbor” provisions of the United States Private Securities Litigation Reform Act of 1995 . Forward - looking statements may be identified by the use of words such as “estimate,” “plan,” “project,” “forecast,” “intend,” “will,” “expect,” “anticipate,” “believe,” “seek,” “target” or other similar expressions that predict or indicate future events or trends or that are not statements of historical matters . These forward - looking statements include, but are not limited to, statements regarding the expected growth of TOYO Co . , Ltd (“TOYO”), the expected order delivery of TOYO, TOYO’s construction plan for manufacturing and TOYO’s strategies for building up an integrated value chain in the U . S . These statements are based on various assumptions, whether or not identified in this presentation, and on the current expectations of TOYO’s management and are not predictions or guarantees of actual performance or future results . These statements involve risks, uncertainties, and other factors that may cause actual results, levels of activity, performance, or achievements to be materially different from those expressed or implied by these forward - looking statements . Although TOYO believes that it has a reasonable basis for each forward - looking statement contained in this presentation, TOYO caution you that these statements are based on a combination of facts and factors currently known and projections of the future, which are inherently uncertain . In addition, there are risks and uncertainties described in TOYO’s filings with the Securities and Exchange Commission (the “SEC”), including without limitation under the heading “Risk Factors” in the Company’s annual report on Form 20 - F filed with the SEC on May 12 , 2025 (the “Annual Report”) and in the prospectus included in the registration statement on Form F - 1 (File No . 333 - 283617 ) (the “Form F - 1 ”) . These filings may identify and address other important risks and uncertainties that could cause actual events and results to differ materially from those contained in the forward - looking statements . TOYO cannot assure you that the forward - looking statements in this presentation will prove to be accurate . These forward - looking statements are subject to several risks and uncertainties, including, among others, the outcome of any potential litigation, government or regulatory proceedings, the sales performance of TOYO, and other risks and uncertainties described in TOYO’s filings with the SEC, including without limitation under the heading “Risk Factors” in the Annual Report and the prospectus included in the Form F - 1 . There may be additional risks that TOYO does not presently know or that TOYO currently believes are immaterial that could also cause actual results to differ from those contained in the forward - looking statements . In light of the significant uncertainties in these forward - looking statements, nothing in this presentation should be regarded as a representation by any person that the forward - looking statements set forth herein will be achieved or that any of the contemplated results of such forward - looking statements will be achieved . The forward - looking statements in this presentation represent the views of TOYO as of the date of this presentation . Subsequent events and developments may cause those views to change . However, while TOYO may update these forward - looking statements in the future, there is no current intention to do so except to the extent required by applicable law . You should, therefore, not rely on these forward - looking statements as representing the views of TOYO as of any date subsequent to the date of this presentation . Except as may be required by law, TOYO does not undertake any duty to update these forward - looking statements . Certain information contained in this presentation was obtained from various sources, including third parties, and has not been independently verified . No representation, warranty or undertaking, express or implied, is made as to, and no reliance should be placed on, the fairness, accuracy, completeness, correctness or reasonableness of the information or the sources presented or contained herein . This presentation shall not constitute an offer to sell or the solicitation of an offer to buy securities, nor shall there be any sale of securities in any state or jurisdiction in which such offer, solicitation or sale would be unlawful prior to registration or qualification under the securities laws of any such state or jurisdiction . 2 Safe Harbor
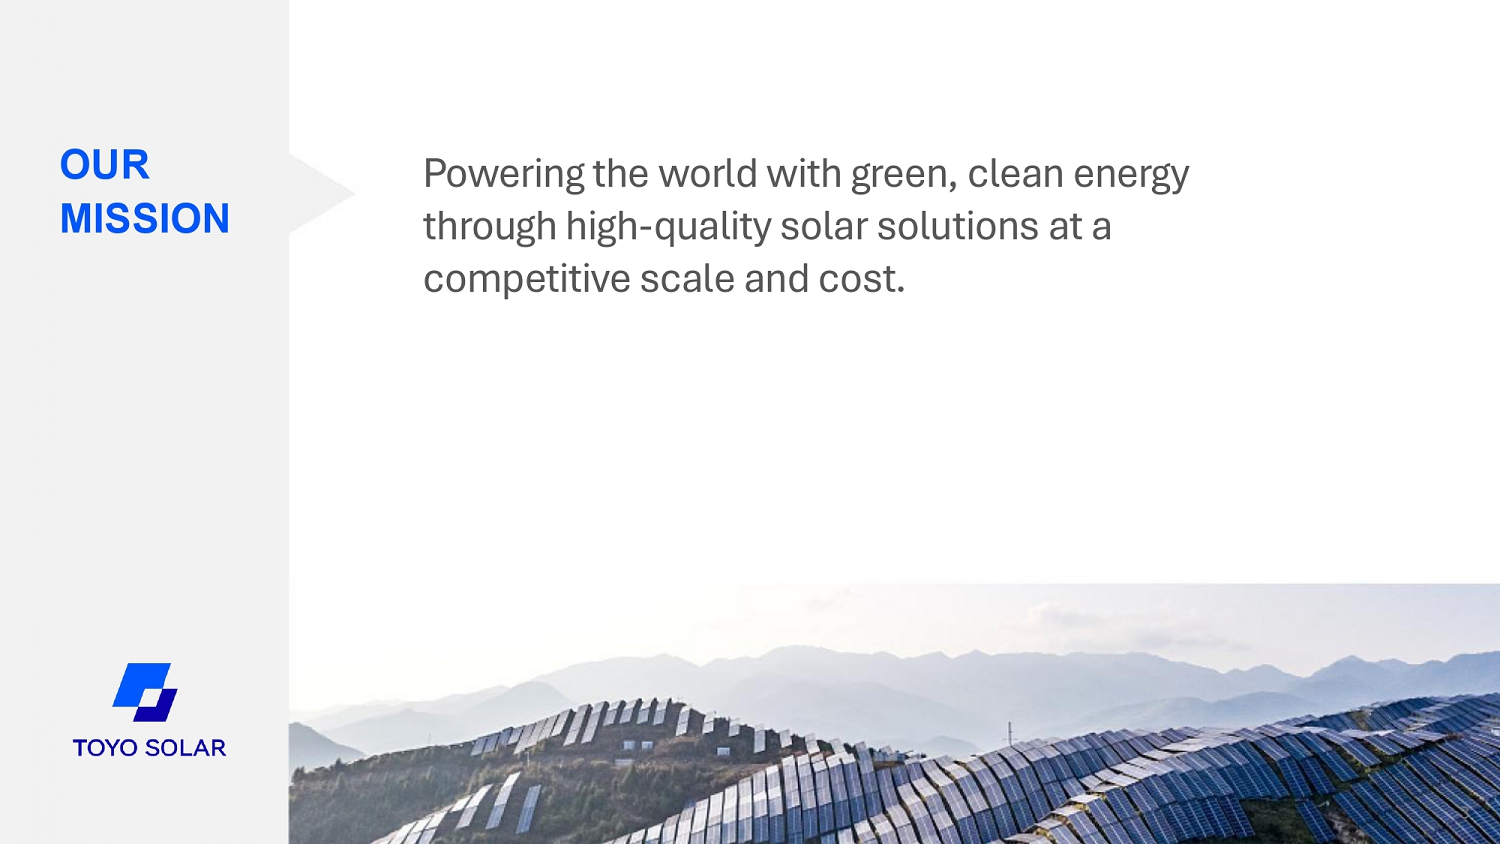
Powering the world with green, clean energy through high - quality solar solutions at a competitive scale and cost. 3 OUR MISSION
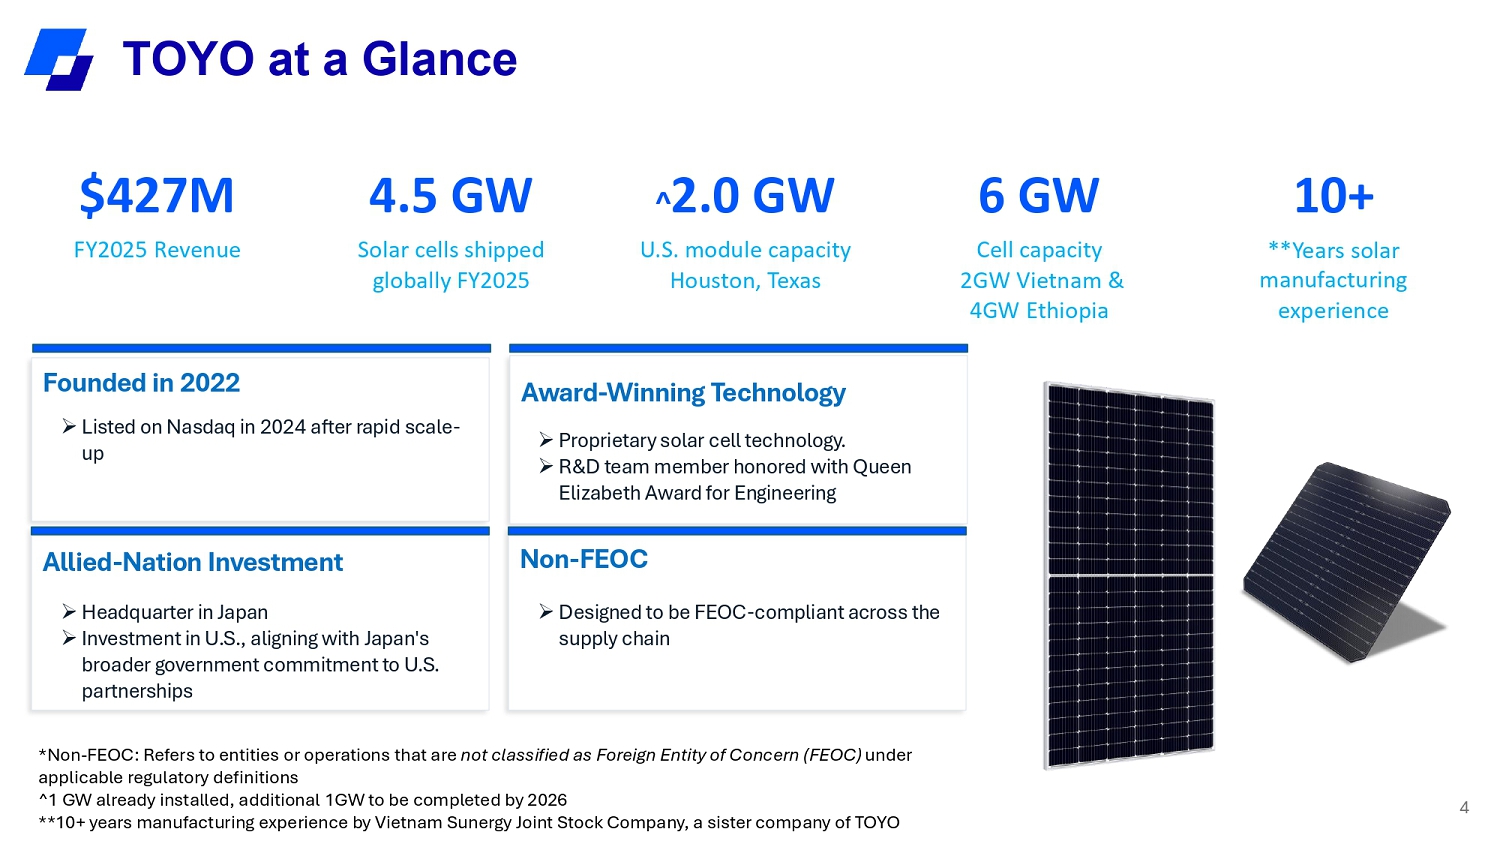
$427M FY2025 Revenue 4.5 GW Solar cells shipped globally FY2025 ^ 2.0 GW U.S. module capacity Houston, Texas 6 GW Cell capacity 2GW Vietnam & 4GW Ethiopia 10+ **Years solar manufacturing experience Founded in 2022 » Listed on Nasdaq in 2024 after rapid scale - up Award - Winning Technology » Proprietary solar cell technology. » RsD team member honored with Queen Elizabeth Award for Engineering Allied - Nation Investment » Headquarter in Japan » Investment in U.S., aligning with Japan's broader government commitment to U.S. partnerships Non - FEOC » Designed to be FEOC - compliant across the supply chain *Non - FEOC: Refers to entities or operations that are not classified as Foreign Entity of Concern (FEOC) under applicable regulatory definitions ^1 GW already installed, additional 1GW to be completed by 2026 **10+ years manufacturing experience by Vietnam Sunergy Joint Stock Company, a sister company of TOYO 4 TOYO at a Glance
Track record of rapid growth & profitability as one of the leading non - FEOC solar solutions provider Leveraging established relationships with U.S. utility - scale customers 1 2 4 3 Proven manufacturing excellence delivers world - class technology at a highly competitive cost Rapidly expanding manufacturing footprint to meet customer demand in a dynamic policy environment Investment Highlight
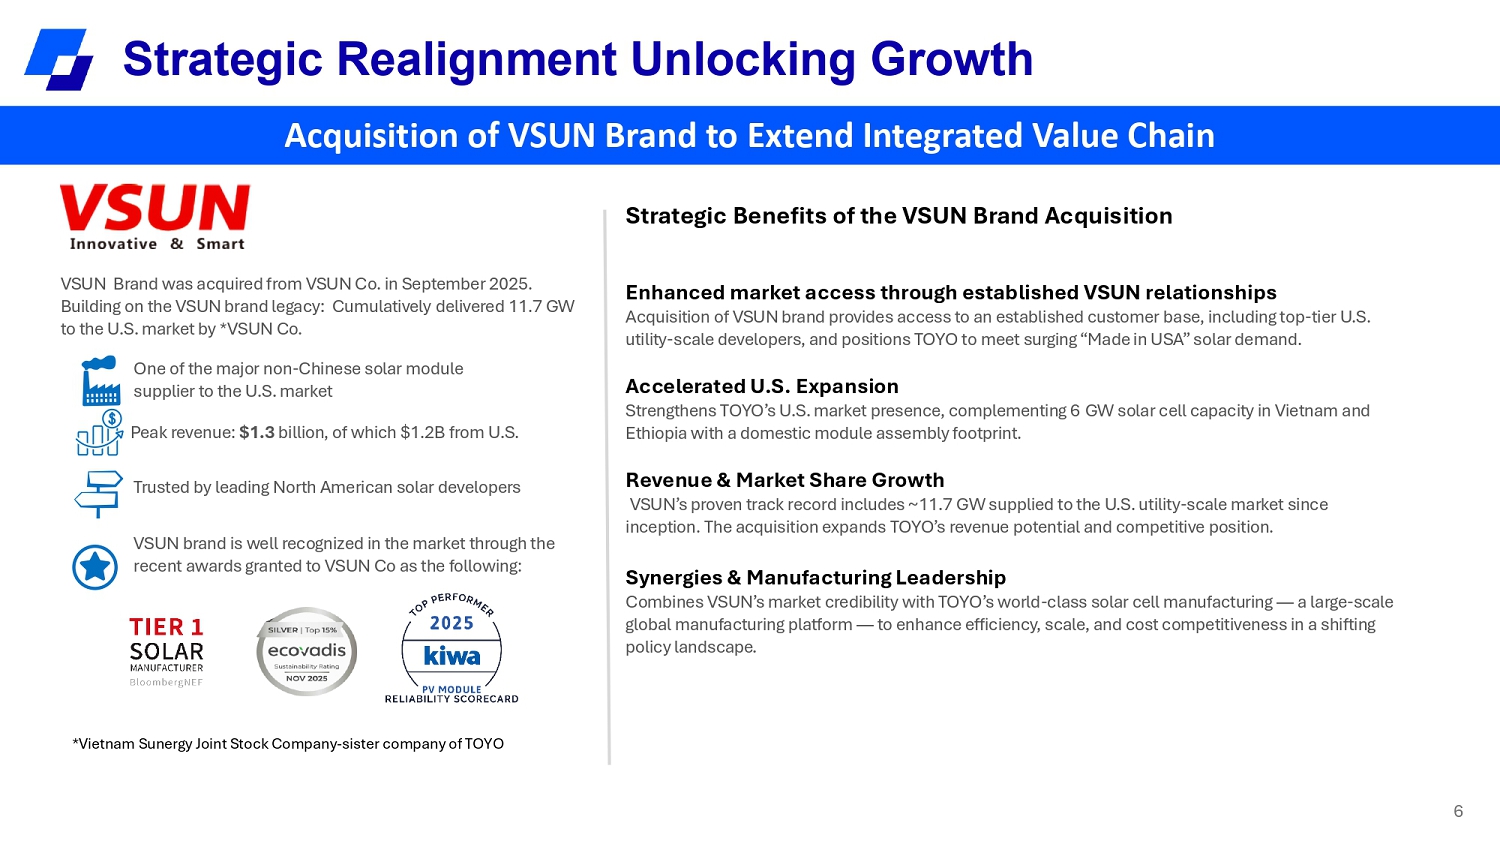
VSUN Brand was acquired from VSUN Co. in September 2025. Building on the VSUN brand legacy: Cumulatively delivered 11.7 GW to the U.S. market by *VSUN Co. One of the major non - Chinese solar module supplier to the U.S. market Peak revenue: $1.3 billion, of which $1.2B from U.S. Trusted by leading North American solar developers VSUN brand is well recognized in the market through the recent awards granted to VSUN Co as the following: Acquisition of VSUN Brand to Extend Integrated Value Chain Strategic Benefits of the VSUN Brand Acquisition Enhanced market access through established VSUN relationships Acquisition of VSUN brand provides access to an established customer base, including top - tier U.S. utility - scale developers, and positions TOYO to meet surging “Made in USA” solar demand. Accelerated U.S. Expansion Strengthens TOYO’s U.S. market presence, complementing 6 GW solar cell capacity in Vietnam and Ethiopia with a domestic module assembly footprint. Revenue s Market Share Growth VSUN’s proven track record includes ~11.7 GW supplied to the U.S. utility - scale market since inception. The acquisition expands TOYO’s revenue potential and competitive position. Synergies s Manufacturing Leadership Combines VSUN’s market credibility with TOYO’s world - class solar cell manufacturing — a large - scale global manufacturing platform — to enhance efficiency, scale, and cost competitiveness in a shifting policy landscape. 6 *Vietnam Sunergy Joint Stock Company - sister company of TOYO Strategic Realignment Unlocking Growth
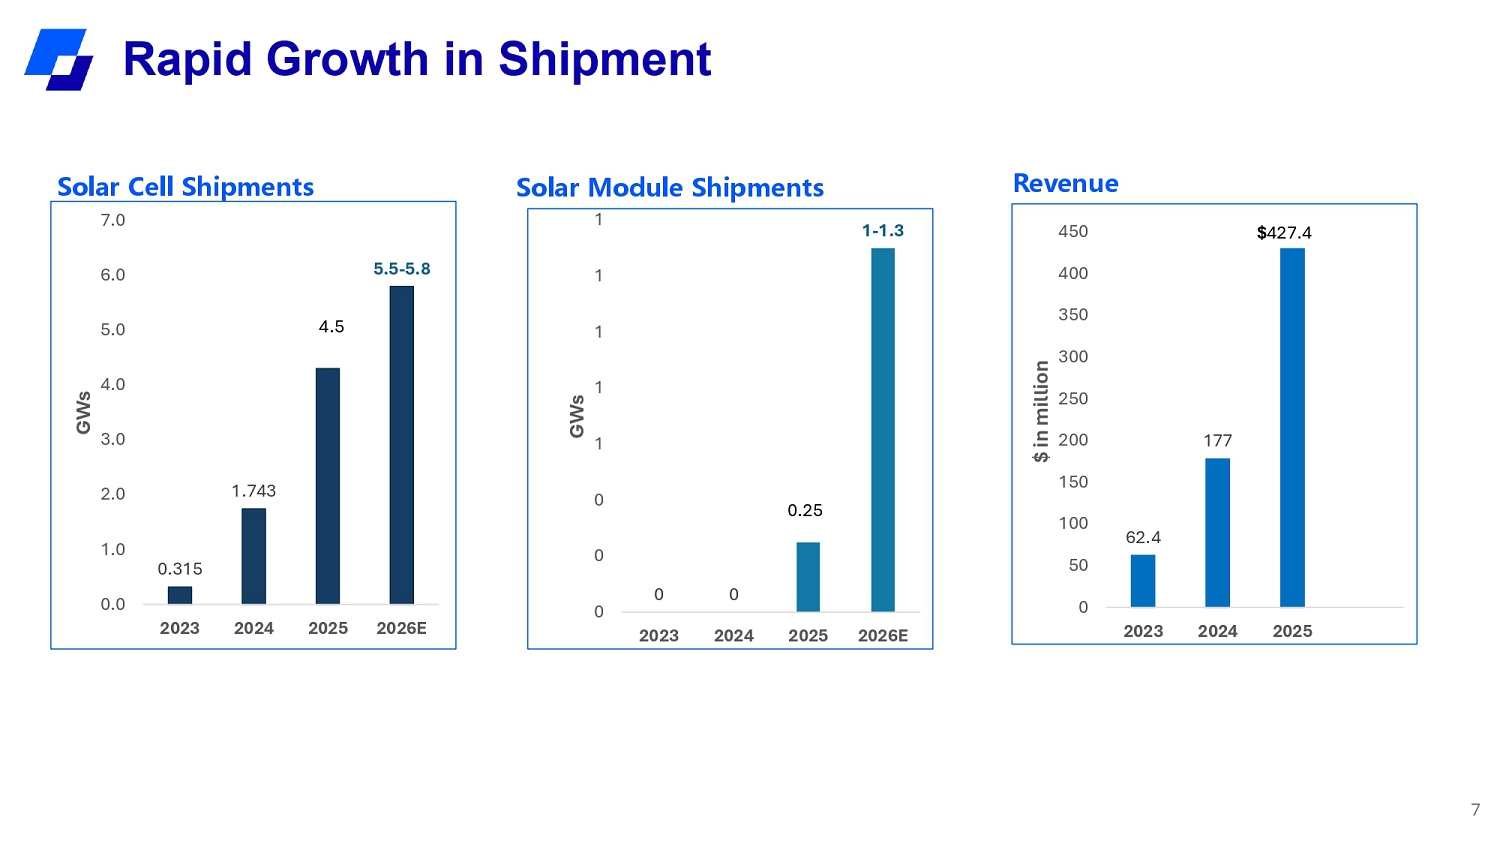
7 0.315 1.743 5.5 - 5.8 0.0 1.0 2.0 3.0 4.0 5.0 6.0 7.0 2023 2024 2025 2026E GWs 0 0 1 - 1.3 0 0 0 1 1 1 1 1 2023 2024 2025 2026E GWs 0.25 Solar Cell Shipments Solar Module Shipments 4.5 Revenue 62.4 177 100 50 0 200 150 450 400 350 300 250 2023 2024 2025 $ in million $ 427.4 Rapid Growth in Shipment
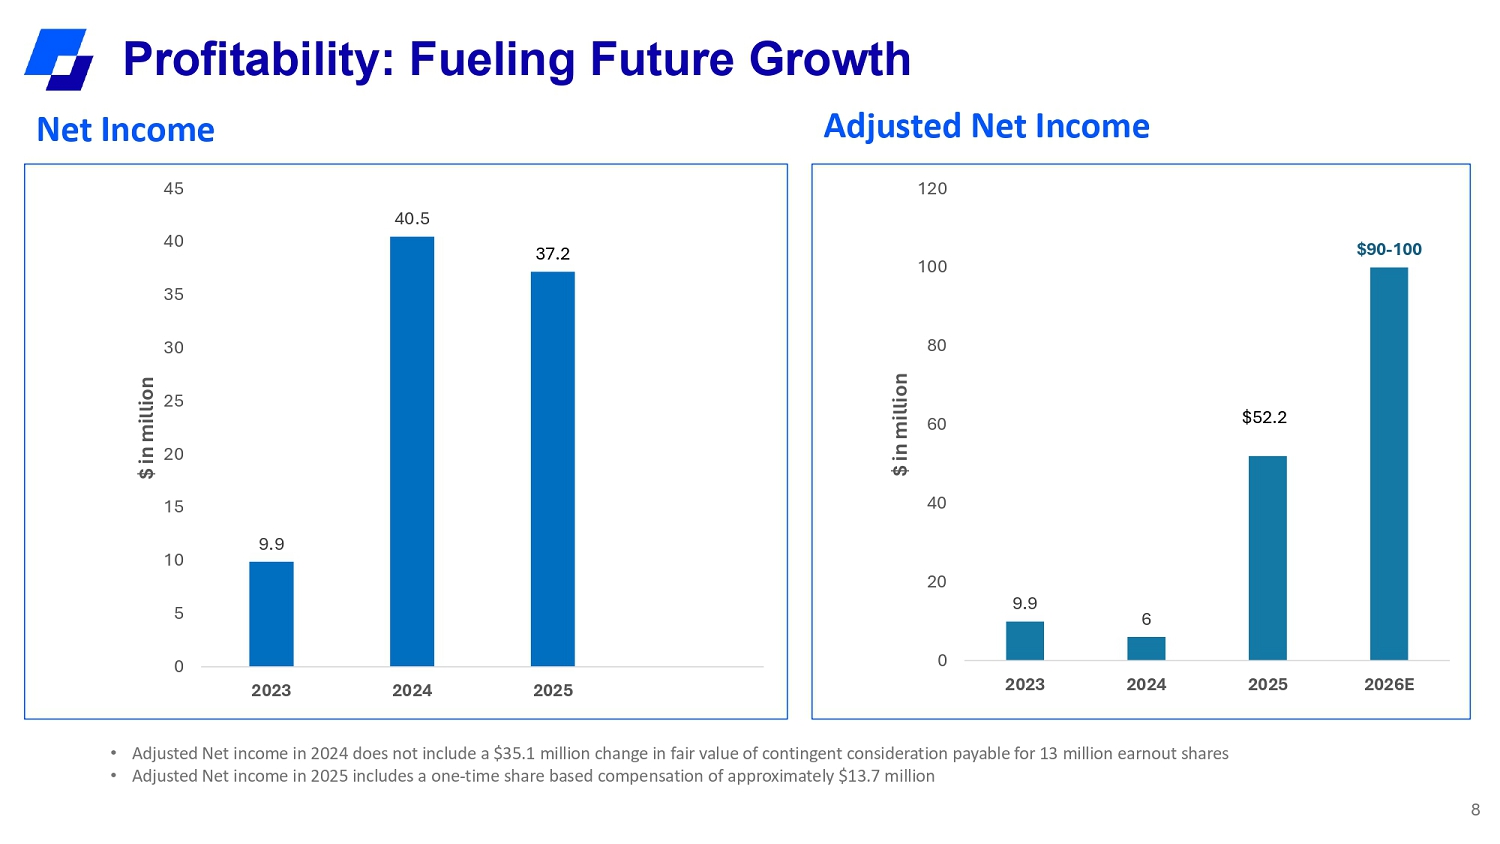
8 9.9 6 $G0 - 100 0 20 40 60 80 100 120 2023 2024 2025 2026E $ in million $52.2 Adjusted Net Income • Adjusted Net income in 2024 does not include a $35.1 million change in fair value of contingent consideration payable for 13 million earnout shares • Adjusted Net income in 2025 includes a one - time share based compensation of approximately $13.7 million Net Income 9.9 40.5 5 0 35 30 25 20 15 10 40 45 2023 2024 2025 $ in million 37.2 Profitability: Fueling Future Growth
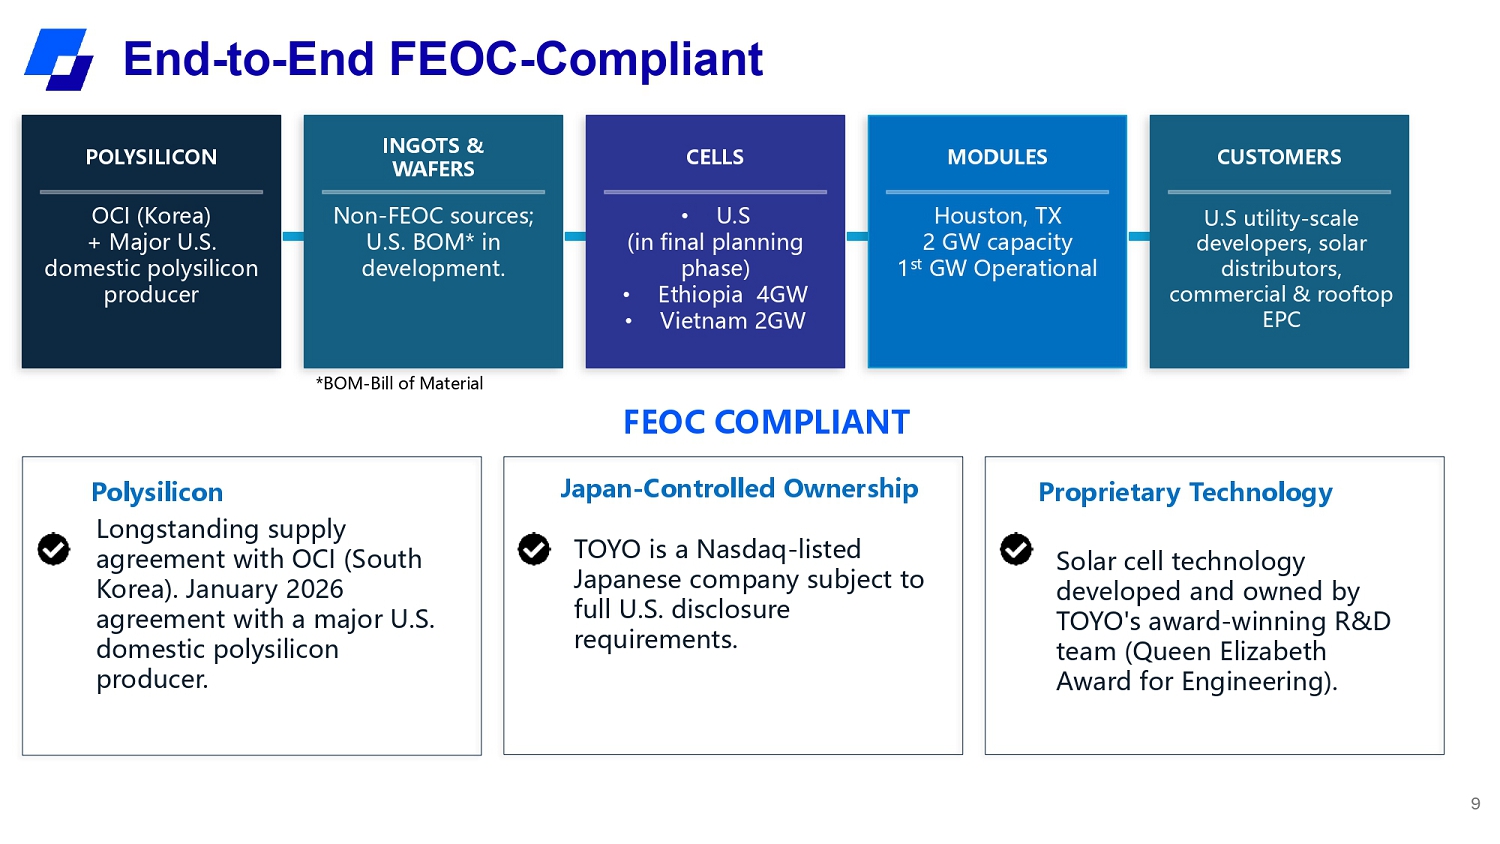
POLYSILICON OCI (Korea) + Major U.S. domestic polysilicon producer INGOTS & WAFERS Non - FEOC sources; U.S. BOM* in development. CELLS • U.S (in final planning phase) • Ethiopia 4GW • Vietnam 2GW MODULES Houston, TX 2 GW capacity 1 st GW Operational CUSTOMERS U.S utility - scale developers, solar distributors, commercial & rooftop EPC FEOC COMPLIANT Polysilicon Longstanding supply agreement with OCI (South Korea). January 2026 agreement with a major U.S. domestic polysilicon producer. Proprietary Technology Solar cell technology developed and owned by TOYO's award - winning R&D team (Queen Elizabeth Award for Engineering). Japan - Controlled Ownership TOYO is a Nasdaq - listed Japanese company subject to full U.S. disclosure requirements. 9 *BOM - Bill of Material End - to - End FEOC - Compliant
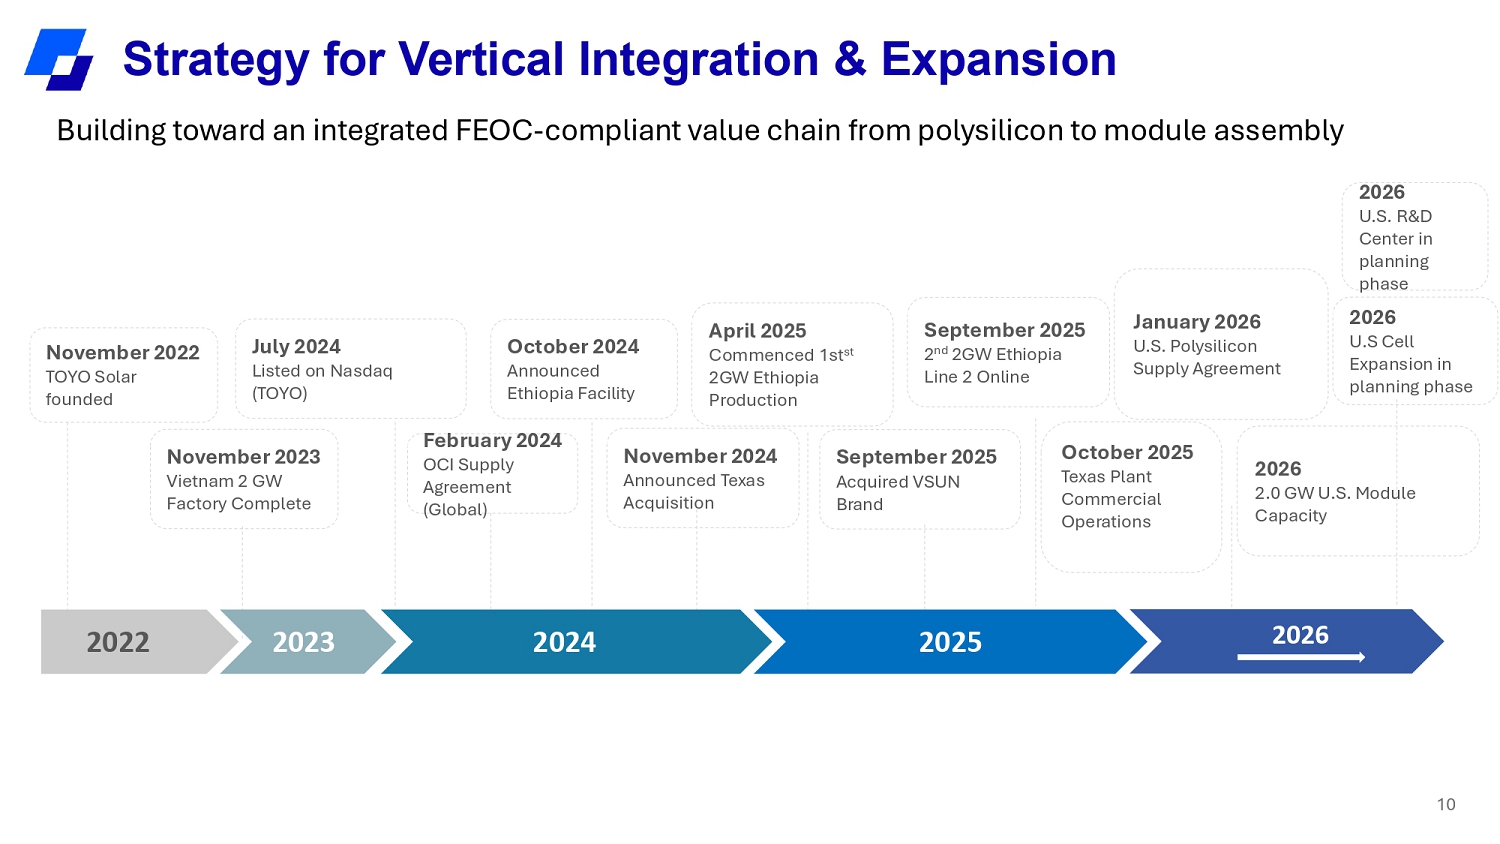
November 2022 TOYO Solar founded October 2024 Announced Ethiopia Facility July 2024 Listed on Nasdaq (TOYO) November 2024 Announced Texas Acquisition September 2025 Acquired VSUN Brand April 2025 Commenced 1st st 2GW Ethiopia Production November 2023 Vietnam 2 GW Factory Complete Building toward an integrated FEOC - compliant value chain from polysilicon to module assembly October 2025 Texas Plant Commercial Operations 2022 2023 2024 2025 2026 February 2024 OCI Supply Agreement (Global) September 2025 2 nd 2GW Ethiopia Line 2 Online 10 2026 2.0 GW U.S. Module Capacity January 2026 U.S. Polysilicon Supply Agreement 2026 U.S. RCD Center in planning phase 2026 U.S Cell Expansion in planning phase Strategy for Vertical Integration & Expansion
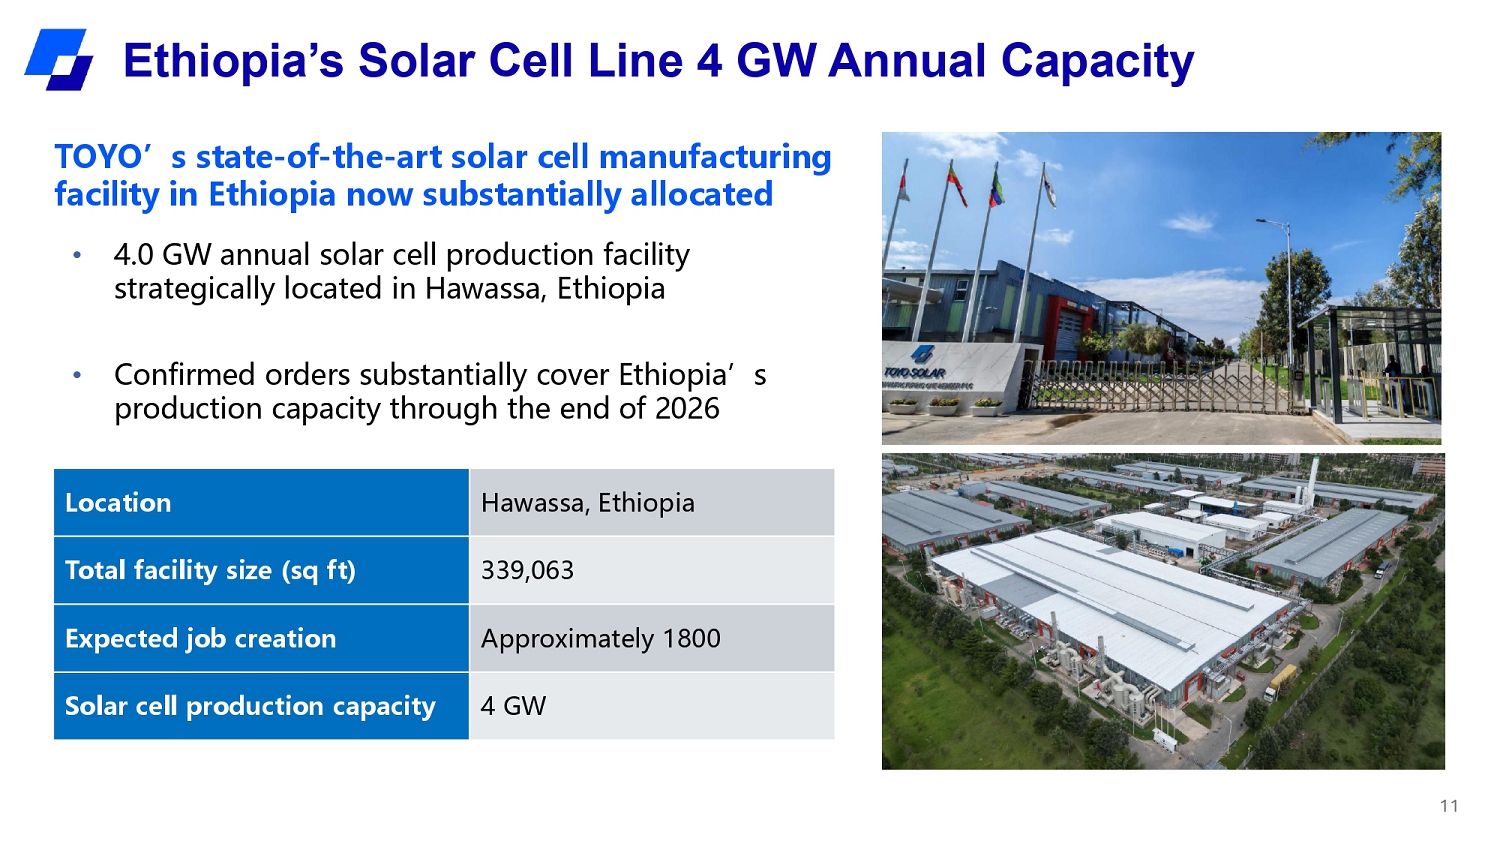
TOYO’s state - of - the - art solar cell manufacturing facility in Ethiopia now substantially allocated • 4.0 GW annual solar cell production facility strategically located in Hawassa, Ethiopia • Confirmed orders substantially cover Ethiopia’s production capacity through the end of 2026 Hawassa, Ethiopia Location 339,063 Total facility size (sq ft) Approximately 1800 Expected job creation 4 GW Solar cell production capacity 11 Ethiopia’s Solar Cell Line 4 GW Annual Capacity
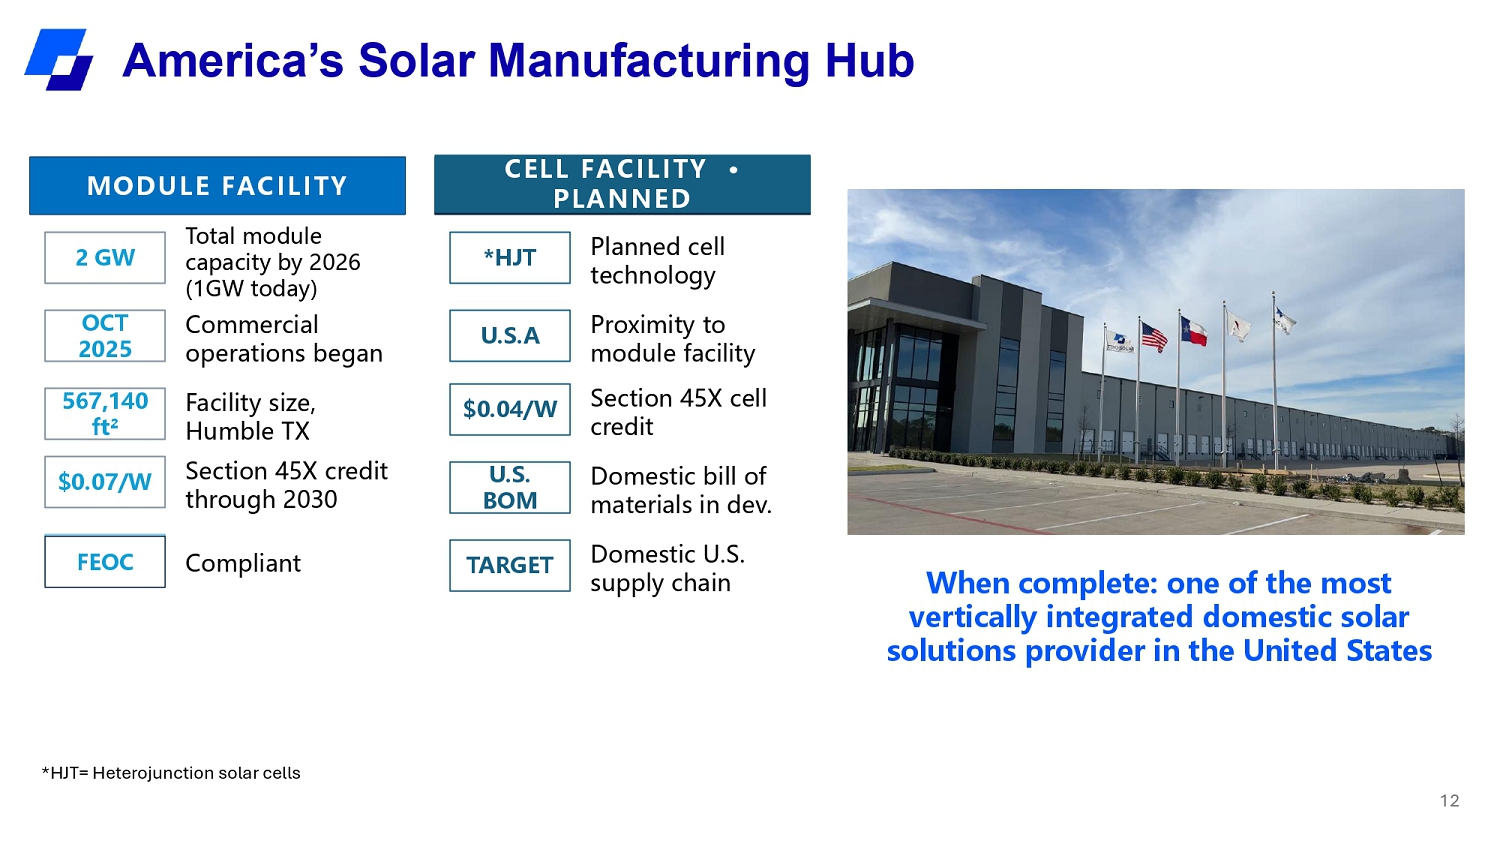
MODULE FACILITY 2 GW Total module capacity by 2026 (1GW today) Commercial operations began Facility size, Humble TX Section 45X credit through 2030 OCT 2025 567,140 ft² $0.07/W FEOC Compliant CELL FACILITY · PLANNED *HJT Planned cell technology Proximity to module facility Section 45X cell credit Domestic bill of materials in dev. Domestic U.S. supply chain U.S.A $0.04/W U.S. BOM TARGET *HJT= Heterojunction solar cells 12 America’s Solar Manufacturing Hub When complete: one of the most vertically integrated domestic solar solutions provider in the United States
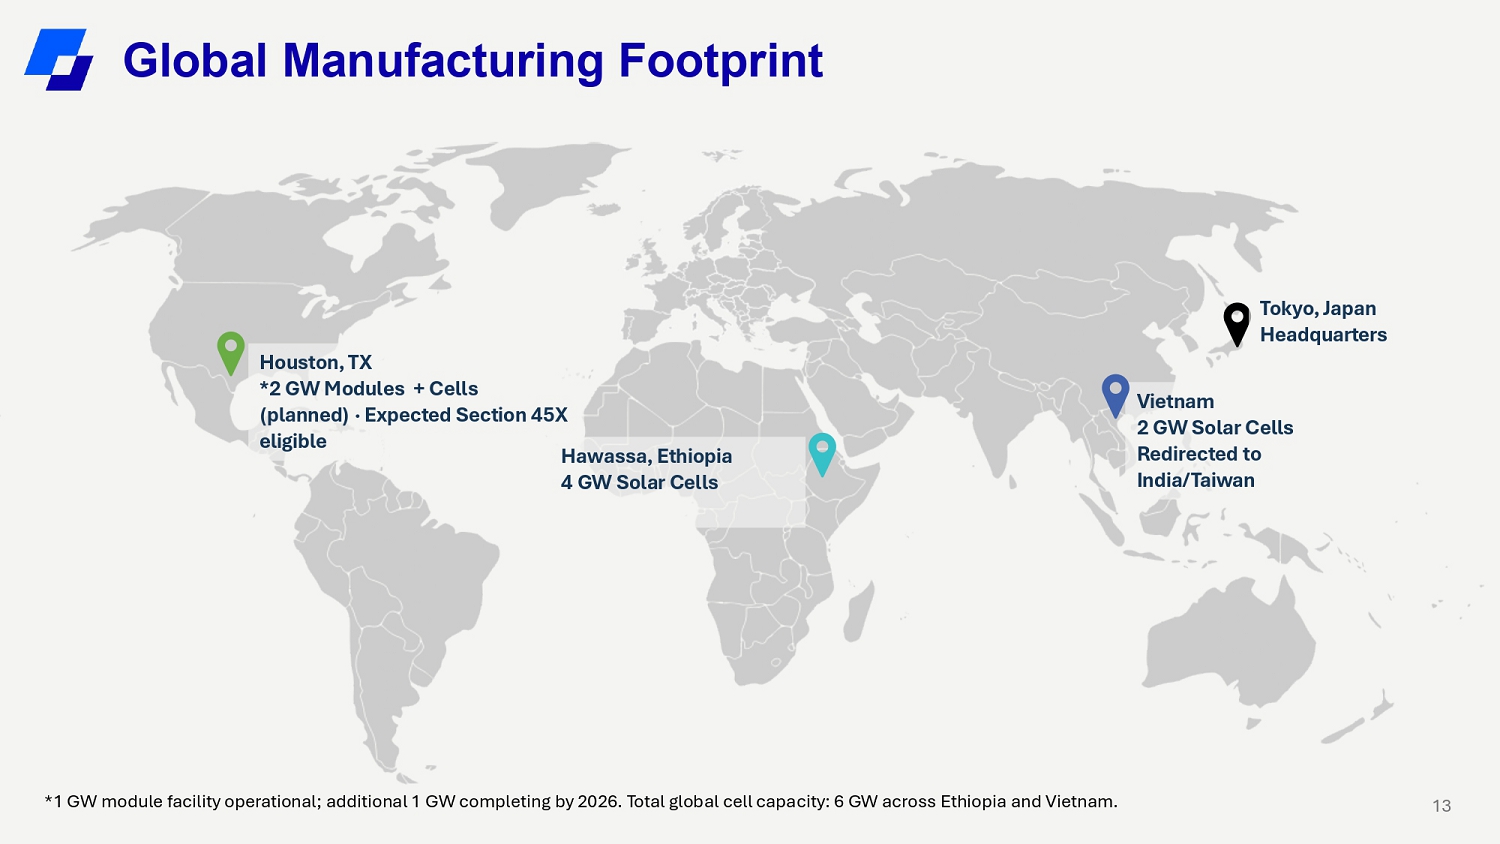
Vietnam 2 GW Solar Cells Redirected to India/Taiwan Tokyo, Japan Headquarters Houston, TX *2 GW Modules + Cells (planned) · Expected Section 45X eligible Hawassa, Ethiopia 4 GW Solar Cells 13 *1 GW module facility operational; additional 1 GW completing by 2026. Total global cell capacity: 6 GW across Ethiopia and Vietnam. Global Manufacturing Footprint
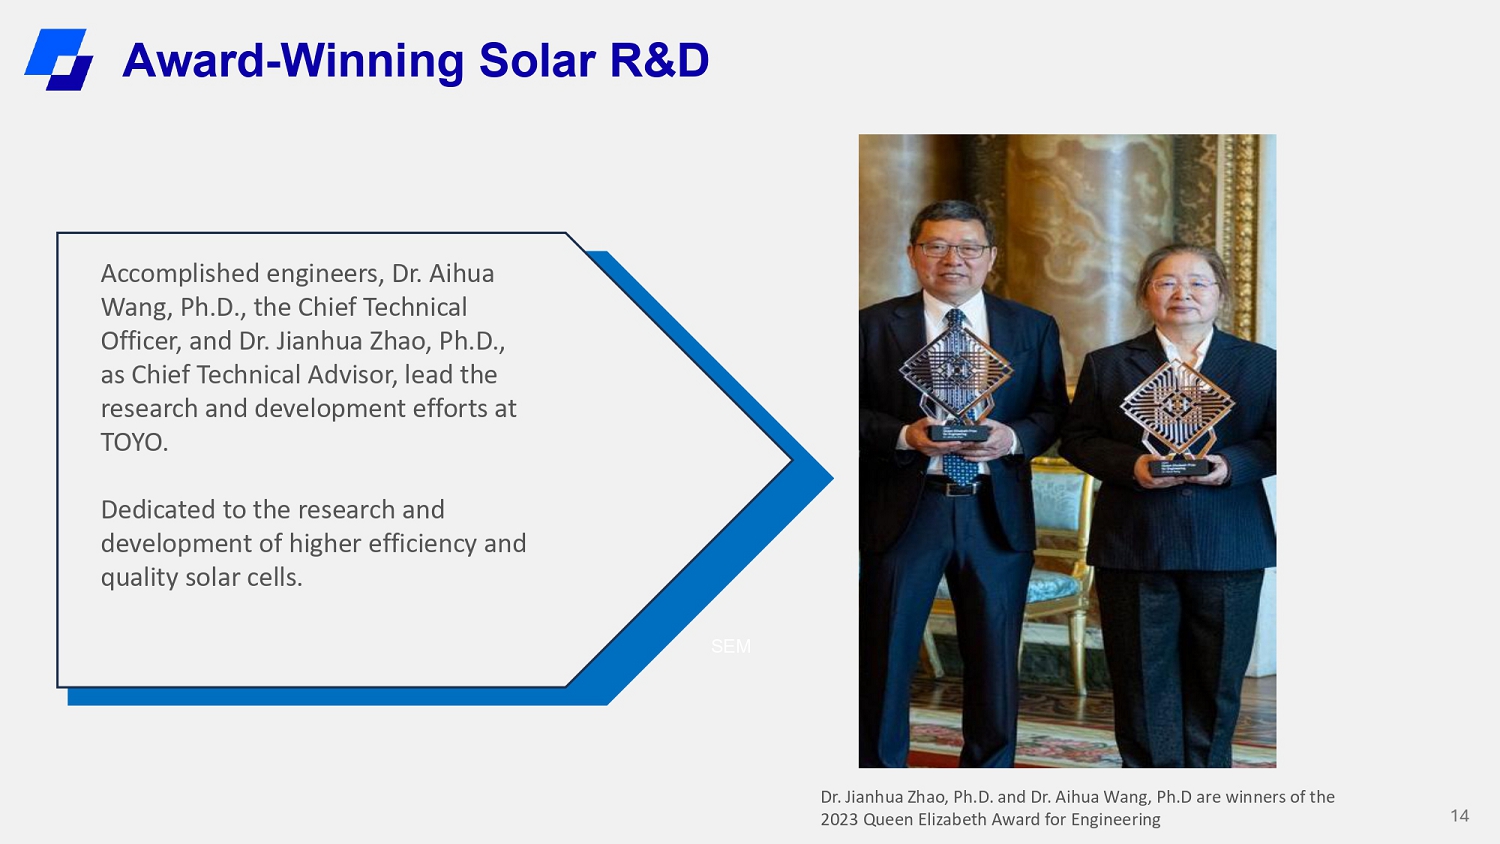
Accomplished engineers, Dr. Aihua Wang, Ph.D., the Chief Technical Officer, and Dr. Jianhua Zhao, Ph.D., as Chief Technical Advisor, lead the research and development efforts at TOYO. Dedicated to the research and development of higher efficiency and quality solar cells. SEM PL Dr. Jianhua Zhao, Ph.D. and Dr. Aihua Wang, Ph.D are winners of the 2023 Queen Elizabeth Award for Engineering 14 Award - Winning Solar R&D
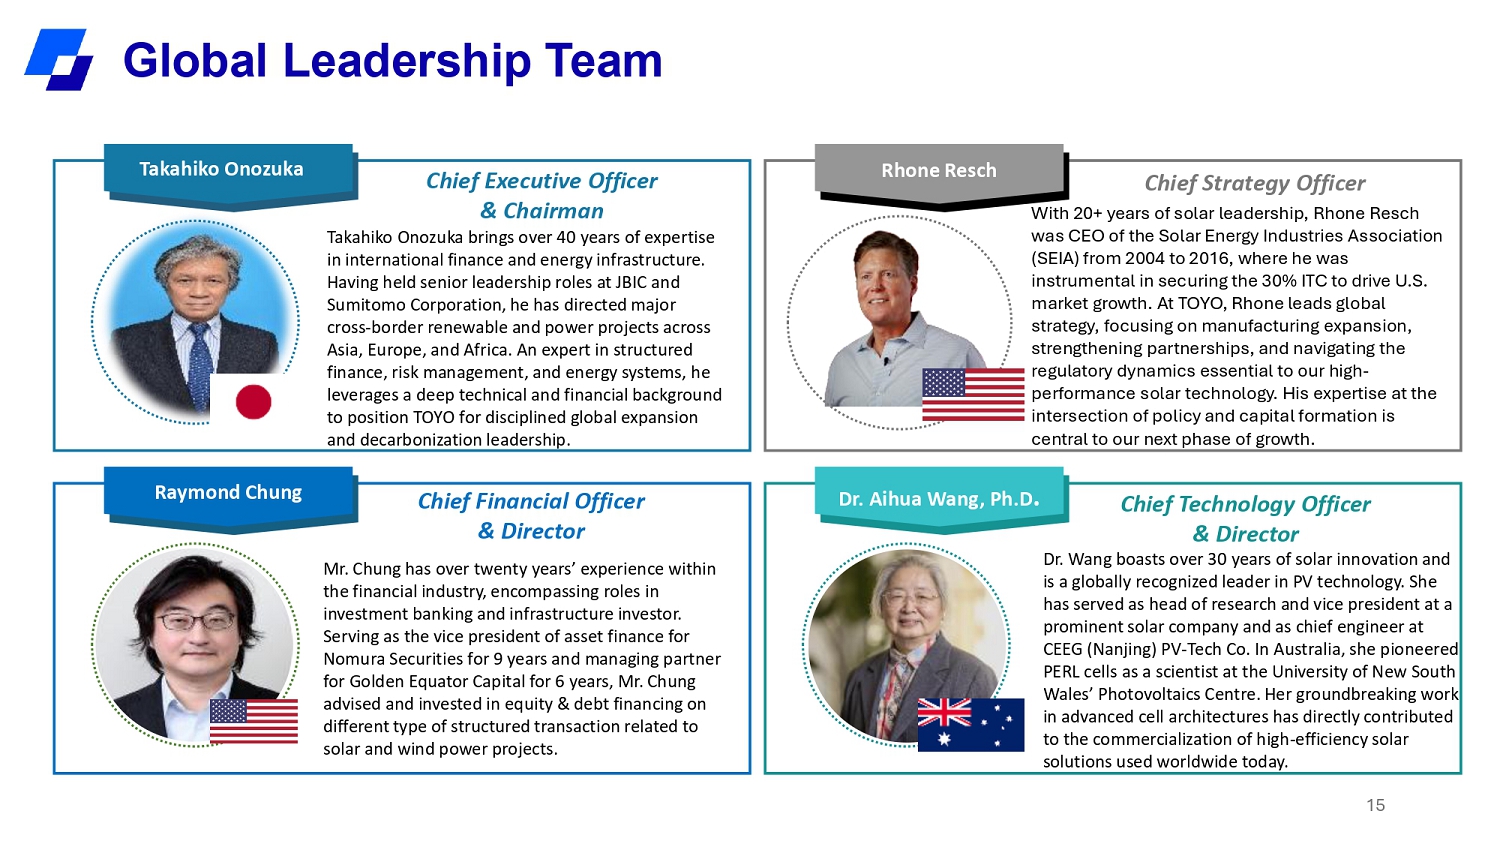
Chief Executive Officer & Chairman Takahiko Onozuka brings over 40 years of expertise in international finance and energy infrastructure. Having held senior leadership roles at JBIC and Sumitomo Corporation, he has directed major cross - border renewable and power projects across Asia, Europe, and Africa. An expert in structured finance, risk management, and energy systems, he leverages a deep technical and financial background to position TOYO for disciplined global expansion and decarbonization leadership. Takahiko Onozuka Chief Strategy Officer With 20+ years of solar leadership, Rhone Resch was CEO of the Solar Energy Industries Association (SEIA) from 2004 to 2016, where he was instrumental in securing the 30% ITC to drive U.S. market growth. At TOYO, Rhone leads global strategy, focusing on manufacturing expansion, strengthening partnerships, and navigating the regulatory dynamics essential to our high - performance solar technology. His expertise at the intersection of policy and capital formation is central to our next phase of growth. Rhone Resch Chief Financial Officer & Director Mr. Chung has over twenty years’ experience within the financial industry, encompassing roles in investment banking and infrastructure investor. Serving as the vice president of asset finance for Nomura Securities for 9 years and managing partner for Golden Equator Capital for 6 years, Mr. Chung advised and invested in equity & debt financing on different type of structured transaction related to solar and wind power projects. Raymond Chung Chief Technology Officer & Director Dr. Wang boasts over 30 years of solar innovation and is a globally recognized leader in PV technology. She has served as head of research and vice president at a prominent solar company and as chief engineer at CEEG (Nanjing) PV - Tech Co. In Australia, she pioneered PERL cells as a scientist at the University of New South Wales’ Photovoltaics Centre. Her groundbreaking work in advanced cell architectures has directly contributed to the commercialization of high - efficiency solar solutions used worldwide today. Dr. Aihua Wang, Ph.D . 15 Global Leadership Team
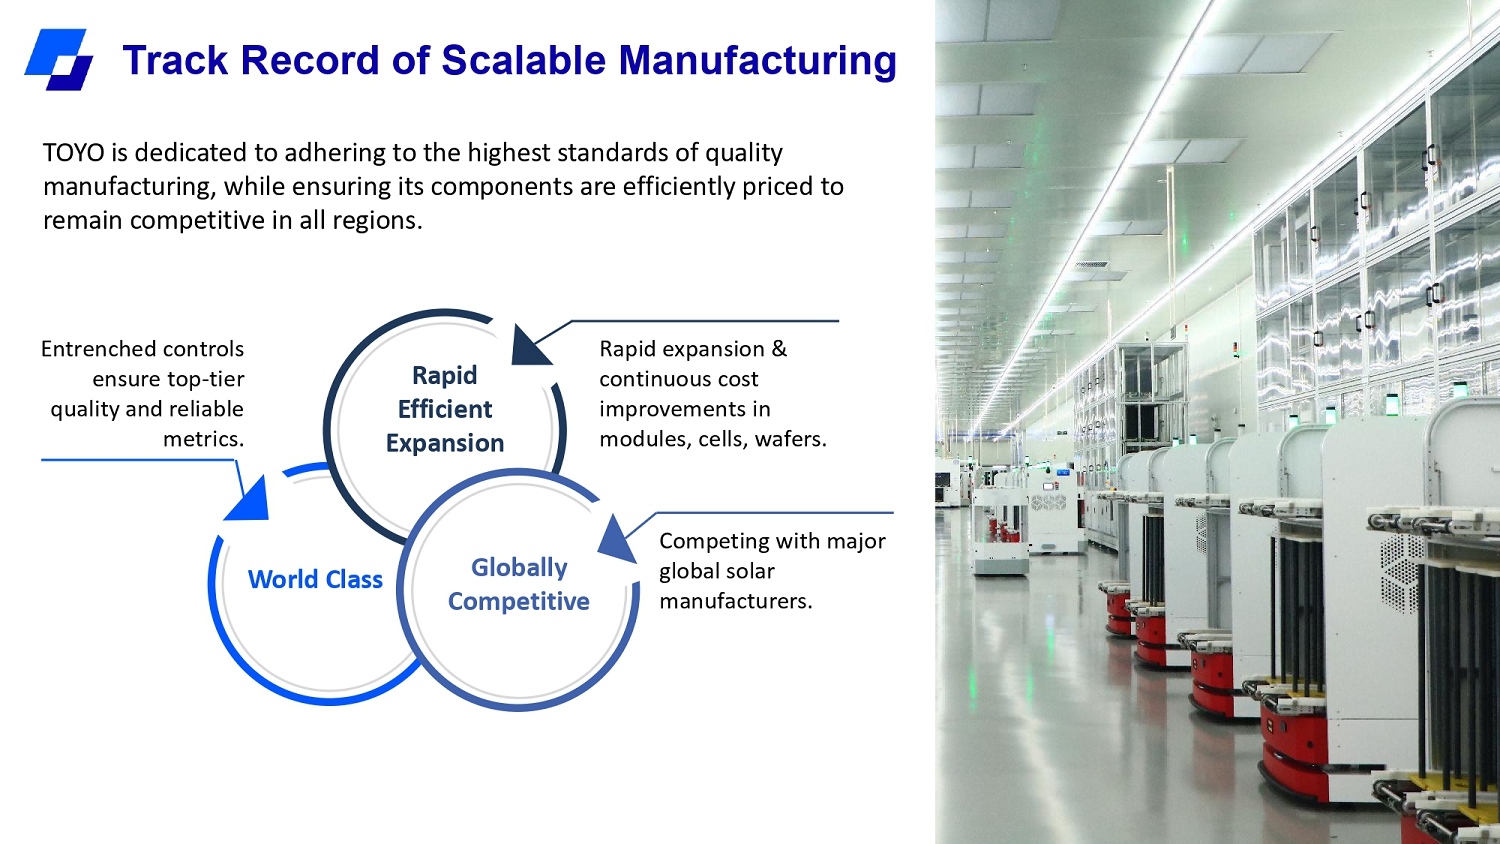
TOYO is dedicated to adhering to the highest standards of quality manufacturing, while ensuring its components are efficiently priced to remain competitive in all regions. World Class Globally Competitive Rapid Efficient Expansion Entrenched controls ensure top - tier quality and reliable metrics. Rapid expansion & continuous cost improvements in modules, cells, wafers. Competing with major global solar manufacturers. Track Record of Scalable Manufacturing
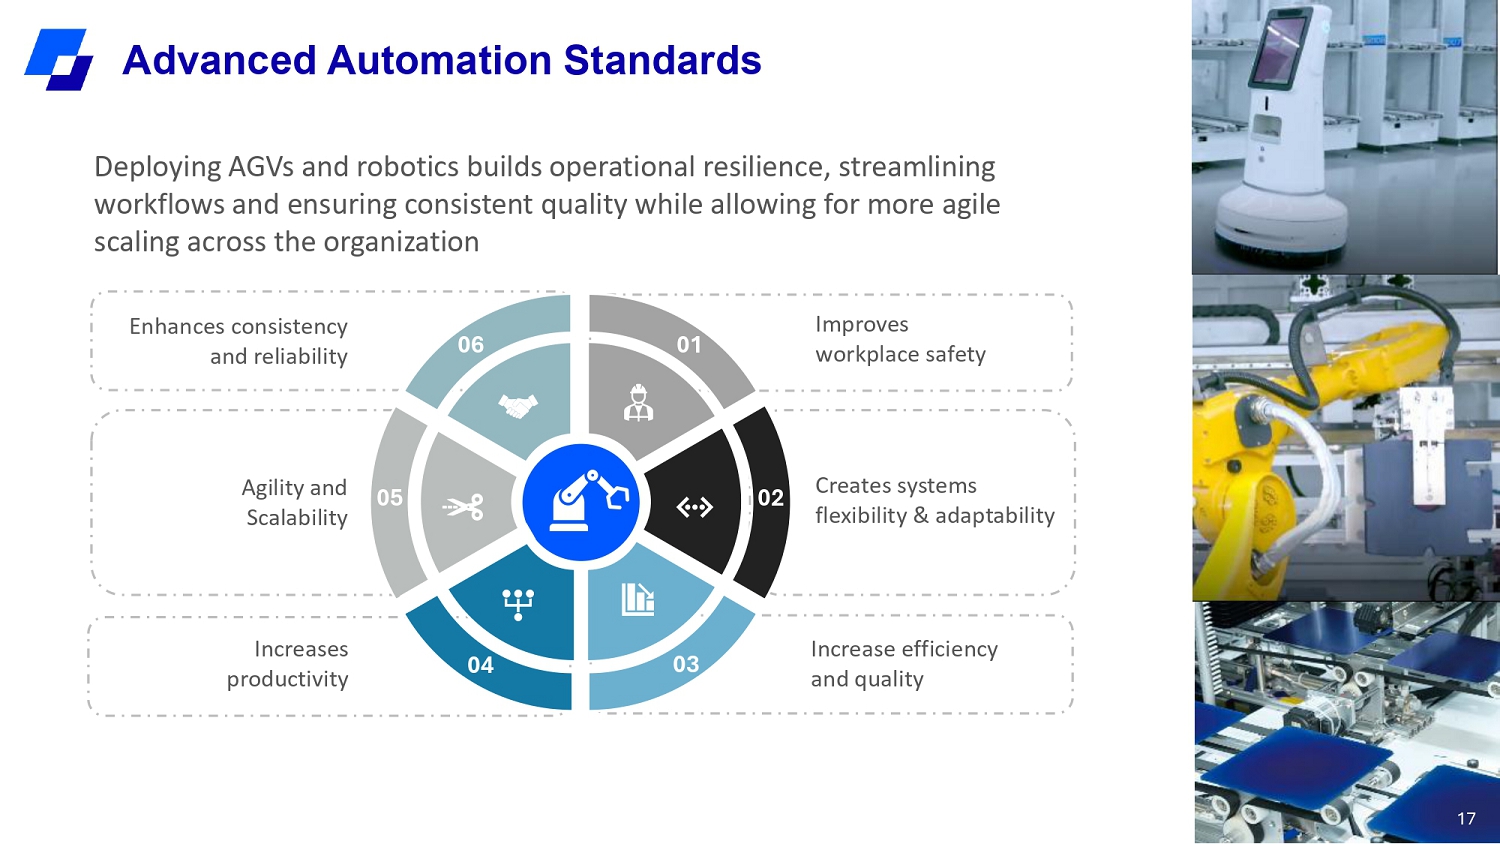
17 Deploying AGVs and robotics builds operational resilience, streamlining workflows and ensuring consistent quality while allowing for more agile scaling across the organization Improves workplace safety Agility and Scalability Increases productivity Enhances consistency and reliability Increase efficiency and quality Creates systems flexibility & adaptability 01 06 02 05 03 04 Advanced Automation Standards
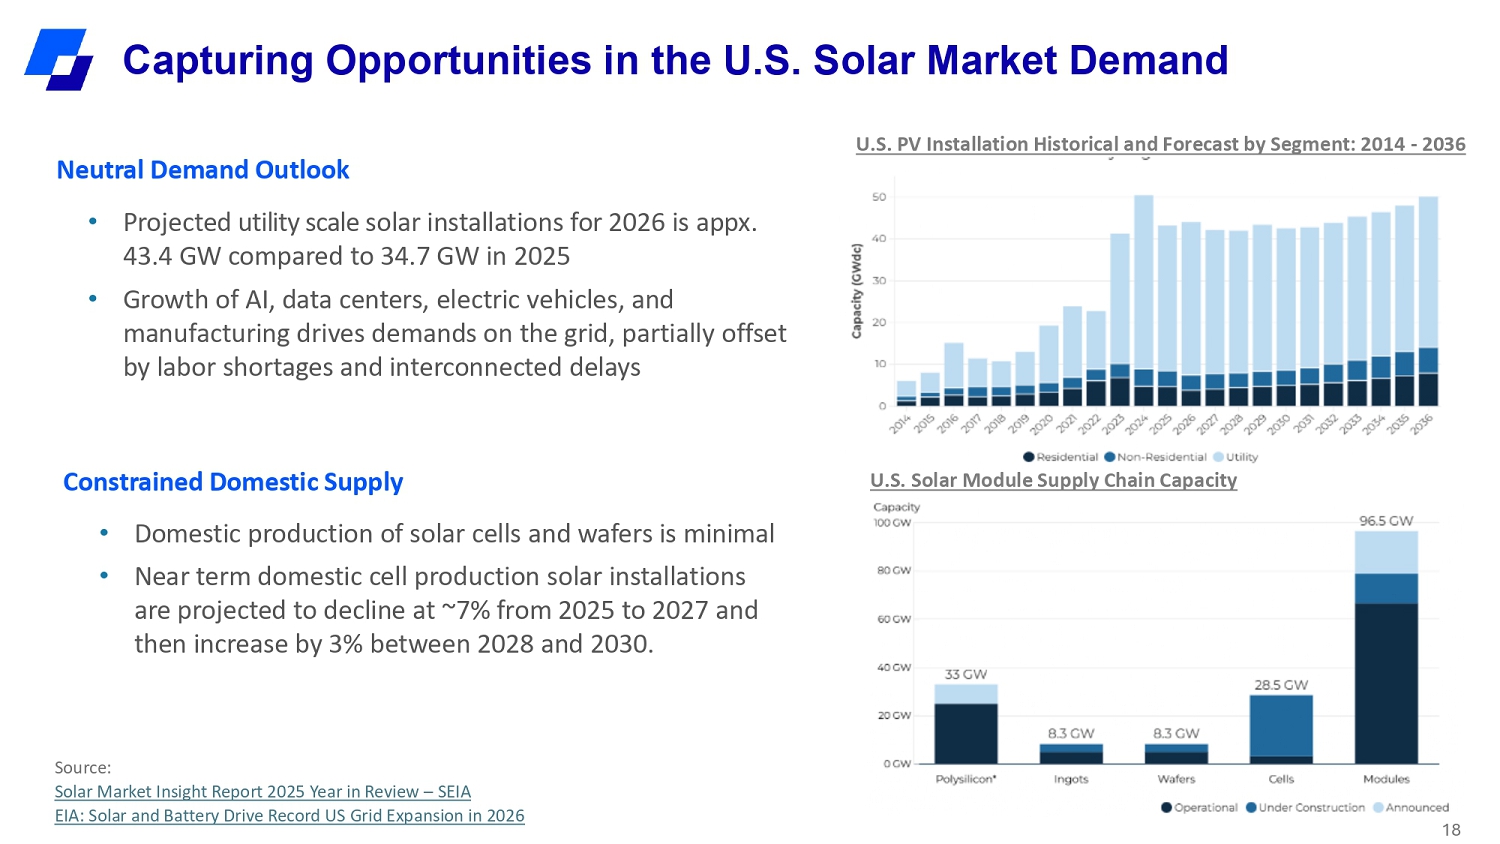
Neutral Demand Outlook • Projected utility scale solar installations for 2026 is appx. 43.4 GW compared to 34.7 GW in 2025 • Growth of AI, data centers, electric vehicles, and manufacturing drives demands on the grid, partially offset by labor shortages and interconnected delays • Domestic production of solar cells and wafers is minimal • Near term domestic cell production solar installations are projected to decline at ~7% from 2025 to 2027 and then increase by 3% between 2028 and 2030. U.S. PV Installation Historical and Forecast by Segment: 2014 - 2036 Constrained Domestic Supply Source: Solar Market Insight Report 2025 Year in Revie w – SEIA EIA: Solar and Battery Drive Record US Grid Expansion in 2026 18 U.S. Solar Module Supply Chain Capacity 18 Capturing Opportunities in the U.S. Solar Market Demand
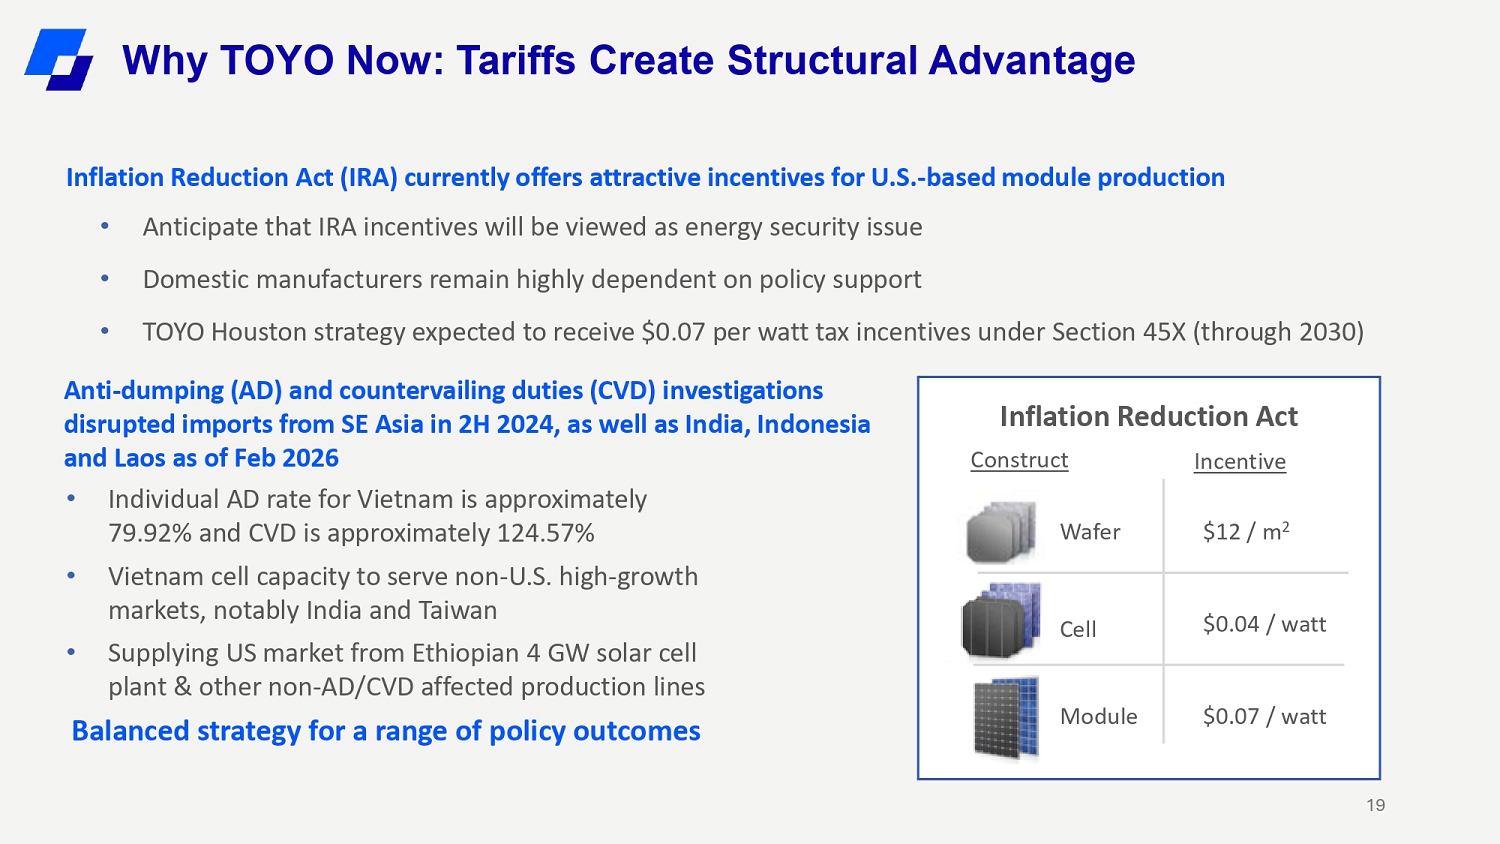
Anti - dumping (AD) and countervailing duties (CVD) investigations disrupted imports from SE Asia in 2H 2024, as well as India, Indonesia and Laos as of Feb 2026 Inflation Reduction Act (IRA) currently offers attractive incentives for U.S. - based module production • Anticipate that IRA incentives will be viewed as energy security issue • Domestic manufacturers remain highly dependent on policy support • TOYO Houston strategy expected to receive $0.07 per watt tax incentives under Section 45X (through 2030) • Individual AD rate for Vietnam is approximately 79.92% and CVD is approximately 124.57% • Vietnam cell capacity to serve non - U.S. high - growth markets, notably India and Taiwan • Supplying US market from Ethiopian 4 GW solar cell plant & other non - AD/CVD affected production lines Balanced strategy for a range of policy outcomes Inflation Reduction Act Construct Incentive $12 / m 2 Wafer $0.04 / watt Cell $0.07 / watt Module 19 Why TOYO Now: Tariffs Create Structural Advantage
TOYO is focused on further developing the clean energy industry, adhering to a responsible global supply chain strategy, and contributing to the sustainable development of human beings with more professional, efficient and cleaner products. Social Responsibility High level of Material Traceability 20 Committed to Environmental Stewardship
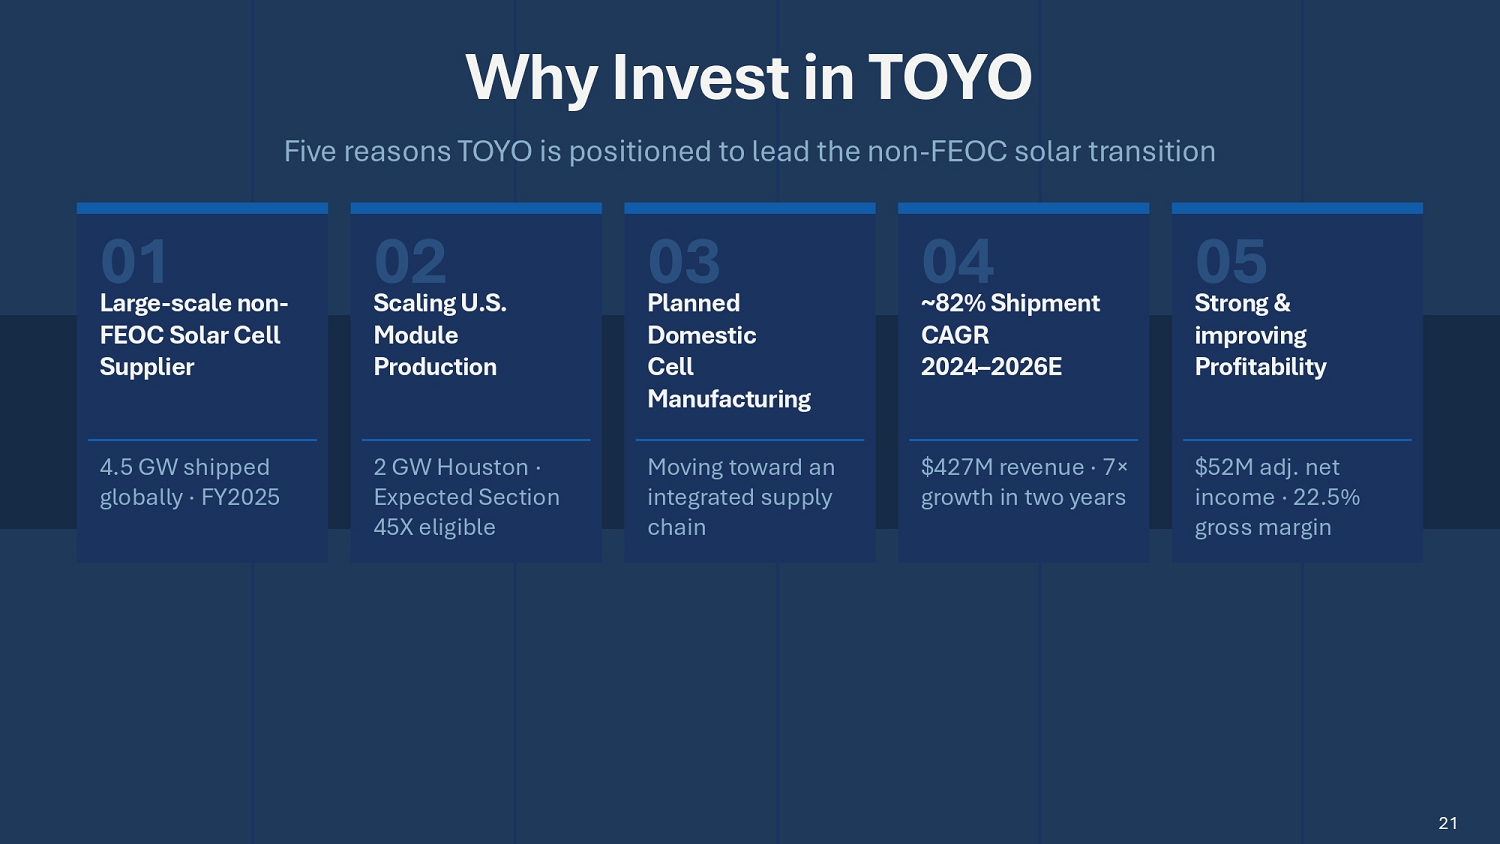
Why Invest in TOYO Five reasons TOYO is positioned to lead the non - FEOC solar transition 01 Large - scale non - FEOC Solar Cell Supplier 4.5 GW shipped globally · FY2025 Scaling U.S. Module Production 2 GW Houston · Expected Section 45X eligible Planned Domestic Cell Manufacturing Moving toward an integrated supply chain 02 03 04 ~82% Shipment CAGR 2024 – 2026E $427M revenue · 7 ù growth in two years 05 Strong s improving Profitability $52M adj. net income · 22.5% gross margin 21
22 Summary Financials
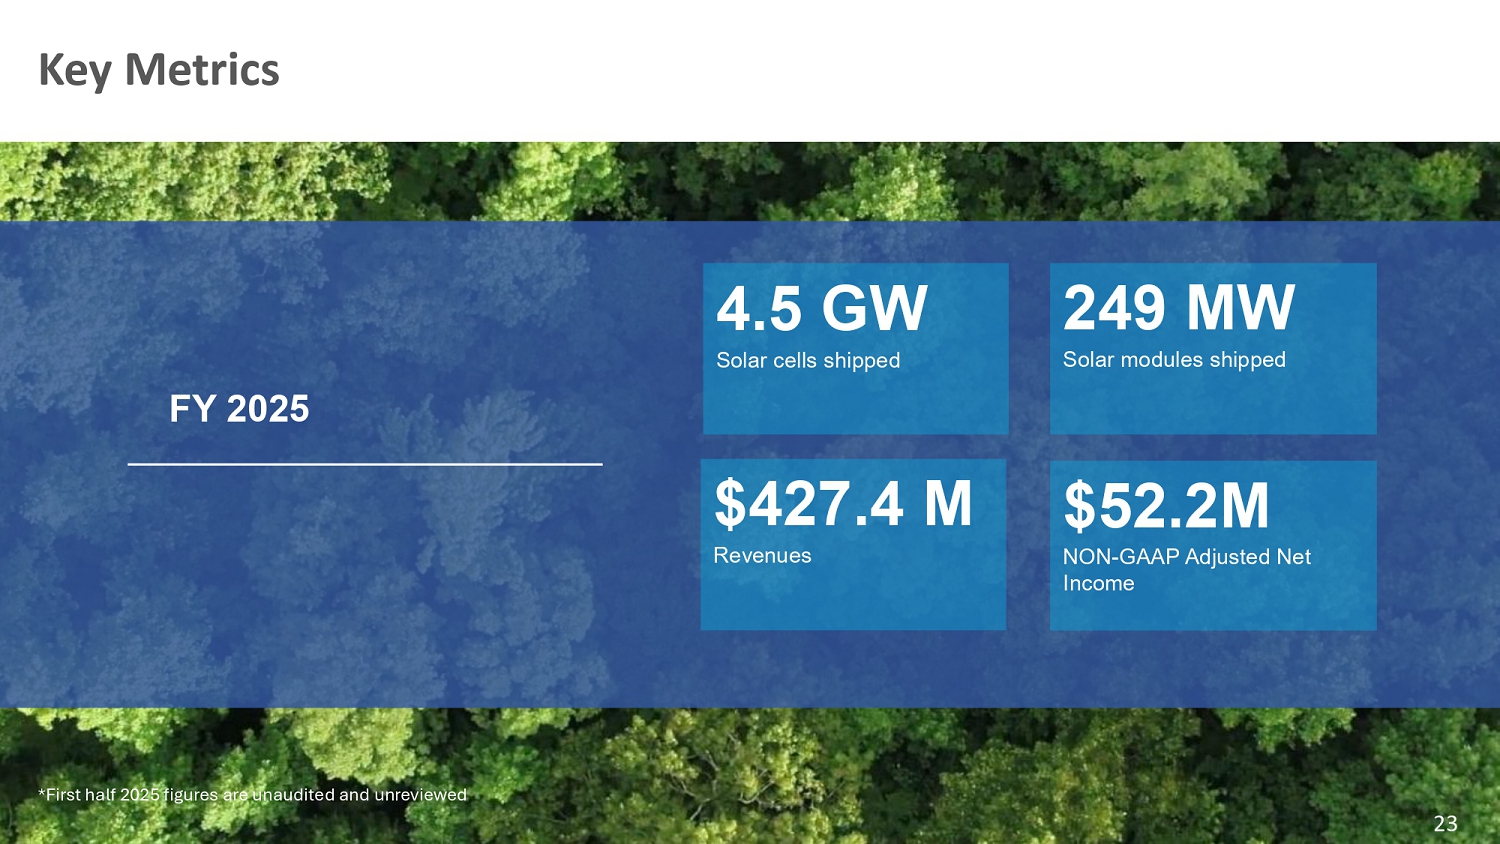
Key Metrics 4.5 GW Solar cells shipped FY 2025 23 $427.4 M Revenues 249 MW Solar modules shipped $52.2M NON - GAAP Adjusted Net Income *First half 2025 figures are unaudited and unreviewed
Use of Non - GAAP Financial Measure Some of the financial information and data contained in this press release, such as EBITDA, Adjusted EBITDA and Adjusted Net Income have not been prepared in accordance with U.S. generally accepted accounting principles (“GAAP”). TOYO believes these non - GAAP measures of financial results provide useful information to management and investors regarding certain financial and business trends relating to TOYO’s financial condition and results of operations. TOYO’s management uses these non - GAAP measures for trend analysis and for budgeting and planning purposes. TOYO believes that the use of these non - GAAP measures provides an additional tool for investors to evaluate projected operating results and trends, as well as compare TOYO’s financial measures with those of other similar companies, many of which also present similar non - GAAP financial measures to investors. Management of TOYO does not consider these non - GAAP measures in isolation or as an alternative to financial measures determined in accordance with GAAP. The principal limitation of these non - GAAP financial measures is that they exclude significant expenses such as share - based compensation and changes in fair value of contingent consideration and income that are required by GAAP to be recorded in TOYO’s financial statements. In addition, they are subject to inherent limitations as they reflect the exercise of judgments by management about which expenses and income are excluded or included in determining these non - GAAP financial measures. You should review TOYO’s audited financial statements, which are presented in the most recent annual report on Form 20 - F filed with the SEC on March 31, 2026, and not rely on any single financial measure to evaluate TOYO’s business.
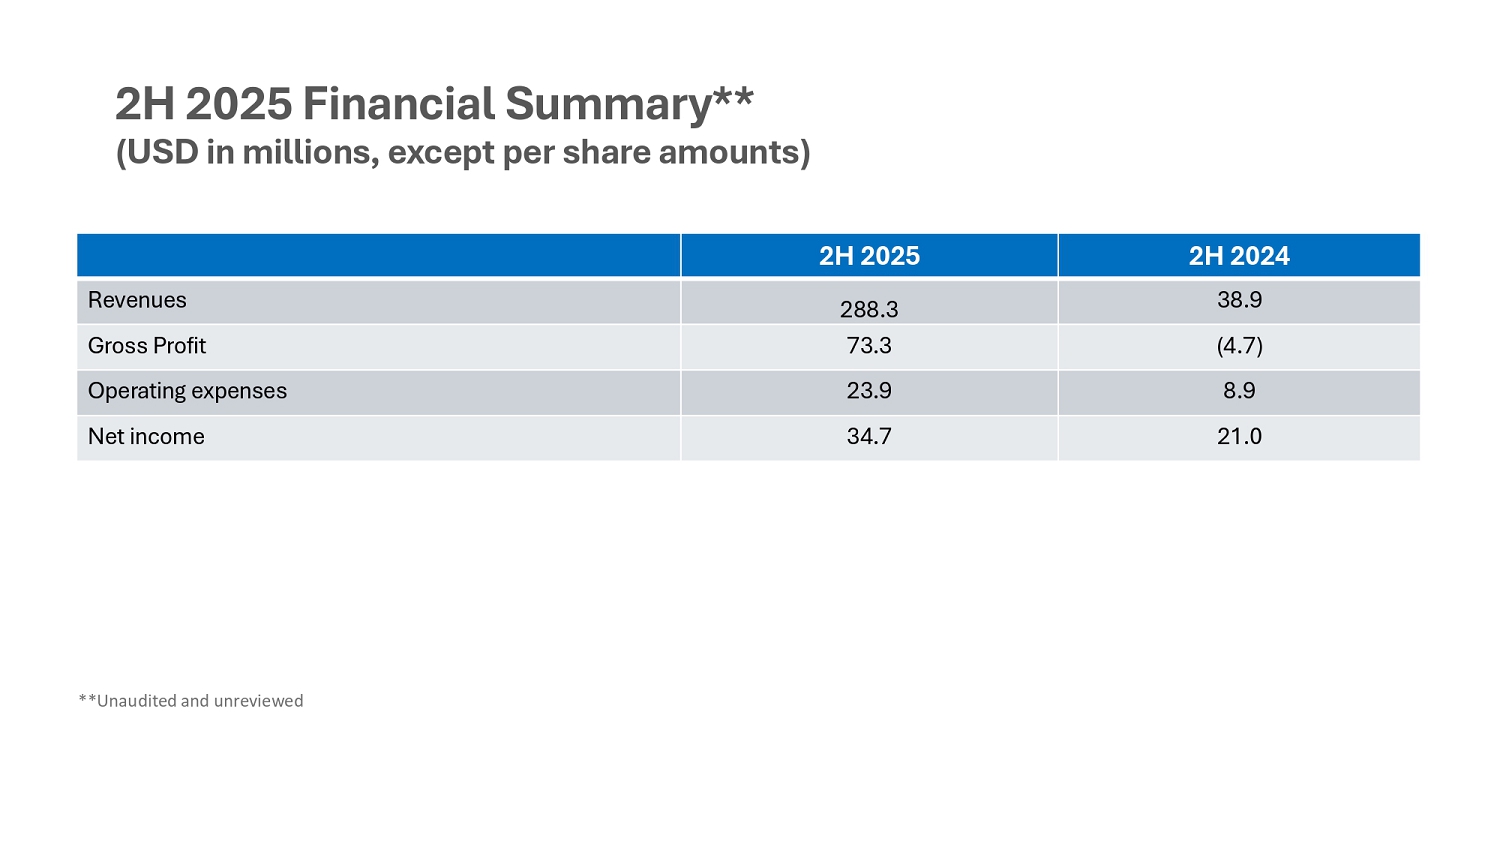
2H 2025 Financial Summary** (USD in millions, except per share amounts) 2H 2024 2H 2025 38.6 288.3 Revenues (4.7) 73.3 Gross Profit 8.6 23.6 Operating expenses 21.0 34.7 Net income **Unaudited and unreviewed
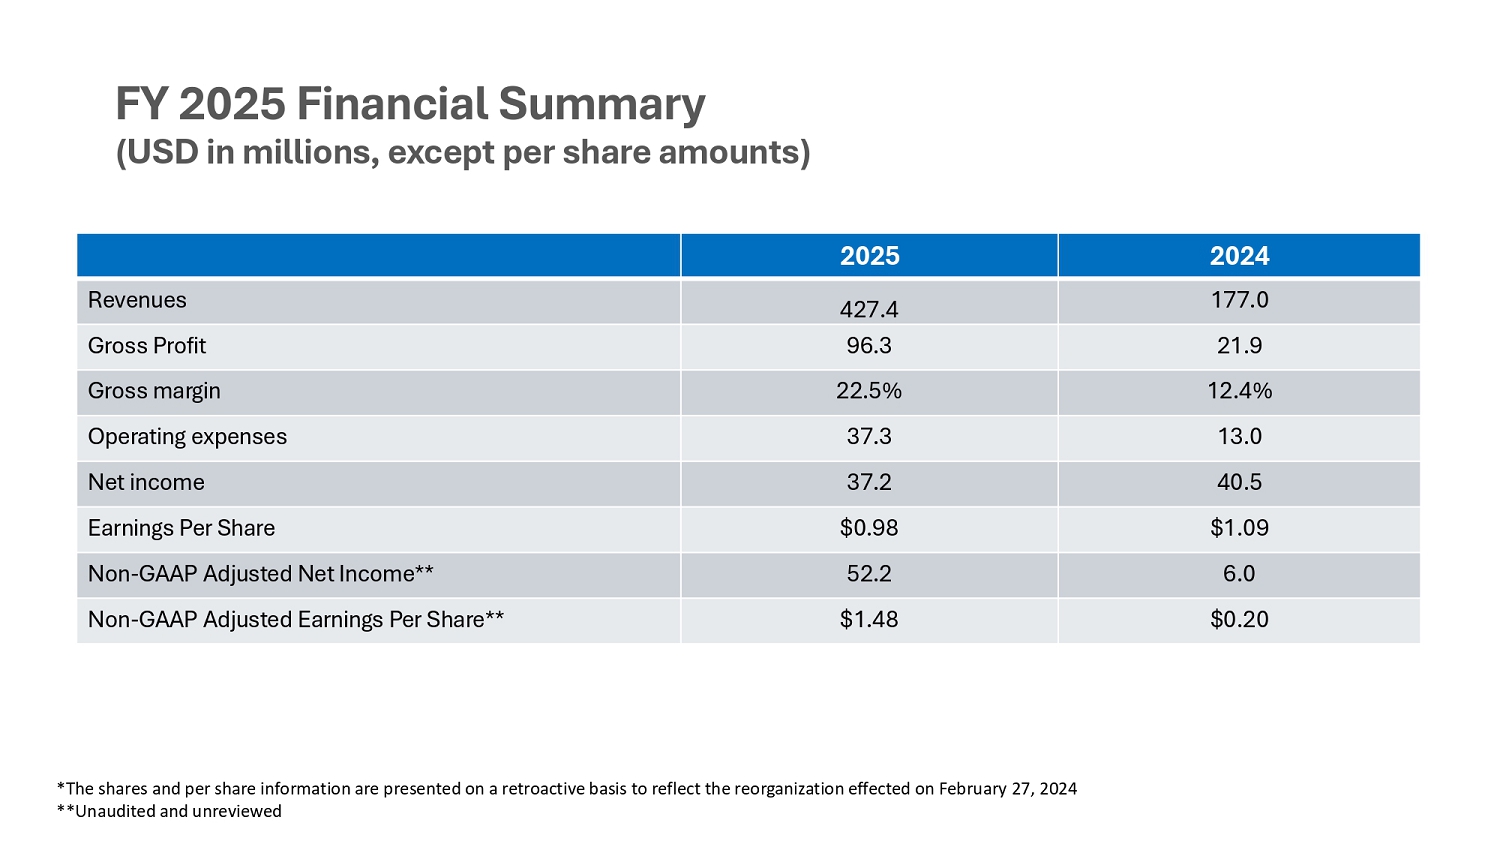
FY 2025 Financial Summary (USD in millions, except per share amounts) 2024 2025 177.0 427.4 Revenues 21.6 66.3 Gross Profit 12.4% 22.5% Gross margin 13.0 37.3 Operating expenses 40.5 37.2 Net income $1.06 $0.68 Earnings Per Share 6.0 52.2 Non - GAAP Adjusted Net Income** $0.20 $1.48 Non - GAAP Adjusted Earnings Per Share** *The shares and per share information are presented on a retroactive basis to reflect the reorganization effected on February 27, 2024 **Unaudited and unreviewed
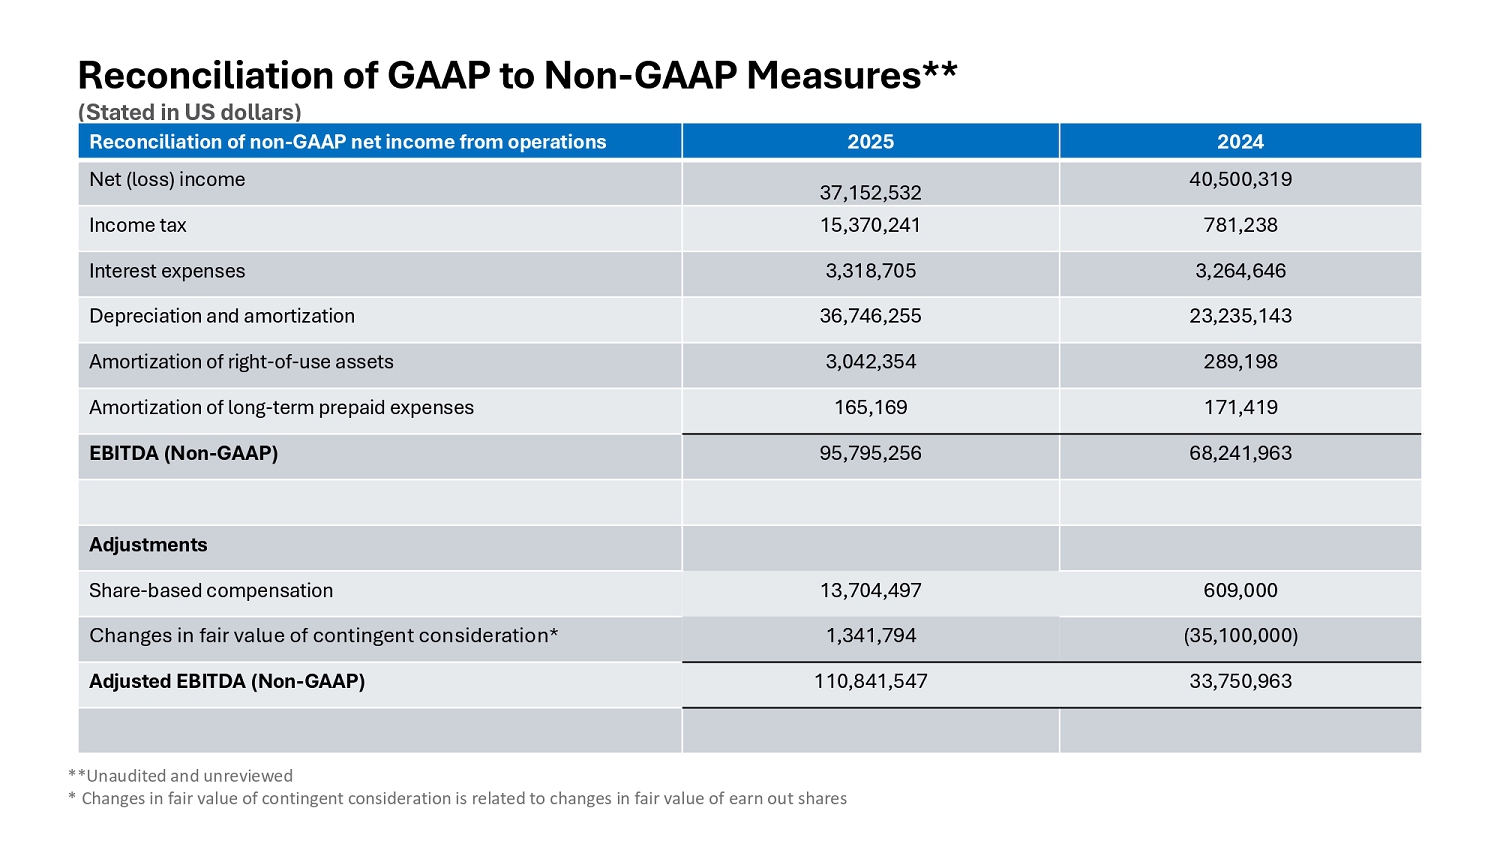
Reconciliation of GAAP to Non - GAAP Measures** (Stated in US dollars) 2024 2025 Reconciliation of non - GAAP net income from operations 40,500,316 37,152,532 Net (loss) income 781,238 15,370,241 Income tax 3,264,646 3,318,705 Interest expenses 23,235,143 36,746,255 Depreciation and amortization 286,168 3,042,354 Amortization of right - of - use assets 171,416 165,166 Amortization of long - term prepaid expenses 68,241,663 65,765,256 EBITDA (Non - GAAP) Adjustments 606,000 13,704,467 Share - based compensation (35,100,000) 1,341,764 Changes in fair value of contingent consideration* 33,750,663 110,841,547 Adjusted EBITDA (Non - GAAP) **Unaudited and unreviewed * Changes in fair value of contingent consideration is related to changes in fair value of earn out shares
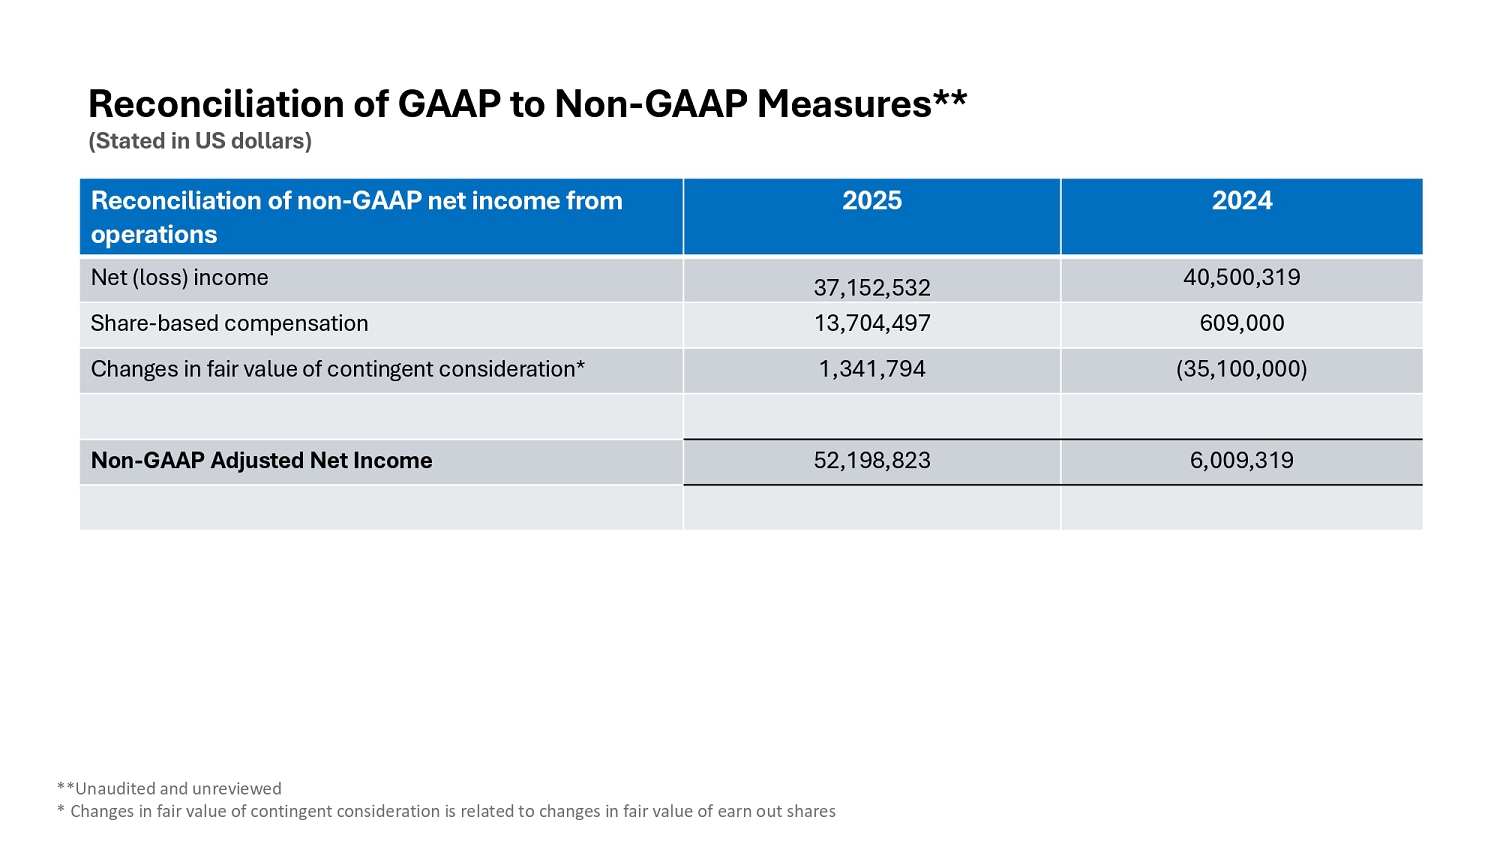
Reconciliation of GAAP to Non - GAAP Measures** (Stated in US dollars) 2024 2025 Reconciliation of non - GAAP net income from operations 40,500,316 37,152,532 Net (loss) income 606,000 13,704,467 Share - based compensation (35,100,000) 1,341,794 Changes in fair value of contingent consideration* 6,006,316 52,168,823 Non - GAAP Adjusted Net Income **Unaudited and unreviewed * Changes in fair value of contingent consideration is related to changes in fair value of earn out shares
29 Appendix
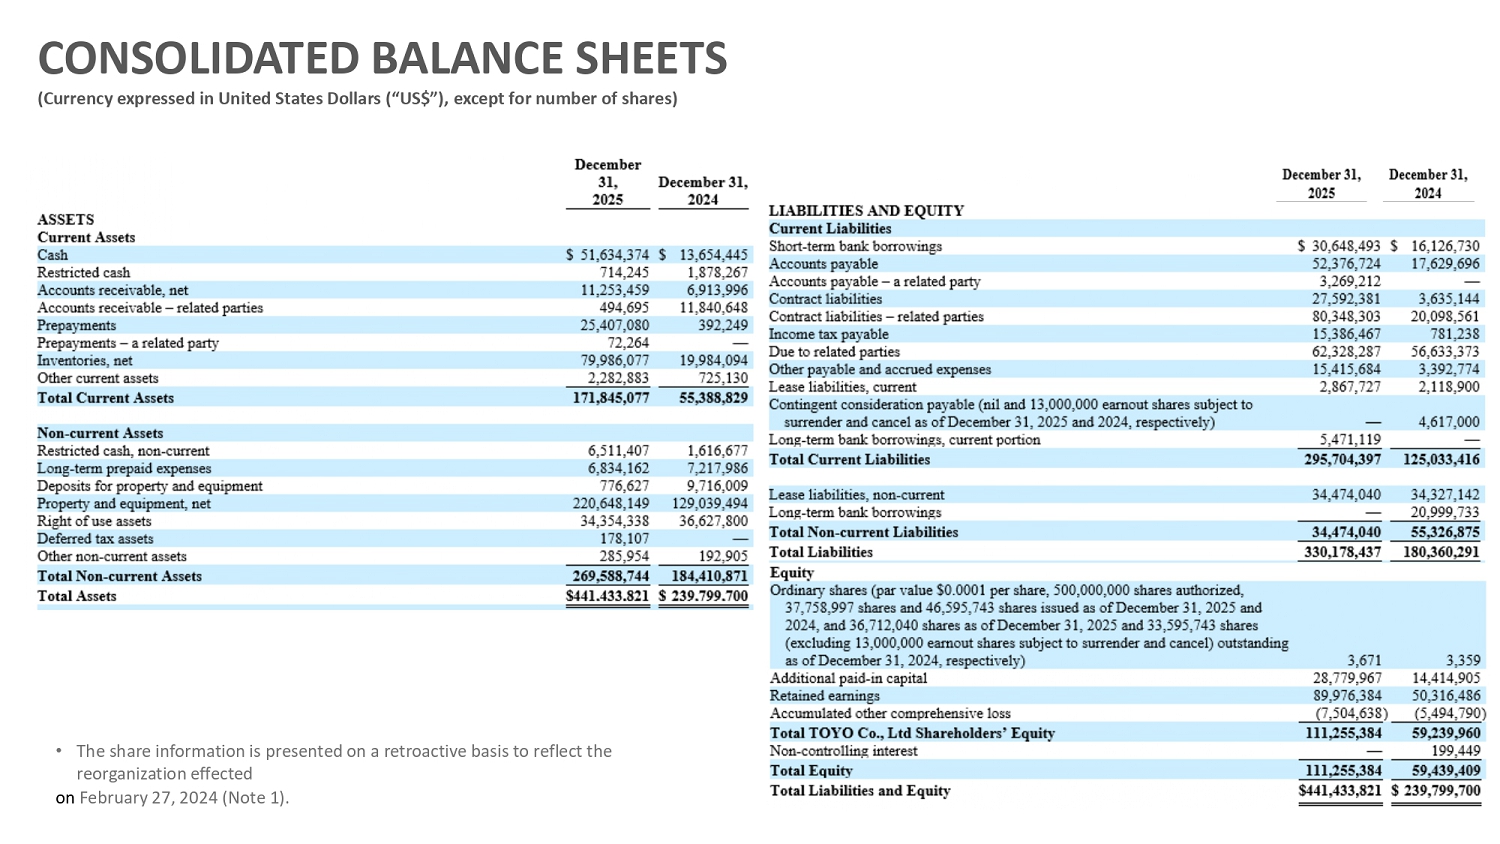
CONSOLIDATED BALANCE SHEETS (Currency expressed in United States Dollars (“US$”), except for number of shares) • The share information is presented on a retroactive basis to reflect the reorganization effected on February 27, 2024 (Note 1).
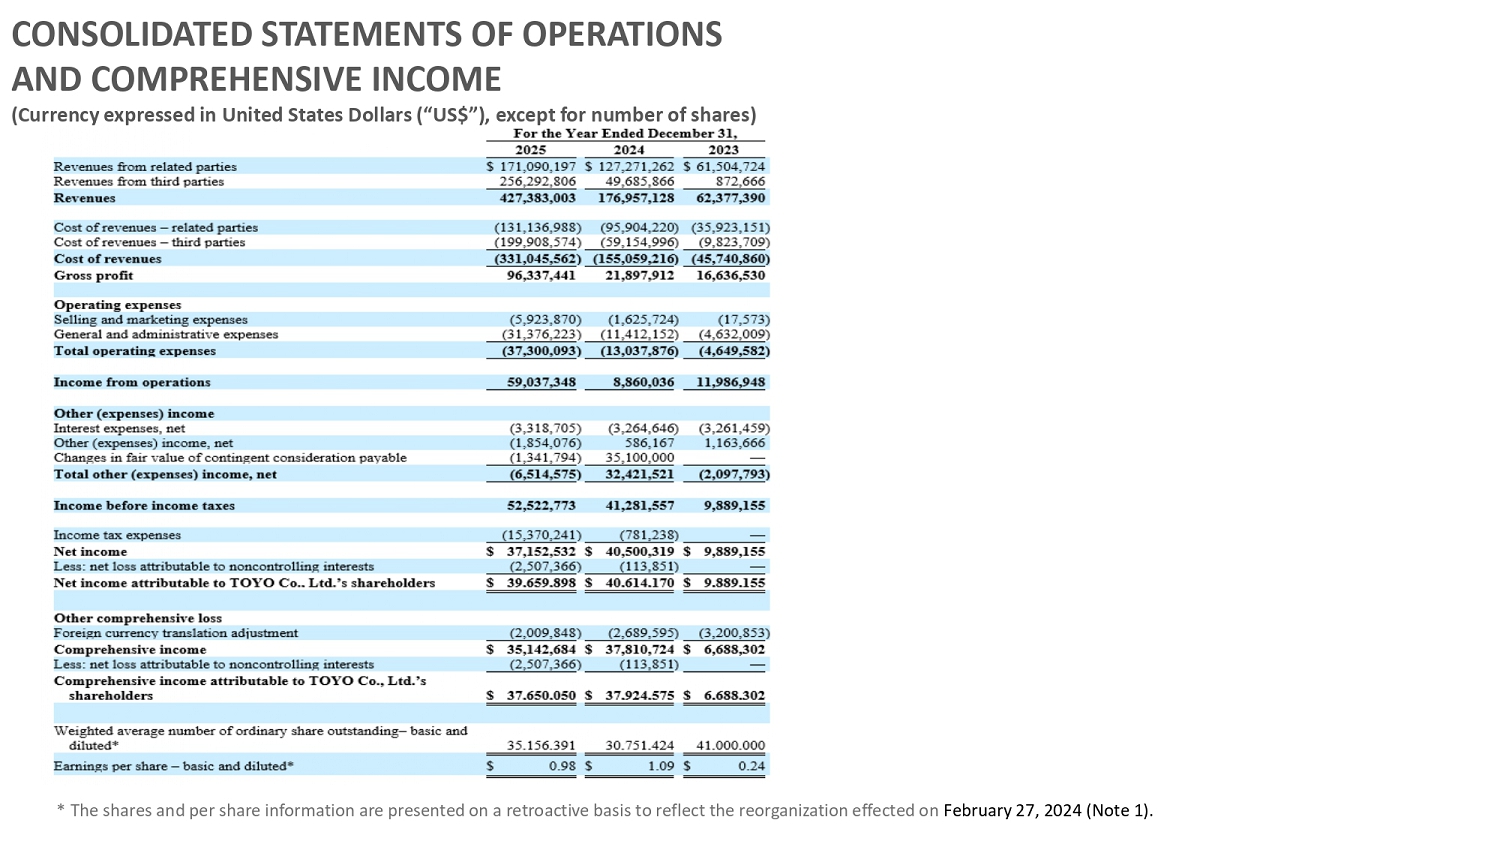
CONSOLIDATED STATEMENTS OF OPERATIONS AND COMPREHENSIVE INCOME (Currency expressed in United States Dollars (“US$”), except for number of shares) * The shares and per share information are presented on a retroactive basis to reflect the reorganization effected on February 27, 2024 (Note 1).
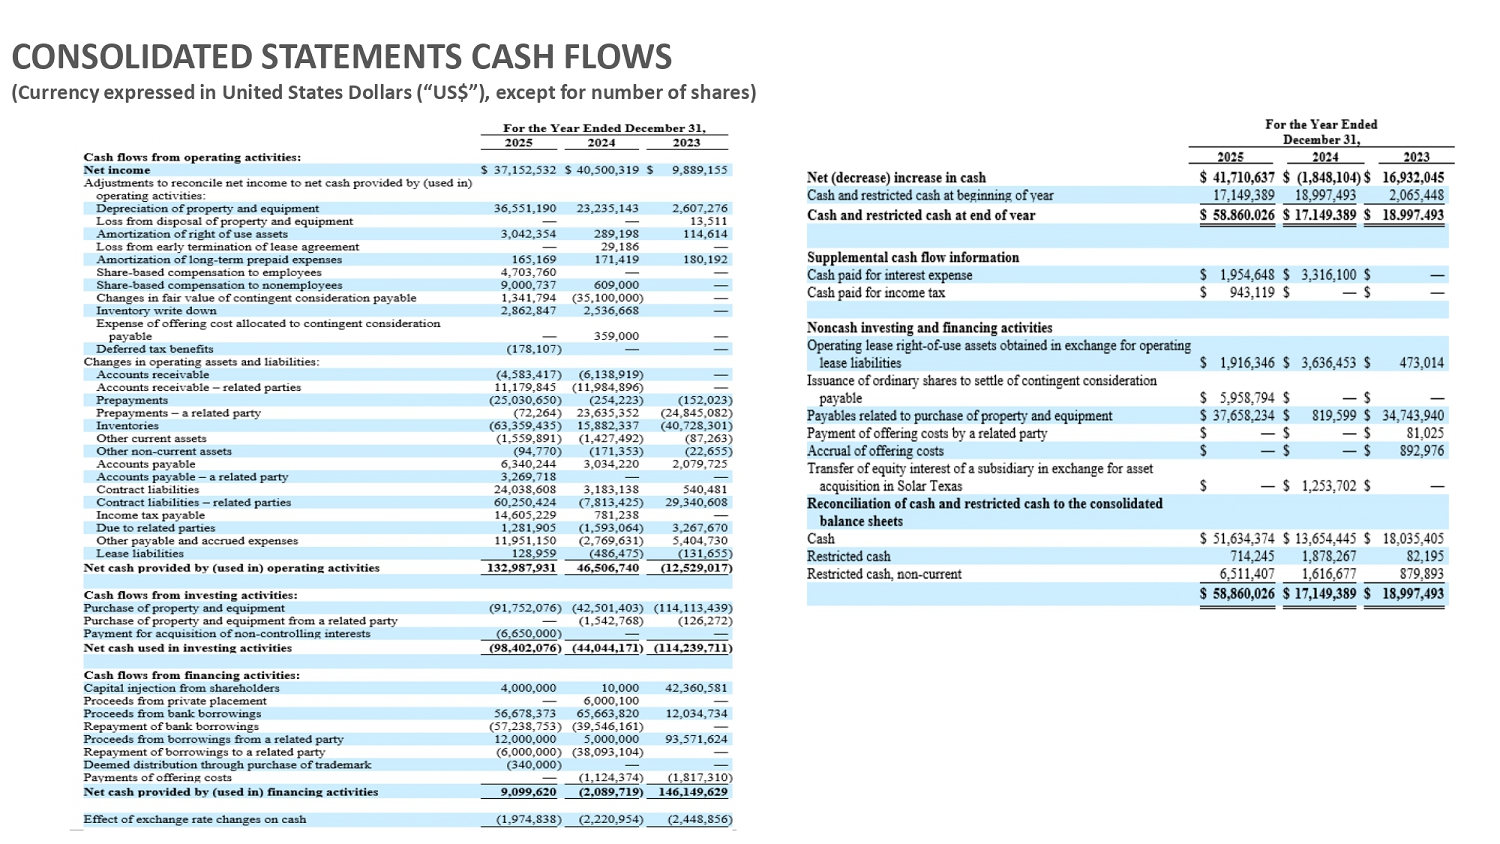
CONSOLIDATED STATEMENTS CASH FLOWS (Currency expressed in United States Dollars (“US$”), except for number of shares)