Pay vs Performance Disclosure - USD ($)
Jan. 05, 2023
Dec. 31, 2023
Oct. 09, 2023
May 31, 2023
Dec. 31, 2025
Dec. 31, 2024
Dec. 31, 2023
The following table sets forth information concerning the compensation of our current principal executive officer (“PEO”) and remaining named executive officers, as well as compensation of our former PEOs, for each of the fiscal years ended December 31, 2025, 2024 and 2023, and our financial performance for each such fiscal year:
| Year | Summary Compensation Table Total for PEO(1) | Compensation Actually Paid to PEO(1) | Summary Compensation Table Total for Travis Mickle(2) | Compensation Actually Paid to Travis Mickle(2) | Summary Compensation Table Total for Richard W. Pascoe(3) | Compensation Actually Paid to Richard W. Pascoe(3) | Summary Compensation Table Total for Christal M. M. Mickle(4) | Compensation Actually Paid to Christal M. M. Mickle(4) | Average Summary Compensation Table Total for Non-PEO NEOs(5) | Average Compensation Actually Paid to Non-PEO NEOs(5) | Value of Initial Fixed $100 Based on: | Net Income | ||||||||||||||||||||||||||
| Total Shareholder Return | ||||||||||||||||||||||||||||||||||||||
| 2025 | $3,782,042 | $3,998,044 | $— | $— | $— | $— | $— | $— | $2,696,649 | $1,937,906 | $195.21 | $83,229,000 | ||||||||||||||||||||||||||
| 2024 | $5,355,059 | $7,323,149 | $— | $— | $— | $— | $— | $— | $1,982,865 | $1,837,951 | $181.70 | ($105,511,000) | ||||||||||||||||||||||||||
| 2023 | $3,445,231 | $4,975,770 | $3,593,438 | $4,385,998 | $4,122,558 | $3,308,589 | $1,669,956 | $2,211,127 | $2,039,861 | $2,724,999 | $142.70 | ($46,049,000) | ||||||||||||||||||||||||||
Non-PEO NEOs
•2025: R. LaDuane Clifton, MBA, CPA, and Rahsaan W. Thompson
•2024: R. LaDuane Clifton, MBA, CPA, and Adrian Quartel, M.D., FFPM
•2023: R. LaDuane Clifton, MBA, CPA, and Joshua Schafer, M.S., MBA
| 2025 | ||||||||||||||
| Adjustments | Current PEO | Average Non-PEO | ||||||||||||
Deduction for Amounts Reported under the “Stock Awards” and “Option Awards” Columns in the Summary Compensation Table for Applicable FY | $ | (2,622,375) | $ | (1,597,844) | ||||||||||
Increase based on ASC 718 Fair Value of Awards Granted during Applicable FY that Remain Unvested as of Applicable FY End, determined as of Applicable FY End | $ | 2,143,890 | $ | 323,524 | ||||||||||
Increase based on ASC 718 Fair Value of Awards Granted during Applicable FY that Vested during Applicable FY, determined as of Vesting Date | — | $ | 413,124 | |||||||||||
Increase/deduction for Awards Granted during Prior FY that were Outstanding and Unvested as of Applicable FY End, determined based on change in ASC 718 Fair Value from Prior FY End to Applicable FY End | $ | 398,794 | $ | 41,334 | ||||||||||
Increase/deduction for Awards Granted during Prior FY that Vested During Applicable FY, determined based on change in ASC 718 Fair Value from Prior FY End to Vesting Date | $ | 295,693 | $ | 61,119 | ||||||||||
Deduction of ASC 718 Fair Value of Awards Granted during Prior FY that were Forfeited during Applicable FY, determined as of Prior FY End | — | — | ||||||||||||
Increase based on Dividends or Other Earnings Paid during Applicable FY prior to Vesting Date | — | — | ||||||||||||
Total Adjustments | $ | 216,002 | $ | (758,743) | ||||||||||
COMPENSATION ACTUALLY PAID VERSUS TOTAL STOCKHOLDER RETURN
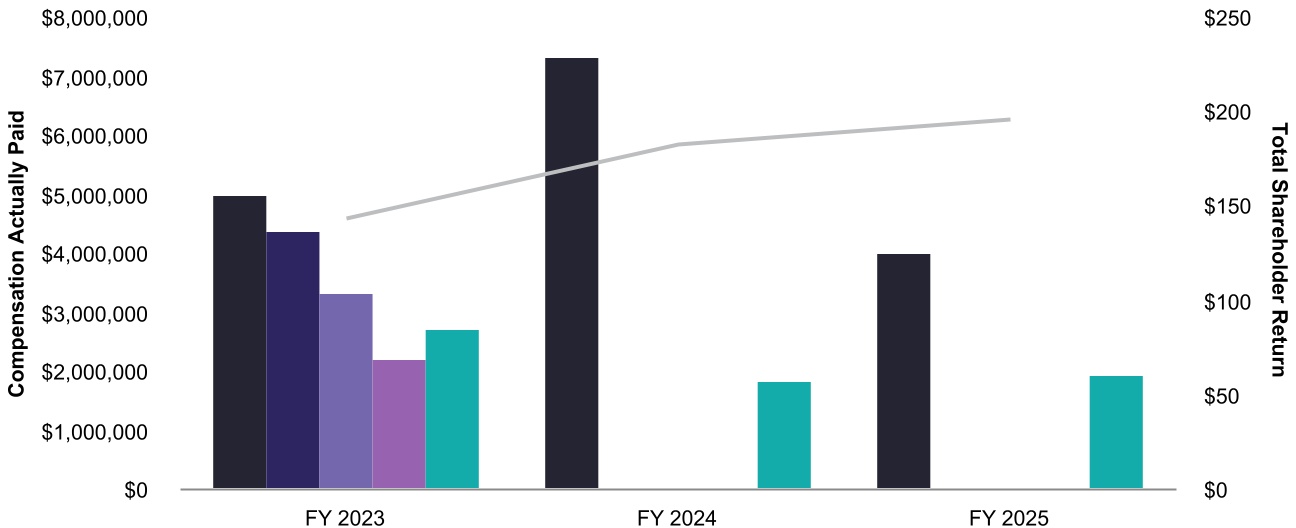
| ¢ | Current PEO Compensation Actually Paid | ¢ | Travis Mickle, Ph.D. Compensation Actually Paid | ¢ | Richard W. Pascoe Compensation Actually Paid | ||||||||||||||||||
| ¢ | Christal M.M. Mickle Compensation Actually Paid | ¢ | Non-PEO NEO Average Compensation Actually Paid |  | Cumulative TSR | ||||||||||||||||||
COMPENSATION ACTUALLY PAID VERSUS NET INCOME
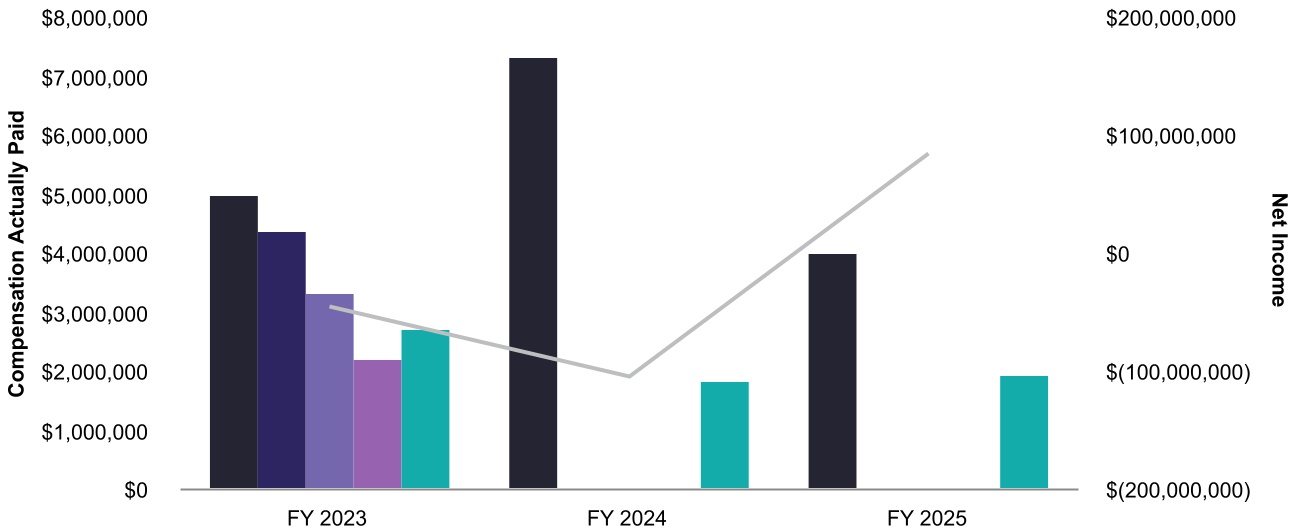
| ¢ | Current PEO Compensation Actually Paid | ¢ | Travis Mickle, Ph.D. Compensation Actually Paid | ¢ | Richard W. Pascoe Compensation Actually Paid | ||||||||||||||||||
| ¢ | Christal M.M. Mickle Compensation Actually Paid | ¢ | Non-PEO NEO Average Compensation Actually Paid | | Net Loss | ||||||||||||||||||
In accordance with the SEC’s disclosure requirements regarding pay versus performance, or PVP, this section presents the SEC-defined “Compensation Actually Paid,” or CAP. Also required by the SEC, this section compares CAP to various measures used to gauge our performance. CAP is a supplemental measure to be viewed alongside performance measures as an addition to the philosophy and strategy of compensation-setting discussed elsewhere in the overview of the executive compensation program, not in replacement.
The graphs below compare the compensation actually paid to our PEOs and the average of the compensation actually paid to our remaining named executive officers, with (i) our cumulative TSR, and (ii) our net income, in each case, for the fiscal years ended December 31, 2025, 2024 and 2023. TSR amounts reported in the graph assume an initial fixed investment of $100.