Pay vs Performance Disclosure - USD ($)
Apr. 28, 2025
May 01, 2022
Dec. 31, 2022
Dec. 31, 2025
Dec. 31, 2025
Dec. 31, 2024
Dec. 31, 2023
Dec. 31, 2022
Dec. 31, 2021
Pay Versus Performance
As required by SEC rules, we are providing the information below about the relationship between executive compensation, as computed in accordance with SEC rules, and certain measures of the Company’s financial performance. For further information concerning the Company’s pay for performance philosophy and how the Company’s aligns executive compensation with the Company’s performance, please see the “Compensation Discussion and Analysis” (“CD&A”) section of this proxy statement.
Pay Versus Performance Table
Summary Compensation Total for PEO | Compensation Actually Paid to PEO | Value of Initial $100 Investment Based on: | ||||||||||||||||||||||||||||||||||||
Fiscal Year | CEO/ PEO1(1)(3) ($) | PEO2(1)(2)(3) ($) | PEO3(2)(3) ($) | PEO1(2)(3)(4)(5) ($) | PEO2(1)(4)(5)(6) ($) | PEO3(1)(3)(4)(6) ($) | Average Summary Compensation Table Total for Non-PEO NEOs(2) ($) | Average Compensation Actually Paid to Non-PEO NEOs(4)(5)(6) ($) | PODD Total Shareholder Return ($) | Peer Group Total Shareholder Return ($) | Net Income (in millions) ($) | Adjusted Revenue (7) (in millions) ($) | ||||||||||||||||||||||||||
(A) | (B1) | (B2) | (B3) | (C1) | (C2) | (C3) | (D) | (E) | (F) | (G) | (H) | (I) | ||||||||||||||||||||||||||
2025 | $18,858,968 | $13,224,270 | — | $25,206,415 | ($32,119,390) | — | $3,811,666 | $3,860,314 | $111.19 | $99.39 | $247.1 | $2,662.9 | ||||||||||||||||||||||||||
2024 | — | $13,302,350 | — | — | $32,707,769 | — | $3,341,659 | $6,553,447 | $102.13 | $81.07 | $418.3 | $2,074.1 | ||||||||||||||||||||||||||
2023 | — | $12,379,765 | — | — | $12,803,863 | — | $2,840,156 | $351,212 | $84.88 | $81.77 | $206.3 | $1,689.3 | ||||||||||||||||||||||||||
2022 | — | $10,817,028 | $15,711,252 | — | $16,062,320 | $13,495,700 | $3,375,872 | $4,244,342 | $115.16 | $76.75 | $4.6 | $1,331.0 | ||||||||||||||||||||||||||
2021 | — | — | $9,723,273 | — | — | $9,120,882 | $2,585,706 | $2,613,046 | $104.08 | $96.45 | $16.8 | $1,091.9 | ||||||||||||||||||||||||||
(1) | During 2025, both Ashley McEvoy (PEO1) and James Hollingshead (PEO2) served Insulet’s Principal Executive Officer (PEO) for a portion of the year. Mr. Hollingshead served as PEO from January 1, 2025 to April 28, 2025 and Ms. McEvoy served as PEO from April 28, 2025 to December 31, 2025. |
(2) | During 2022, both James Hollingshead and Shacey Petrovic (PEO3) served as Insulet’s PEO for a portion of the year. Ms. Petrovic served as PEO in 2021, and from January 1, 2022 to June 1, 2022. Mr. Hollingshead served as PEO from June 1, 2022 to December 31, 2022, in 2023 and 2024, and from January 1, 2025 to April 28, 2025. |
(3) | These amounts represent compensation set forth in the “Total” column of the Summary Compensation Table for our PEO and an average of the Summary Compensation totals for the following non-PEO named executive officers (“Other NEOs”) for the years indicated: |
Year | PEO | Non-PEO NEOs (Other NEOs) | ||||||
2025 | Ashley McEvoy James Hollingshead | Flavia Pease, Eric Benjamin, John Kapples, Prem Singh, Ana Chadwick, Mark Field | ||||||
2024 | James Hollingshead | Ana Chadwick, Eric Benjamin, John Kapples, Mark Field, Lauren Budden | ||||||
2023 | James Hollingshead | Lauren Budden, Eric Benjamin, John Kapples, Mark Field, Wayde McMillan, Bret Christensen | ||||||
2022 | James Hollingshead Shacey Petrovic | Wayde McMillan, Charles Alpuche, Bret Christensen, Eric Benjamin | ||||||
2021 | Shacey Petrovic | Wayde McMillan, Charles Alpuche, Bret Christensen, John Kapples | ||||||
(4) | Amounts represent “compensation actually paid” as computed in accordance with SEC rules (“compensation actually paid” or “CAP”) to our PEO and the average “compensation actually paid”, also as computed in accordance with SEC rules, to the Other NEOs for the years indicated above. The dollar amounts do not reflect the actual amount of compensation earned by or paid to the executives during the applicable years. For information regarding the decisions made by our Talent and Compensation Committee relating to executive compensation, see the “Compensation Discussion and Analysis” section of this proxy statement. |
(5) | The table below reflects the amounts deducted and added to the Summary Compensation Table total compensation in order to determine compensation actually paid, as defined and computed in accordance with SEC rules. |
Executive | Fiscal Year | Total Reported in Summary Compensation Table | - Grant Date Fair Value of Option Awards and Stock Awards Granted in Fiscal Year | + Fair Value at Fiscal Year-End of Outstanding and Unvested Option Awards and Stock Awards Granted in 2025 | + Change in Fair Value of Outstanding and Unvested Option Awards and Stock Awards Granted in Prior Fiscal Years | + Change in Fair Value as of Vesting Date of Option Awards and Stock Awards Granted in Prior Fiscal Years for Which Applicable Vesting Conditions Were Satisfied During Fiscal Year | - Fair Value as of Prior Fiscal Year- End of Option Awards and Stock Awards Granted in Prior Fiscal Years that Failed to Meet Applicable Vesting Conditions during Fiscal Year(a)(b) | Compensation Actually Paid | ||||||||||||||||||
Ashley McEvoy (CEO/PEO1) | 2025 | $18,858,968 | ($15,958,763) | $22,306,209 | $0 | $0 | $0 | $25,206,415 | ||||||||||||||||||
James Hollingshead (PEO2) | 2025 | $13,224,270 | ($10,647,118) | $0 | $0 | $790,852 | ($35,487,394) | ($32,119,390) | ||||||||||||||||||
2024 | $13,302,350 | ($10,249,856) | $25,478,850 | $4,713,605 | ($537,180) | $0 | $32,707,769 | |||||||||||||||||||
2023 | $12,379,765 | ($9,499,797) | $11,615,643 | ($1,533,273) | ($158,475) | $0 | $12,803,863 | |||||||||||||||||||
2022 | $10,817,028 | ($8,999,878) | $14,245,170 | $0 | $0 | $0 | $16,062,320 | |||||||||||||||||||
Shacey Petrovic (PEO3) | 2022 | $15,711,252 | ($14,006,044) | $11,115,887 | $1,586,091 | ($911,486) | $0 | $13,495,700 | ||||||||||||||||||
2021 | $9,723,273 | ($7,999,379) | $7,011,866 | ($692,234) | $1,077,356 | $0 | $9,120,882 | |||||||||||||||||||
Average for Other NEOs | 2025 | $3,811,666 | ($2,556,106) | $3,104,837 | $483,405 | $66,748 | ($1,050,236) | $3,860,314 | ||||||||||||||||||
2024 | $3,341,659 | ($2,289,749) | $5,179,609 | $443,080 | ($121,153) | $0 | $6,553,447 | |||||||||||||||||||
2023 | $2,840,156 | ($1,835,437) | $1,003,036 | ($240,497) | $115,240 | ($1,531,286) | $351,212 | |||||||||||||||||||
2022 | $3,375,872 | ($2,274,727) | $2,984,865 | $450,758 | ($292,425) | $0 | $4,244,342 | |||||||||||||||||||
2021 | $2,585,706 | ($1,674,745) | $1,484,500 | ($55,242) | $272,828 | $0 | $2,613,046 | |||||||||||||||||||
(a) | Messrs. Christensen and McMillan left the Company on May 5, 2023 and October 20, 2023, respectively. Their outstanding unvested stock awards and option awards were forfeited in 2023 and will not be realized. |
(b) | Mr. Hollingshead left the Company on April 28, 2025. His outstanding stock awards and option awards were forfeited in 2025 and will not be realized. |
(6) | Equity values used to determine the deductions and additions set forth in the tables in note 4 above to calculate “compensation actually paid” for our CEO/PEO and average “compensation actually paid” for our Other NEOs are calculated in accordance with ASC 718. Adjustments with respect to stock option awards have been made as of each measurement date using the stock price as of the measurement date and updated assumptions (i.e., term volatility and risk-free rates) as of the relevant measurement date in accordance with U.S. GAAP. Adjustments with respect to the PSUs are based on both the stock price as of the measurement date as well as our estimate of the probable outcome of the performance conditions applicable to each PSU award. |
(7) | Adjusted revenue is Insulet’s self-selected most important financial metric used to determine compensation actually paid in the most recent fiscal year. Adjusted revenue, which is a non-GAAP financial measure, is annual revenue as reported in the Company’s publicly filed financial statements, adjusted to exclude variances attributable to fluctuations in foreign exchange rates (i.e., on a constant currency basis). |
(1) | During 2025, both Ashley McEvoy (PEO1) and James Hollingshead (PEO2) served Insulet’s Principal Executive Officer (PEO) for a portion of the year. Mr. Hollingshead served as PEO from January 1, 2025 to April 28, 2025 and Ms. McEvoy served as PEO from April 28, 2025 to December 31, 2025. |
(2) | During 2022, both James Hollingshead and Shacey Petrovic (PEO3) served as Insulet’s PEO for a portion of the year. Ms. Petrovic served as PEO in 2021, and from January 1, 2022 to June 1, 2022. Mr. Hollingshead served as PEO from June 1, 2022 to December 31, 2022, in 2023 and 2024, and from January 1, 2025 to April 28, 2025. |
(3) | These amounts represent compensation set forth in the “Total” column of the Summary Compensation Table for our PEO and an average of the Summary Compensation totals for the following non-PEO named executive officers (“Other NEOs”) for the years indicated: |
Year | PEO | Non-PEO NEOs (Other NEOs) | ||||||
2025 | Ashley McEvoy James Hollingshead | Flavia Pease, Eric Benjamin, John Kapples, Prem Singh, Ana Chadwick, Mark Field | ||||||
2024 | James Hollingshead | Ana Chadwick, Eric Benjamin, John Kapples, Mark Field, Lauren Budden | ||||||
2023 | James Hollingshead | Lauren Budden, Eric Benjamin, John Kapples, Mark Field, Wayde McMillan, Bret Christensen | ||||||
2022 | James Hollingshead Shacey Petrovic | Wayde McMillan, Charles Alpuche, Bret Christensen, Eric Benjamin | ||||||
2021 | Shacey Petrovic | Wayde McMillan, Charles Alpuche, Bret Christensen, John Kapples | ||||||
The following graph compares the compensation actually paid to our PEOs and the average of compensation actually paid to our Other NEOs with Insulet’s cumulative total shareholder return (“PODD TSR”) and the cumulative total shareholder return of the Nasdaq Healthcare Index (“IXHC TSR”). The PODD TSR and the IXHC TSR assume that $100 was invested beginning on December 31, 2020. The PODD TSR declined from December 31, 2022 to December 31, 2023, recovered from December 31, 2023 to December 31, 2024 and continued to increase from December 31, 2024 to December 31, 2025.
(5) | The table below reflects the amounts deducted and added to the Summary Compensation Table total compensation in order to determine compensation actually paid, as defined and computed in accordance with SEC rules. |
Executive | Fiscal Year | Total Reported in Summary Compensation Table | - Grant Date Fair Value of Option Awards and Stock Awards Granted in Fiscal Year | + Fair Value at Fiscal Year-End of Outstanding and Unvested Option Awards and Stock Awards Granted in 2025 | + Change in Fair Value of Outstanding and Unvested Option Awards and Stock Awards Granted in Prior Fiscal Years | + Change in Fair Value as of Vesting Date of Option Awards and Stock Awards Granted in Prior Fiscal Years for Which Applicable Vesting Conditions Were Satisfied During Fiscal Year | - Fair Value as of Prior Fiscal Year- End of Option Awards and Stock Awards Granted in Prior Fiscal Years that Failed to Meet Applicable Vesting Conditions during Fiscal Year(a)(b) | Compensation Actually Paid | ||||||||||||||||||
Ashley McEvoy (CEO/PEO1) | 2025 | $18,858,968 | ($15,958,763) | $22,306,209 | $0 | $0 | $0 | $25,206,415 | ||||||||||||||||||
James Hollingshead (PEO2) | 2025 | $13,224,270 | ($10,647,118) | $0 | $0 | $790,852 | ($35,487,394) | ($32,119,390) | ||||||||||||||||||
2024 | $13,302,350 | ($10,249,856) | $25,478,850 | $4,713,605 | ($537,180) | $0 | $32,707,769 | |||||||||||||||||||
2023 | $12,379,765 | ($9,499,797) | $11,615,643 | ($1,533,273) | ($158,475) | $0 | $12,803,863 | |||||||||||||||||||
2022 | $10,817,028 | ($8,999,878) | $14,245,170 | $0 | $0 | $0 | $16,062,320 | |||||||||||||||||||
Shacey Petrovic (PEO3) | 2022 | $15,711,252 | ($14,006,044) | $11,115,887 | $1,586,091 | ($911,486) | $0 | $13,495,700 | ||||||||||||||||||
2021 | $9,723,273 | ($7,999,379) | $7,011,866 | ($692,234) | $1,077,356 | $0 | $9,120,882 | |||||||||||||||||||
Average for Other NEOs | 2025 | $3,811,666 | ($2,556,106) | $3,104,837 | $483,405 | $66,748 | ($1,050,236) | $3,860,314 | ||||||||||||||||||
2024 | $3,341,659 | ($2,289,749) | $5,179,609 | $443,080 | ($121,153) | $0 | $6,553,447 | |||||||||||||||||||
2023 | $2,840,156 | ($1,835,437) | $1,003,036 | ($240,497) | $115,240 | ($1,531,286) | $351,212 | |||||||||||||||||||
2022 | $3,375,872 | ($2,274,727) | $2,984,865 | $450,758 | ($292,425) | $0 | $4,244,342 | |||||||||||||||||||
2021 | $2,585,706 | ($1,674,745) | $1,484,500 | ($55,242) | $272,828 | $0 | $2,613,046 | |||||||||||||||||||
(a) | Messrs. Christensen and McMillan left the Company on May 5, 2023 and October 20, 2023, respectively. Their outstanding unvested stock awards and option awards were forfeited in 2023 and will not be realized. |
(b) | Mr. Hollingshead left the Company on April 28, 2025. His outstanding stock awards and option awards were forfeited in 2025 and will not be realized. |
The following graph compares the compensation actually paid to our PEOs and the average of compensation actually paid to our Other NEOs with Insulet’s cumulative total shareholder return (“PODD TSR”) and the cumulative total shareholder return of the Nasdaq Healthcare Index (“IXHC TSR”). The PODD TSR and the IXHC TSR assume that $100 was invested beginning on December 31, 2020. The PODD TSR declined from December 31, 2022 to December 31, 2023, recovered from December 31, 2023 to December 31, 2024 and continued to increase from December 31, 2024 to December 31, 2025.
PEO and Average Other NEO compensation generally follows a similar pattern for that period: declining from December 31, 2022 to December 31, 2023 and increasing from December 31, 2023 to December 31, 2024. PEO and Average Other NEO CAP decreased overall in 2025 in part due to the termination of Mr. Hollingshead as our PEO and the hiring of Ms. McEvoy as our PEO in April 2025. Due to these events, the CAP to Mr. Hollingshead reflects forfeiture of unearned equity awards and the CAP for Ms. McEvoy reflects compensation for a partial year, from April 28, 2025 to December 31, 2025. We anticipate that PEO CAP will increase in 2026, reflecting a full year of compensation for Ms. McEvoy. Additionally, the PODD TSR since December 31, 2020 is positive and higher than the IXHC TSR for the same period.
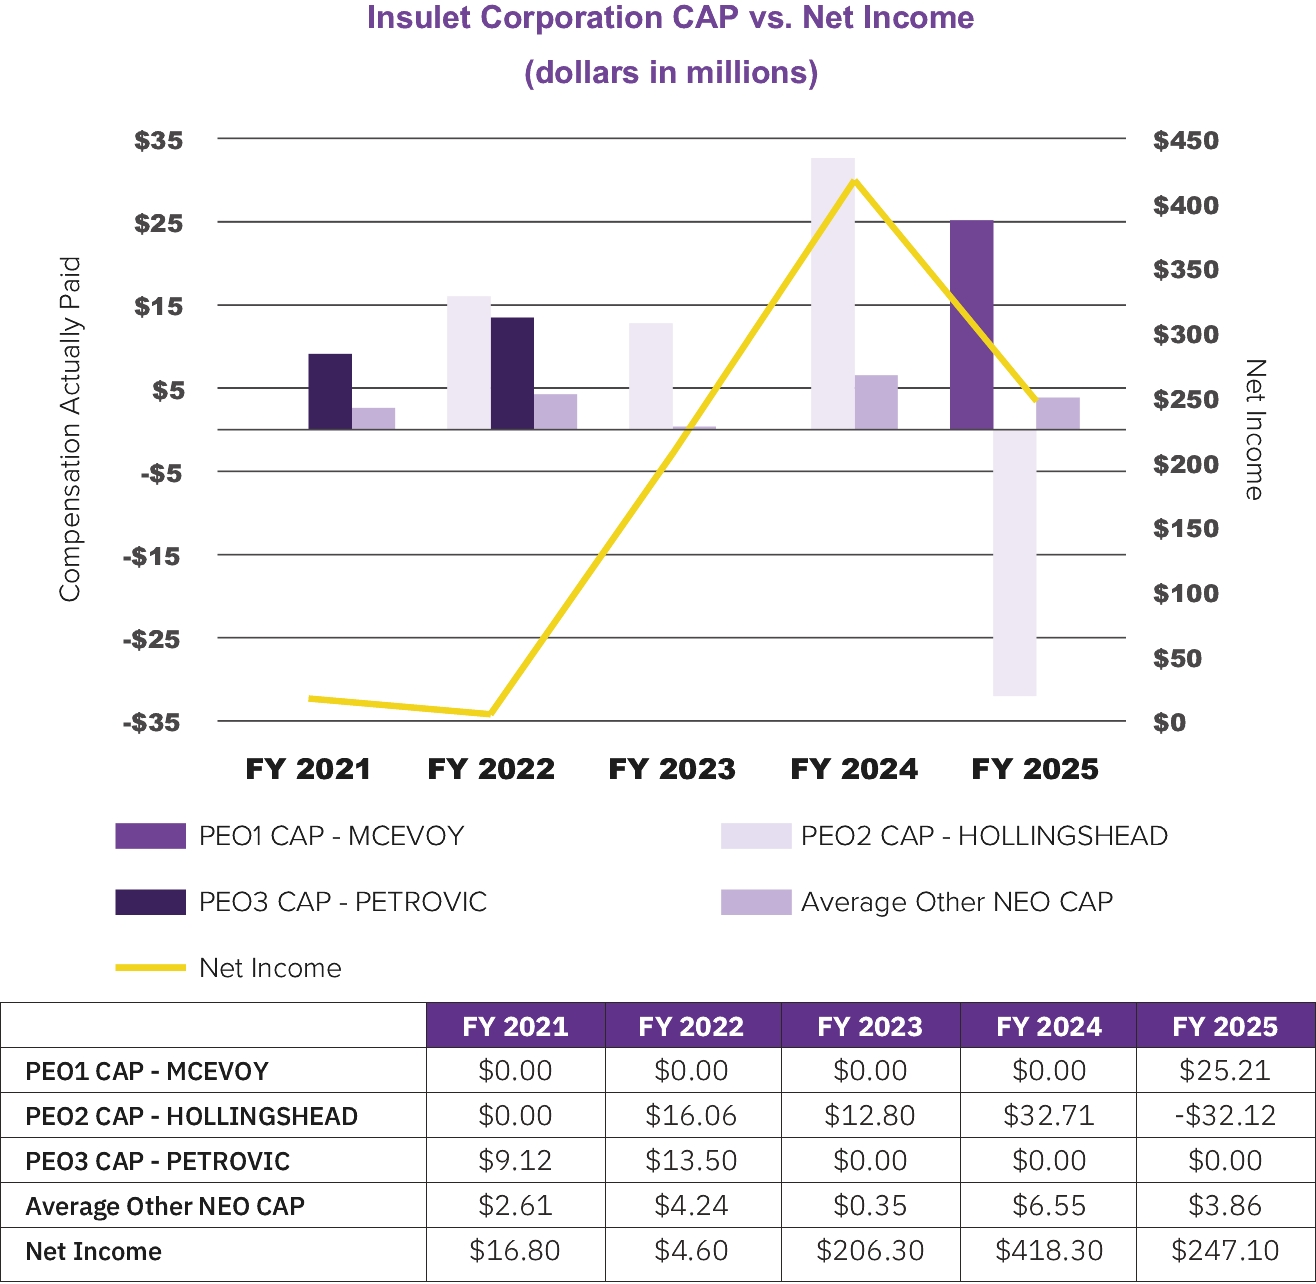
The following graph compares the compensation actually paid to each of our PEOs and the average of compensation actually paid to our Other NEOs with our net income. The Company’s net income increased considerably from 2023 to 2024 and then decreased from 2024 to 2025. In addition, PEO and average NEO compensation actually paid increased between 2023 and 2024 then decreased between 2024 and 2025. Net income is not a financial measure used by our Talent and Compensation Committee to link the compensation actually paid to our NEOs to Company performance.
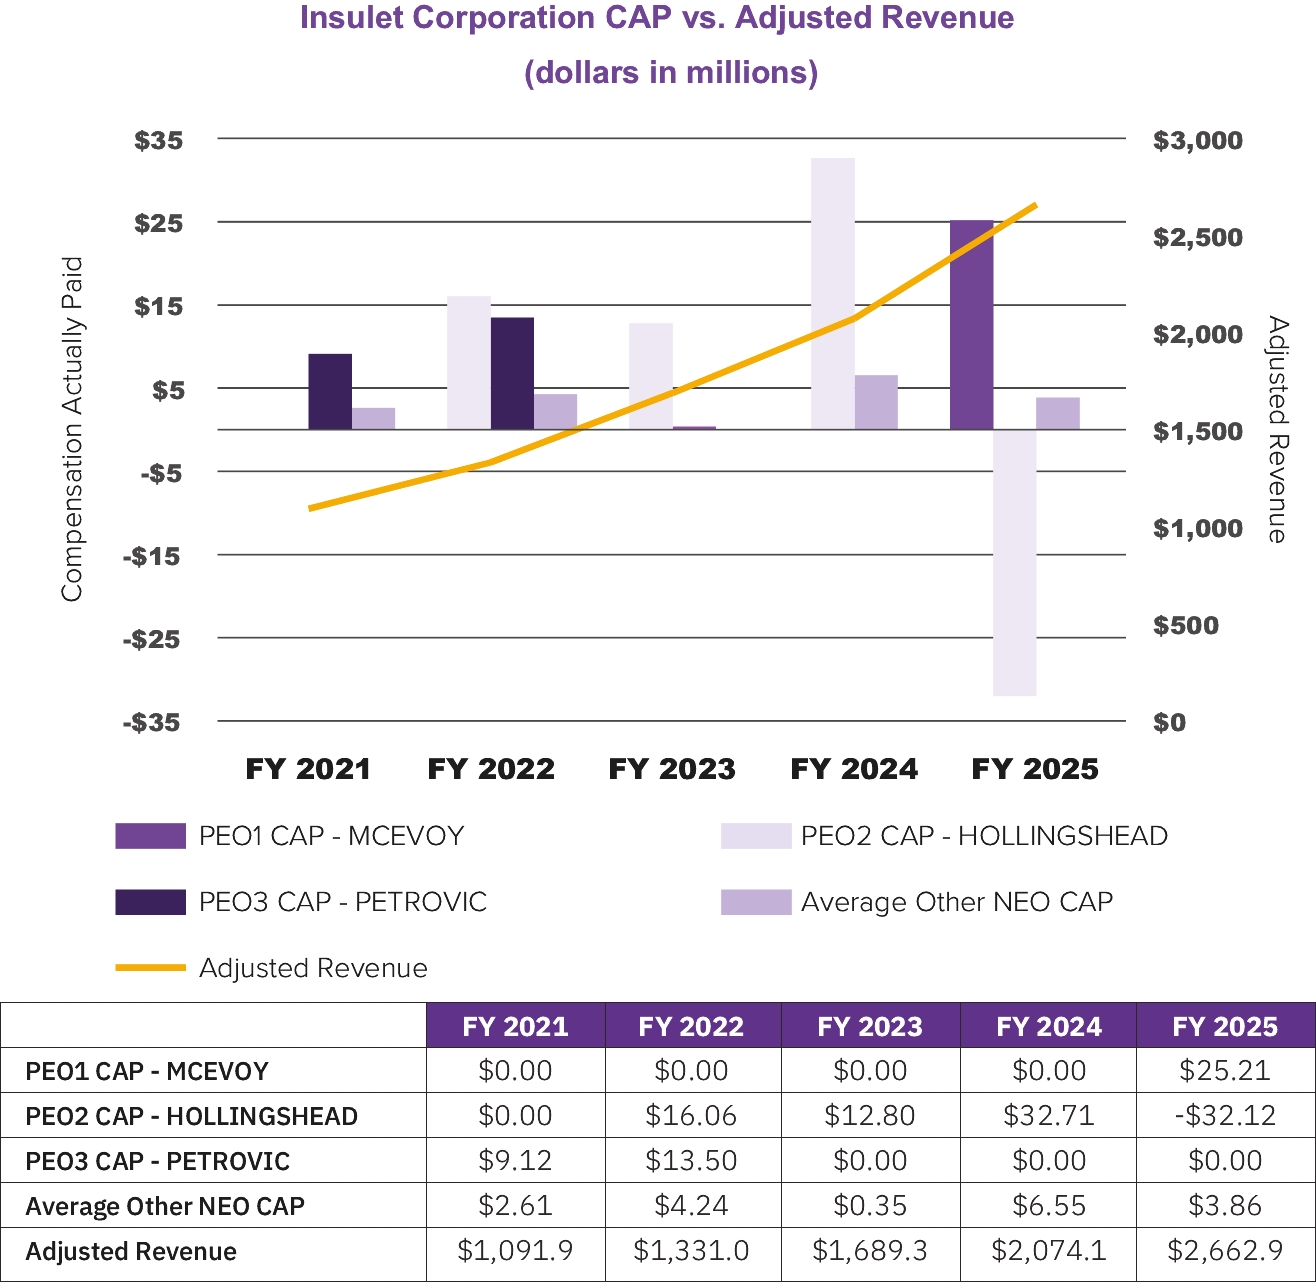
The following graph compares the compensation actually paid to our PEO and the average compensation actually paid to our Other NEOs with our adjusted revenue. The Company’s adjusted revenue increased considerably from 2023 to 2024 and from 2024 to 2025. CAP also increased from 2023 to 2024 and decreased from 2024 to 2025. The decrease in CAP in 2025 was in part due to the termination of Mr. Hollingshead as our PEO and the hiring of Ms. McEvoy as our PEO in April 2025, as further detailed in the lead-in to the Insulet Corporation CAP vs. TSR Graph on page 53. As noted above and in the 2025 Compensation Elements and Decisions section of the CD&A, Adjusted Revenue is one of the most important financial measures used to link compensation actually paid to our NEOs to company performance and is the most heavily weighted measure in the Annual Incentive Plan and for our PSUs.
The following graph compares the compensation actually paid to our PEOs and the average of compensation actually paid to our Other NEOs with Insulet’s cumulative total shareholder return (“PODD TSR”) and the cumulative total shareholder return of the Nasdaq Healthcare Index (“IXHC TSR”). The PODD TSR and the IXHC TSR assume that $100 was invested beginning on December 31, 2020. The PODD TSR declined from December 31, 2022 to December 31, 2023, recovered from December 31, 2023 to December 31, 2024 and continued to increase from December 31, 2024 to December 31, 2025.
PEO and Average Other NEO compensation generally follows a similar pattern for that period: declining from December 31, 2022 to December 31, 2023 and increasing from December 31, 2023 to December 31, 2024. PEO and Average Other NEO CAP decreased overall in 2025 in part due to the termination of Mr. Hollingshead as our PEO and the hiring of Ms. McEvoy as our PEO in April 2025. Due to these events, the CAP to Mr. Hollingshead reflects forfeiture of unearned equity awards and the CAP for Ms. McEvoy reflects compensation for a partial year, from April 28, 2025 to December 31, 2025. We anticipate that PEO CAP will increase in 2026, reflecting a full year of compensation for Ms. McEvoy. Additionally, the PODD TSR since December 31, 2020 is positive and higher than the IXHC TSR for the same period.
2025 Financial Performance Measures
For the fiscal year ended December 31, 2025, the most important financial performance measures used to link compensation actually paid to our NEOs (including our PEOs) to company performance were Adjusted Revenue, Adjusted EBIT and Relative TSR. As discussed in the “Compensation Discussion and Analysis” (“CD&A”) section of the proxy statement, these measures are used in our Annual Incentive Plan as well as for our PSUs issued under our Long-Term Equity Incentive Plan. For our 2025 Annual Incentive Plan, we also utilized non-financial strategic measures, as described in the CD&A.
Important Financial Performance Measures | ||
Adjusted Revenue | ||
Adjusted EBIT | ||
Relative TSR | ||
(7) | Adjusted revenue is Insulet’s self-selected most important financial metric used to determine compensation actually paid in the most recent fiscal year. Adjusted revenue, which is a non-GAAP financial measure, is annual revenue as reported in the Company’s publicly filed financial statements, adjusted to exclude variances attributable to fluctuations in foreign exchange rates (i.e., on a constant currency basis). |