Value of Initial Fixed $100 | |||||||||||||||||||||||
Investment Based On: | |||||||||||||||||||||||
Core Funds | |||||||||||||||||||||||
Summary | Summary | Average | Average | From | |||||||||||||||||||
Compensation | Compensation | Compensation | Compensation | Summary | Compensation | Peer | Operations | ||||||||||||||||
Table Total | Actually Paid | Table Total for | Actually Paid | Compensation | Actually Paid | Total | Group Total | per Share | |||||||||||||||
Fiscal | for Benjamin | to Benjamin W. | Timothy J. | to Timothy J. | Table Total for | to Non-PEO | Shareholder | Shareholder | Net | (Core | |||||||||||||
Year | W. Schall(1) | Schall(2) | Naughton(3) | Naughton(2) | Non-PEO NEOs | NEOs(2) | Return(4) | Return(5) | Income(6) | FFO)(7) | |||||||||||||
2025 | | 9,663,500 | | 1,583,396 | | NA | | NA | | 4,211,729 | (8) | 1,863,693 | (8) | $ | 134 | | $ | 130 | | 1,056,599 | | $ | 11.24 |
2024 |
| 9,090,073 | | 16,768,387 | | NA | | NA | | 4,185,417 | (8) | 6,402,770 | (8) | $ | 156 | | $ | 142 | | 1,082,175 | | $ | 11.01 |
2023 |
| 9,479,687 |
| 17,461,680 |
| NA | | NA |
| 4,108,271 | (9) | 6,556,935 | (9) | $ | 129 | $ | 118 |
| 928,438 | $ | 10.63 | ||
2022 | 9,393,208 |
| 3,772,678 |
| 9,814,142 |
| (1,308,884) |
| 4,187,942 | (9) | 1,457,095 | (9) | $ | 107 | $ | 111 |
| 1,136,438 | $ | 9.79 | |||
2021 |
| NA |
| NA |
| 14,371,460 |
| 26,154,241 |
| 7,495,804 | (10) | 10,290,484 | (10) | $ | 162 | $ | 164 |
| 1,004,356 | $ | 8.26 | ||
| (1) | Mr. Schall joined AvalonBay as President and a director in January 2021 and became Chief Executive Officer effective January 3, 2022. Mr. Schall’s compensation for 2021 is included in the non-PEO averages. |
| (3) | Mr. Naughton served as Chief Executive Officer from 2012 through January 2, 2022 and served as Executive Chairman throughout 2022. He served as a non-executive chairman in 2023, 2024 and 2025. |
| (8) | Non-PEO NEOs for 2025 and 2024 include Messrs. O’Shea, Birenbaum, Breslin, and Ms. Thomas. |
| (9) | Non-PEO NEOs for 2023 and 2022 include Messrs. O’Shea, Birenbaum, Breslin, and Schulman. |
| (5) | The peer group TSR used for this purpose is the FTSE Nareit Apartment REIT Index, a published industry index. |
| (2) | The amounts reported represent the “compensation actually paid” to each of Mr. Schall and Mr. Naughton and the average “compensation actually paid” to each of the other NEOs as a group, each computed in accordance with Item 402(v) of Regulation S-K, but do not reflect the actual amount of compensation earned by or paid to such NEOs. In accordance with Item 402(v) of Regulation S-K, the following adjustments were made to the amounts reported in the “Total” column of the Summary Compensation Table to calculate “compensation actually paid.” |
| | | | | | | For Awards | | | | | | | |
Outstanding | ||||||||||||||
(Unvested) as of | ||||||||||||||
December 31 of | For Awards | |||||||||||||
the Applicable | that Vested | |||||||||||||
Subtract | For Awards | Year, Add the | During the | |||||||||||
Summary | Subtracted in | Change in Fair | Applicable Year, | Add | ||||||||||
Compensation | Column | Value Between | Add the Change | Dividends | ||||||||||
Table Value | (B), Add the Fair | December 31 of | in Fair Value | Paid on | ||||||||||
of Equity Awards | Value of Such | the Prior Fiscal | Between | Unvested | ||||||||||
Granted in the | Awards on | Year and | December 31 of | Restricted | ||||||||||
Summary | Applicable Fiscal | December 31 of | December 31 of | the Prior Fiscal | Stock During | |||||||||
Compensation | Year (Grant Date | the Applicable | the Applicable | Year and the | the Applicable | Compensation | ||||||||
Table Total | Fair Value) (i) | Year (ii) | Fiscal Year (iii) | Vesting Date (iv) | Fiscal Year | Actually Paid | ||||||||
Year | (A) | (B) | (C) | (D) | (E) | (F) | (G) | |||||||
2025 – PEO |
| 9,663,500 |
| (6,802,100) |
| 4,897,856 | (3,521,977) |
| (2,749,716) |
| 95,833 |
| 1,583,396 | |
2025 – Avg |
| 4,211,729 |
| (2,497,171) |
| 1,912,929 | (1,014,620) |
| (815,305) |
| 66,131 |
| 1,863,693 | |
2024 – PEO |
| 9,090,073 |
| (6,223,901) |
| 10,049,766 |
| 2,383,680 |
| 1,368,536 |
| 100,233 |
| 16,768,387 |
2024 – Avg |
| 4,185,417 |
| (2,519,469) |
| 3,654,930 |
| 680,855 |
| 341,838 |
| 59,199 |
| 6,402,770 |
2023 – PEO |
| 9,479,687 |
| (6,407,807) |
| 9,203,656 |
| 2,046,598 |
| 3,010,112 |
| 129,434 |
| 17,461,680 |
2023 – Avg |
| 4,108,271 |
| (2,374,971) |
| 3,224,566 |
| 579,192 |
| 960,183 |
| 59,694 |
| 6,556,935 |
2022 – PEO |
| 9,393,208 |
| (6,351,246) |
| 3,705,283 |
| (2,786,237) |
| (342,670) |
| 154,340 |
| 3,772,678 |
2022 – PEO |
| 9,814,142 |
| (7,343,192) |
| 3,696,749 |
| (6,766,814) |
| (924,797) |
| 215,028 |
| (1,308,884) |
2022 – Avg |
| 4,187,942 |
| (2,524,777) |
| 1,453,657 |
| (1,513,615) |
| (212,401) |
| 66,289 |
| 1,457,095 |
2021 – PEO |
| 14,371,460 |
| (10,551,826) |
| 14,011,349 |
| 4,604,039 |
| 3,373,073 |
| 346,146 |
| 26,154,241 |
2021 – Avg |
| 7,495,804 |
| (5,049,488) |
| 6,223,603 |
| 925,342 |
| 583,792 |
| 111,431 |
| 10,290,484 |
| (i) | The amounts reported represent the sum of the amounts reported in the “Stock Awards” and “Option Awards” columns of the Summary Compensation Table for the applicable fiscal year. |
| (ii) | No awards granted during a fiscal year vested that same year. |
| (iii) | Represents the sum of the following for each equity award that was outstanding (unvested) as of December 31 of the applicable fiscal year and December 31 of the prior fiscal year: the difference between (x) the fair value of such award as of December 31 of the applicable fiscal year and (y) the fair value of such award as of December 31 of the prior fiscal year. For performance awards, the fair value represents the Monte Carlo valuation for the TSR portion and the payout corresponding to the interim level of achievement of the operating metrics portion. For options, fair value represents the Black-Scholes value. |
| (iv) | For a multi-year performance award that matured (vested) on December 31 of the reported year, the fair value was the number of units earned valued at the closing price of a share of common stock on the last trading day of that year, plus the cash amount in respect of accrued dividends to be paid out upon settlement. |
Tabular List of Performance Measures
The following table includes financial performance measures that the Company determined are its most important financial measures for 2025 and they are reflected in our multi-year performance awards or annual bonus program.
Financial Measure |
Total Shareholder Return |
Core FFO per Share |
Three-year Compounded Annual Growth Rate of Core FFO per Share Relative to Apartment REIT Companies |
Same Store Residential Revenue |
Development Yield |
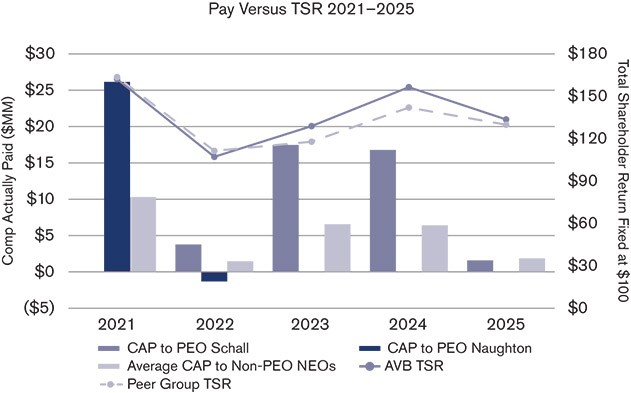
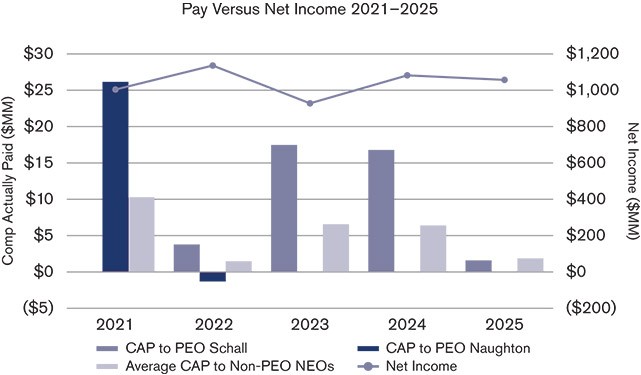
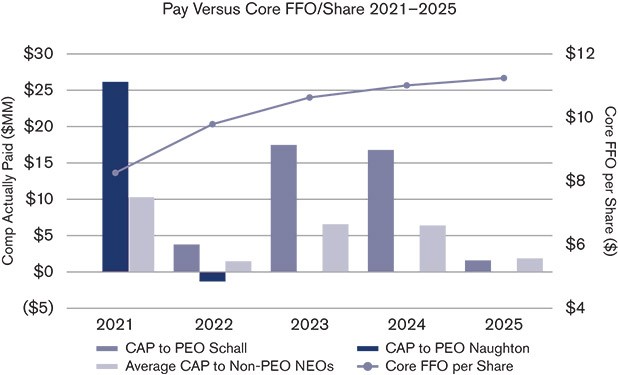
As required by Item 402(v) of Regulation S-K, we are providing information for our Chief Executive Officer (who is our principal executive officer or “PEO”) and the other NEOs about the relationship between “compensation actually paid” to such individuals (as calculated in accordance with Item 402(v) of Regulation S-K) and certain financial performance measures. For additional information on our compensation programs and philosophy and how we design our compensation programs to align pay with performance, see the section titled “Compensation Discussion and Analysis”.
For AvalonBay, the “compensation actually paid” to our NEOs for a given year, as calculated in accordance with Item 402(v) of Regulation S-K, includes cash amounts paid for service, the value of other items included in “all other compensation” in the Summary Compensation Table, the change in the fair value of unvested equity awards during the year (through year end or at any earlier vesting date) and the year-end fair value of equity awards granted during the year that remain unvested at year end. In this way, “compensation actually paid” takes into account changes in the fair value of equity awards using closing stock prices and Monte Carlo values. Our equity awards consisted of restricted shares of common stock, stock options, and multi-year performance awards that are earned based upon the achievement of TSR and operating metrics. Accordingly, the “compensation actually paid” to our NEOs as reported in the table below was greatly influenced by the value of our common stock price, which varied over the measurement period as illustrated in the following table:
Fiscal Year End | | Closing Stock Price | | Year over Year Change |
| |
December 31, 2025 | $ | 181.31 |
| (18) | % | |
December 29, 2024 | $ | 219.97 |
| 17 | % | |
December 30, 2023 | $ | 187.22 |
| 16 | % | |
December 31, 2022 | $ | 161.52 |
| (36) | % | |
December 31, 2021 | $ | 252.59 |
| 57 | % | |
December 31, 2020 | $ | 160.43 |
| (23) | % | |
| | | | | | | For Awards | | | | | | | |
Outstanding | ||||||||||||||
(Unvested) as of | ||||||||||||||
December 31 of | For Awards | |||||||||||||
the Applicable | that Vested | |||||||||||||
Subtract | For Awards | Year, Add the | During the | |||||||||||
Summary | Subtracted in | Change in Fair | Applicable Year, | Add | ||||||||||
Compensation | Column | Value Between | Add the Change | Dividends | ||||||||||
Table Value | (B), Add the Fair | December 31 of | in Fair Value | Paid on | ||||||||||
of Equity Awards | Value of Such | the Prior Fiscal | Between | Unvested | ||||||||||
Granted in the | Awards on | Year and | December 31 of | Restricted | ||||||||||
Summary | Applicable Fiscal | December 31 of | December 31 of | the Prior Fiscal | Stock During | |||||||||
Compensation | Year (Grant Date | the Applicable | the Applicable | Year and the | the Applicable | Compensation | ||||||||
Table Total | Fair Value) (i) | Year (ii) | Fiscal Year (iii) | Vesting Date (iv) | Fiscal Year | Actually Paid | ||||||||
Year | (A) | (B) | (C) | (D) | (E) | (F) | (G) | |||||||
2025 – PEO |
| 9,663,500 |
| (6,802,100) |
| 4,897,856 | (3,521,977) |
| (2,749,716) |
| 95,833 |
| 1,583,396 | |
2025 – Avg |
| 4,211,729 |
| (2,497,171) |
| 1,912,929 | (1,014,620) |
| (815,305) |
| 66,131 |
| 1,863,693 | |
2024 – PEO |
| 9,090,073 |
| (6,223,901) |
| 10,049,766 |
| 2,383,680 |
| 1,368,536 |
| 100,233 |
| 16,768,387 |
2024 – Avg |
| 4,185,417 |
| (2,519,469) |
| 3,654,930 |
| 680,855 |
| 341,838 |
| 59,199 |
| 6,402,770 |
2023 – PEO |
| 9,479,687 |
| (6,407,807) |
| 9,203,656 |
| 2,046,598 |
| 3,010,112 |
| 129,434 |
| 17,461,680 |
2023 – Avg |
| 4,108,271 |
| (2,374,971) |
| 3,224,566 |
| 579,192 |
| 960,183 |
| 59,694 |
| 6,556,935 |
2022 – PEO |
| 9,393,208 |
| (6,351,246) |
| 3,705,283 |
| (2,786,237) |
| (342,670) |
| 154,340 |
| 3,772,678 |
2022 – PEO |
| 9,814,142 |
| (7,343,192) |
| 3,696,749 |
| (6,766,814) |
| (924,797) |
| 215,028 |
| (1,308,884) |
2022 – Avg |
| 4,187,942 |
| (2,524,777) |
| 1,453,657 |
| (1,513,615) |
| (212,401) |
| 66,289 |
| 1,457,095 |
2021 – PEO |
| 14,371,460 |
| (10,551,826) |
| 14,011,349 |
| 4,604,039 |
| 3,373,073 |
| 346,146 |
| 26,154,241 |
2021 – Avg |
| 7,495,804 |
| (5,049,488) |
| 6,223,603 |
| 925,342 |
| 583,792 |
| 111,431 |
| 10,290,484 |
| (i) | The amounts reported represent the sum of the amounts reported in the “Stock Awards” and “Option Awards” columns of the Summary Compensation Table for the applicable fiscal year. |
| (ii) | No awards granted during a fiscal year vested that same year. |
| (iii) | Represents the sum of the following for each equity award that was outstanding (unvested) as of December 31 of the applicable fiscal year and December 31 of the prior fiscal year: the difference between (x) the fair value of such award as of December 31 of the applicable fiscal year and (y) the fair value of such award as of December 31 of the prior fiscal year. For performance awards, the fair value represents the Monte Carlo valuation for the TSR portion and the payout corresponding to the interim level of achievement of the operating metrics portion. For options, fair value represents the Black-Scholes value. |
| (iv) | For a multi-year performance award that matured (vested) on December 31 of the reported year, the fair value was the number of units earned valued at the closing price of a share of common stock on the last trading day of that year, plus the cash amount in respect of accrued dividends to be paid out upon settlement. |