Pay vs Performance Disclosure
Dec. 31, 2025
USD ($)
Dec. 31, 2024
USD ($)
Dec. 31, 2023
USD ($)
Dec. 31, 2022
USD ($)
Dec. 31, 2021
USD ($)
Pay versus Performance Table
| Value of Initial Fixed $100 Investment Based on: | ||||||||||||||||||||||||||||||||||||||||||||||||||
Year(1) | SCT Total for PEO | CAP to PEO(2) | Average SCT Total for non-PEO NEOs | Average CAP to non-PEO NEOs(2) | Total Shareholder Return(3) | Peer Group Total Shareholder Return(3) | Net (Loss) Income | Worldwide Revenue Growth(4) | ||||||||||||||||||||||||||||||||||||||||||
| ($) | ($) | ($) | ($) | ($) | ($) | ($ in 000's) | (%) | |||||||||||||||||||||||||||||||||||||||||||
| 2025 | $ | 9,217,620 | $ | 14,939,215 | $ | 3,172,191 | $ | 4,505,597 | $ | 71.06 | $ | 81.27 | $ | (11,448) | 14.9 | % | ||||||||||||||||||||||||||||||||||
| 2024 | 11,070,400 | 6,768,485 | 3,042,529 | 2,298,563 | 54.89 | 66.46 | (44,698) | 16.5 | % | |||||||||||||||||||||||||||||||||||||||||
| 2023 | 8,749,289 | 4,761,236 | 2,669,757 | 1,799,435 | 64.11 | 68.20 | (30,438) | 20.8 | % | |||||||||||||||||||||||||||||||||||||||||
| 2022 | 8,346,968 | 248,184 | 2,256,022 | 798,083 | 79.72 | 67.65 | (46,466) | 20.4 | % | |||||||||||||||||||||||||||||||||||||||||
| 2021 | 7,535,074 | 13,119,796 | 2,142,873 | 3,433,743 | 124.90 | 89.96 | 50,199 | 32.8 | % | |||||||||||||||||||||||||||||||||||||||||
2025: Angela L. Wirick, Douglas J. Seith, Salvatore Privitera, and Justin J. Noznesky
2024: Angela L. Wirick, Douglas J. Seith, Karl S. Dahlquist, and Justin J. Noznesky
2023: Angela L. Wirick, Douglas J. Seith, Karl S. Dahlquist, and Salvatore Privitera
2022: Angela L. Wirick, Douglas J. Seith, Justin J. Noznesky, and Deborah Yount
2021: Angela L. Wirick, Douglas J. Seith, Justin J. Noznesky, and Vinayak Doraiswamy
The table below sets forth a reconciliation from the SCT to CAP for our PEO for the years ended December 31, 2021, 2022, 2023, 2024, and 2025.
PEO | ||||||||||||||||||||||||||||||||
| 2025 | 2024 | 2023 | 2022 | 2021 | ||||||||||||||||||||||||||||
SCT Total Compensation | $ | 9,217,620 | $ | 11,070,400 | $ | 8,749,289 | $ | 8,346,968 | $ | 7,535,074 | ||||||||||||||||||||||
Less: Grant Fair Value of Equity Awards Made During Year(1) | (7,203,478) | (9,350,144) | (6,738,465) | (6,722,916) | (5,594,896) | |||||||||||||||||||||||||||
Year End Fair Value of Equity Awards Made During Year(2) | 8,735,172 | 7,036,576 | 5,933,361 | 3,877,228 | 7,213,771 | |||||||||||||||||||||||||||
Year over Year Change in Fair Value of Outstanding and Unvested Equity Awards(3) | 3,447,697 | (2,046,641) | (2,659,508) | (5,258,934) | 2,640,635 | |||||||||||||||||||||||||||
Year over Year Change in Fair Value of Equity Awards Granted in Prior Years that Vested in the Year(4) | 742,204 | 58,294 | (523,441) | 5,838 | 1,325,212 | |||||||||||||||||||||||||||
Less: Fair Value as of Prior Year End for Awards Granted in Prior Years that were Forfeited(5) | — | — | — | — | — | |||||||||||||||||||||||||||
Incremental Fair Value of Modified Awards(5) | — | — | — | — | — | |||||||||||||||||||||||||||
| Total Adjustments Related to Equity Awards | 5,721,595 | (4,301,915) | (3,988,053) | (8,098,784) | 5,584,722 | |||||||||||||||||||||||||||
Total CAP | $ | 14,939,215 | $ | 6,768,485 | $ | 4,761,236 | $ | 248,184 | $ | 13,119,796 | ||||||||||||||||||||||
(1)Represents the grant date fair value of equity-based awards made during the fiscal year as reported in the SCT.
(2)Represents the year-end fair value of equity awards that were made during the fiscal year and remained unvested as of year-end.
(3)Represents the change in fair value during the fiscal year of equity-based awards granted in prior fiscal years that were still unvested as of each fiscal year-end. For awards with a performance condition, the estimated fair value is measured at the probable outcome of such condition as of the last day of the fiscal year. Estimated attainment for awards in periods presented ranges from 93% to 196%.
(4)Represents the change in fair value during the fiscal year of equity-based awards granted in prior fiscal years that vested during the current fiscal year.
(5)No activity during periods presented.
The table below sets forth a reconciliation from the average SCT to average CAP for our non-PEO NEOs for the years ended December 31, 2021, 2022, 2023, 2024, and 2025.
Non-PEO NEOs | ||||||||||||||||||||||||||||||||
| 2025 | 2024 | 2023 | 2022 | 2021 | ||||||||||||||||||||||||||||
Average SCT Total Compensation | $ | 3,172,191 | $ | 3,042,529 | $ | 2,669,757 | $ | 2,256,022 | $ | 2,142,873 | ||||||||||||||||||||||
Less: Grant Fair Value of Equity Awards Made During Year(1) | (2,184,696) | (2,229,820) | (1,778,787) | (1,555,800) | (1,327,506) | |||||||||||||||||||||||||||
Year End Fair Value of Equity Awards Made During Year(2) | 2,459,707 | 1,867,371 | 1,584,409 | 1,106,735 | 1,656,615 | |||||||||||||||||||||||||||
Year over Year Change in Fair Value of Outstanding and Unvested Equity Awards(3) | 833,688 | (396,661) | (620,469) | (954,967) | 549,341 | |||||||||||||||||||||||||||
Year over Year Change in Fair Value of Equity Awards Granted in Prior Years that Vested in the Year(4) | 224,707 | 15,144 | (55,475) | (53,907) | 412,420 | |||||||||||||||||||||||||||
Less: Fair Value as of Prior Year End for Awards Granted in Prior Years that were Forfeited(5) | — | — | — | — | — | |||||||||||||||||||||||||||
Incremental Fair Value of Modified Awards(5) | — | — | — | — | — | |||||||||||||||||||||||||||
| Total Adjustments Related to Equity Awards | 1,333,406 | (743,966) | (870,322) | (1,457,939) | 1,290,870 | |||||||||||||||||||||||||||
Total Average CAP | $ | 4,505,597 | $ | 2,298,563 | $ | 1,799,435 | $ | 798,083 | $ | 3,433,743 | ||||||||||||||||||||||
(1)Represents the grant date fair value of equity-based awards made during the fiscal year as reported in the SCT.
(2)Represents the year-end fair value of equity awards that were made during the fiscal year and remained unvested as of year-end.
(3)Represents the change in fair value during the fiscal year of equity-based awards granted in prior fiscal years that were still unvested as of each fiscal year-end. For awards with a performance condition, the estimated fair value is measured at the probable outcome of such condition as of the last day of the fiscal year. Estimated attainment for awards in periods presented ranges from 93% to 196%.
(4)Represents the change in fair value during the fiscal year of equity-based awards granted in prior fiscal years that vested during the current fiscal year.
(5)No activity during periods presented.
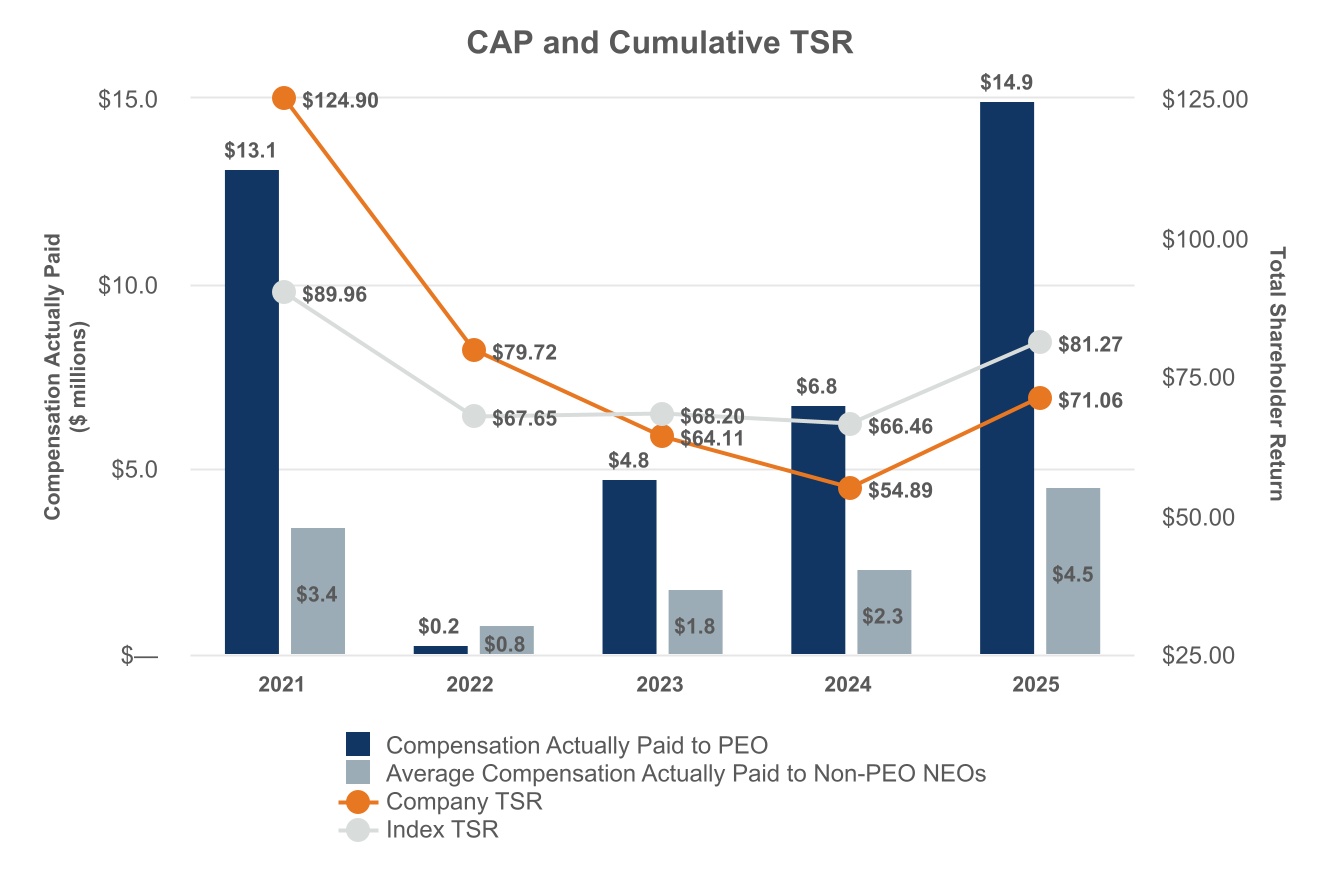
Cumulative TSR
The chart below reflects the relationship between the compensation actually paid to the PEO and average compensation actually paid to the Non-PEO NEOs to AtriCure's TSR and the peer group TSR.
Net Income (Loss)
| Year | CAP to PEO | ∆ CAP to PEO | Average CAP to non-PEO NEOs | ∆ CAP to Non-PEO NEO | Net (Loss) Income ($ in 000's) | ∆ Net (Loss) Income | ||||||||||||||||||||||||||||||||
| 2025 | $ | 14,939,215 | 120.7 | % | $ | 4,505,597 | 96.0 | % | $ | (11,448) | (74.4) | % | ||||||||||||||||||||||||||
| 2024 | 6,768,485 | 42.2 | % | 2,298,563 | 27.7 | % | (44,698) | 46.8 | % | |||||||||||||||||||||||||||||
| 2023 | 4,761,236 | 1818.4 | % | 1,799,435 | 125.5 | % | (30,438) | (34.5) | % | |||||||||||||||||||||||||||||
| 2022 | 248,184 | (98.1) | % | 798,083 | (76.8) | % | (46,466) | (192.5) | % | |||||||||||||||||||||||||||||
| 2021 | 13,119,796 | (4.6) | 3,433,743 | 21.8 | 50,199 | (204.2) | ||||||||||||||||||||||||||||||||
Our strategy is to make investments to drive sustainable growth, and we incur substantial expenditures to develop and commercialize our products, expand our markets and build a foundation to support future growth. As a result, we have incurred net losses throughout our history. Our net losses have resulted principally from costs and expenses relating to sales, training and awareness efforts, research and product development, clinical trials, seeking regulatory clearances and approvals, product quality and safety initiatives and general operating expenses. Our net income (loss) can also be significantly impacted by non-recurring adjustments or charges that are not reflective of our ongoing core business operations and financial condition, as was the case in fiscal year 2021. We believe net income (loss) is not reflective of our ongoing core operations of our business, nor is it a metric that is most important to stockholder value. Therefore, it is not a metric used in any of the Company's incentive plans, and CAP is not correlated with net income (loss).
Worldwide Revenue Growth
| Year | CAP to PEO | ∆ CAP to PEO | Average CAP to non-PEO NEOs | ∆ CAP to Non-PEO NEO | Worldwide Revenue ($ in 000's) | Worldwide Revenue Growth | ∆ Worldwide Revenue Growth | |||||||||||||||||||||||||||||||||||||
| 2025 | $ | 14,939,215 | 120.7 | % | $ | 4,505,597 | 96.0 | % | $ | 534,528 | 14.9 | % | (1.6) | % | ||||||||||||||||||||||||||||||
| 2024 | 6,768,485 | 42.2 | % | 2,298,563 | 27.7 | % | 465,307 | 16.5 | % | (4.3) | % | |||||||||||||||||||||||||||||||||
| 2023 | 4,761,236 | 1818.4 | % | 1,799,435 | 125.5 | % | 399,245 | 20.8 | % | 0.4 | % | |||||||||||||||||||||||||||||||||
| 2022 | 248,184 | (98.1) | % | 798,083 | (76.8) | % | 330,379 | 20.4 | % | (12.4) | % | |||||||||||||||||||||||||||||||||
| 2021 | 13,119,796 | (4.6) | 3,433,743 | 21.8 | 274,329 | 32.8 | % | 43.3 | ||||||||||||||||||||||||||||||||||||
Worldwide revenue growth is the most important company-selected measure. The Compensation Committee believes at this time it is appropriate for the Company to utilize worldwide revenue growth as a performance metric for both the annual incentive plan and the long-term performance share awards due to the importance of this metric to the Company’s investors. The Company believes that many of its current and prospective investors view worldwide revenue growth as the single most important performance metric of the Company. Annual revenue growth is used as a metric for performance attainment of the annual incentive plan, while revenue CAGR over a three-year performance period is used for the performance share awards included in the long-term equity incentive plans. Due to the difference in performance period duration, as well as the significant impact of the Company's stock price on the valuation of the equity incentive awards included in the calculation of CAP, the CAP for the PEO and non-PEO NEO is not correlated in the periods presented. Non-PEO NEO CAP was also impacted by the shifting of non-PEO membership within the periods presented.
The Company's chosen peer group is the NASDAQ Heath Care Index constituents. This is the same peer group disclosed in the Form 10-K performance graph, as well as the same index used to measure the relative total shareholder return performance target for the performance share awards granted annually to our executive officers since 2021. Over the five-year period shown in the table above, the Company's total shareholder return (TSR) was similar to the peer group's
TSR. The Company's stock performance significantly impacts executive compensation as approximately 70% or greater of the PEO total compensation and over 50% of the non-PEO total compensation is comprised of equity incentive plan awards since 2021. Therefore, CAP for the PEO and non-PEO NEOs is positively correlated to fluctuations in the Company's stock performance as it has a significant impact on the valuation of the underlying equity incentive awards included in the calculation of CAP. The percentage change in the Company TSR from the grant date and year over year has a proportionate impact on the CAP paid.
| Most Important Performance Measures | ||
| Worldwide Revenue Growth | ||
| Shareholder Return | ||
As required by Section 953(a) of the Dodd-Frank Wall Street Reform and Consumer Protection Act and Item 402(v) of Regulation S-K, we are providing disclosures of the relationship between executive compensation paid and the Company's financial performance. Under the SEC's pay versus performance rules, the SEC has developed a new definition of pay, referred to as Compensation Actually Paid (“CAP”), which is compared to certain performance measures defined by the SEC.
In the table below, totals for the Summary Compensation Table (“SCT”) and CAP values represent a mix of both compensation earned during the year (base salary and annual incentives) and estimated future pay opportunities (equity incentive awards). The difference between the SCT presentation and calculation of CAP is the value attributable to equity incentive awards. Within SCT values, equity incentive awards include the grant date fair value of equity incentive awards awarded during the year, reflecting the evaluation of the prior year's performance. Within CAP values, equity incentive awards represents the year-over-year change in the values of unvested equity incentive awards, awards that vested or forfeited during the year, as well as the year-end valuation of equity incentive awards granted during the year.The measures most important in determining pay during 2025 were those that impact achievement of our equity incentive awards and annual incentive plans.
Worldwide revenue growth is calculated as the percentage change in worldwide revenue over the prior year. Worldwide revenue growth impacts both the achievement of our annual incentive plan objectives and performance targets of equity incentive awards.•Shareholder return is calculated as the percentage change in stock price as of December 31 year over year. Shareholder return impacts the achievement of performance targets of equity incentive awards, as well as the value of stock awards realized by our named executive officers.
Analysis of Information Presented in the Pay versus Performance Table
Our compensation philosophy is to strongly link executive officer compensation to our performance and is intended to create long-term value for our stockholders. In accordance with Item 402(v) of Regulation S-K, we are providing the following description of relationships between information presented in the Pay versus Performance Table.