Pay vs Performance Disclosure
|
12 Months Ended |
|
Dec. 31, 2025
USD ($)
percent
|
Dec. 31, 2024
USD ($)
percent
|
Dec. 31, 2023
USD ($)
percent
|
Dec. 31, 2022
USD ($)
percent
|
Dec. 31, 2021
USD ($)
percent
|
| Pay vs Performance Disclosure |
|
|
|
|
|
| Pay vs Performance Disclosure, Table |
| | | | | | | | | | | | | | | | | | | | | | | | | | | | | | | | | | | | | | | | | | | | | | | | | | | Year | | Summary Comp for PEO ($) (1) | | Comp Actually Paid to PEO ($) (6) | | Average Summary Comp for Non-PEO NEOs ($) (2) | | Average Comp Actually Paid to Non-PEO NEOs ($) (6) | | Value of Initial Fixed $100 Investment Based on (3): | | Net Income ($) | | Return on Average Tangible Common Equity (5) | | | | | | | | TSR ($) | Peer Group TSR ($) (4) | | | | | 2025 | | 2,981,248 | | | 3,793,851 | | | 1,065,238 | | | 1,403,669 | | | 154.74 | | 131.59 | | | 121,558,000 | | | 12.58 | % | | | | 2024 | | 2,896,621 | | | 3,146,985 | | | 1,209,547 | | | 1,285,047 | | | 123.34 | | 109.09 | | | 114,868,000 | | | 13.28 | % | | | | 2023 | | 3,097,841 | | | 2,361,529 | | | 1,302,528 | | | 941,214 | | | 117.37 | | 80.70 | | | 117,390,000 | | | 15.52 | % | | | | 2022 | | 2,511,604 | | | 6,861,267 | | | 1,128,277 | | | 1,910,480 | | | 134.99 | | 83.86 | | | 125,419,000 | | | 16.85 | % | | | | 2021 | | 2,833,364 | | | 3,581,851 | | | 1,361,521 | | | 1,519,885 | | | 111.05 | | 110.39 | | | 117,655,000 | | | 16.50 | % | | |
|
|
|
|
|
| Company Selected Measure Name |
Average Tangible Common Equity
|
|
|
|
|
| Named Executive Officers, Footnote |
(1) Richard Smith was the Principle Executive Officer (PEO) for each of the years presented. (2) Non-PEO Named Executive Officers (NEOs) consisted of Peter Wiese, John Fleshood, Craig Carney and Dan Bailey for each of the years presented. For 2025, also includes Greg Gehlmann.
|
|
|
|
|
| Peer Group Issuers, Footnote |
The peer group used by the Company consists of the index used in the Company’s performance graph as required by item 201(e) of Regulation S-K and reported in Part II, item 5 of its annual report on Form 10-K for the fiscal year ended December 31, 2025, named the S&P Western Bank Index.
|
|
|
|
|
| PEO Total Compensation Amount |
$ 2,981,248
|
$ 2,896,621
|
$ 3,097,841
|
$ 2,511,604
|
$ 2,833,364
|
| PEO Actually Paid Compensation Amount |
$ 3,793,851
|
3,146,985
|
2,361,529
|
6,861,267
|
3,581,851
|
| Adjustment To PEO Compensation, Footnote |
| | | | | | | | | | | | | | | | | | | | | | | | | | | | | | | | | | | | | Adjustments to Determine Compensation ‘Actually Paid’ to PEO | | 2025 | | 2024 | | 2023 | | | 2022 | | | 2021 | | | Pension Plans | | | | | | | | | | | | | | | Deduction for aggregate change in the actuarial present values reported under the “Change in Pension Value and Nonqualified Deferred Compensation Earnings” column of the Summary Compensation Table | | (69,527) | | | (13,537) | | | (138,132) | | | | (14,658) | | | | (14,856) | | | | Increase for “Service Cost” for pension plans | | 66,950 | | | 74,635 | | | 68,694 | | | | 550,415 | | | | 559,097 | | | | Increase for “Prior Service Cost” or “Amendments” for pension plans | | — | | | — | | | — | | | | 2,031,799 | | | | (6,736) | | | | Equity Awards | | | | | | | | | | | | | | | Deduction for amounts reported under the “Stock Awards” column in the Summary Compensation Table | | (758,458) | | | (690,574) | | | (862,084) | | | | (867,813) | | | | (731,456) | | | | Deduction for amounts reported under the “Option Awards” column in the Summary Compensation Table | | — | | | — | | | — | | | | — | | | | — | | | | Fair value at year-end of awards granted during year that remain outstanding and unvested as of year-end | | 1,031,883 | | | 974,763 | | | 1,027,714 | | | | 1,297,649 | | | | 620,036 | | | | Vest date fair value of awards granted during year that vested during covered year | | — | | | — | | | — | | | | — | | | | — | | | | Increase/deduction for change in fair value from prior year-end to covered year-end of awards granted prior to covered year that were outstanding and unvested as of year-end | | (412,640) | | | 27,018 | | | (242,369) | | | | 1,160,444 | | | | 155,641 | | | | Increase/deduction for change in fair value from prior year-end to vesting date of awards granted prior to covered year that vested during covered year | | 954,395 | | | (121,941) | | | (590,135) | | | | 191,827 | | | | 166,761 | | | | Deduction of fair value of awards granted prior to covered year that were forfeited during covered year | | — | | | — | | | — | | | | — | | | | — | | | | Increase based upon incremental fair value of awards modified during year | | — | | | — | | | — | | | | — | | | | — | | | | Increase based on dividends or other earnings paid during covered year | | — | | | — | | | — | | | | — | | | | — | | | | Total Adjustments | | 812,603 | | | 250,364 | | | (736,312) | | | | 4,349,663 | | | | 748,487 | | |
|
|
|
|
|
| Non-PEO NEO Average Total Compensation Amount |
$ 1,065,238
|
1,209,547
|
1,302,528
|
1,128,277
|
1,361,521
|
| Non-PEO NEO Average Compensation Actually Paid Amount |
$ 1,403,669
|
1,285,047
|
941,214
|
1,910,480
|
1,519,885
|
| Adjustment to Non-PEO NEO Compensation Footnote |
Compensation ‘actually paid’ is calculated in accordance with Item 402(v) of Regulation S-K. The tables below sets forth each adjustment made during each year presented in the table to calculate the compensation ‘actually paid’ to our PEO and NEOs during each years presented | | | | | | | | | | | | | | | | | | | | | | | | | | | | | | | | | | | | | | Adjustments to Determine Average Compensation ‘Actually Paid’ to Non-PEO NEOs | | 2025 | | 2024 | | | 2023 | | | 2022 | | | 2021 | | | Pension Plans | | | | | | | | | | | | | | | | Deduction for aggregate change in the actuarial present values reported under the “Change in Pension Value and Nonqualified Deferred Compensation Earnings” column of the Summary Compensation Table | | (59,625) | | | (12,197) | | | | (77,330) | | | | (4,410) | | | | (4,685) | | | | Increase for “Service Cost” for pension plans | | 21,057 | | | 19,182 | | | | 17,153 | | | | 65,896 | | | | 88,476 | | | | Increase for “Prior Service Cost” or “Amendments” for pension plans | | — | | | — | | | | — | | | | 27,300 | | | | (2,132) | | | | Equity Awards | | | | | | | | | | | | | | | | Deduction for amounts reported under the “Stock Awards” column in the Summary Compensation Table | | (226,223) | | | (255,750) | | | | (319,067) | | | | (318,908) | | | | (294,918) | | | | Deduction for amounts reported under the “Option Awards” column in the Summary Compensation Table | | — | | | — | | | | — | | | | — | | | | — | | | | Fair value at year-end of awards granted during year that remain outstanding and unvested as of year-end | | 299,315 | | | 361,003 | | | | 380,355 | | | | 499,495 | | | | 249,994 | | | | Vest date fair value of awards granted during year that vested during covered year | | — | | | — | | | | — | | | | — | | | | — | | | | Increase/deduction for change in fair value from prior year-end to covered year-end of awards granted prior to covered year that were outstanding and unvested as of year-end | | 46,606 | | | 12,282 | | | | (141,403) | | | | 446,676 | | | | 57,883 | | | | Increase/deduction for change in fair value from prior year-end to vesting date of awards granted prior to covered year that vested during covered year | | 257,300 | | | (49,020) | | | | (221,022) | | | | 66,154 | | | | 63,746 | | | Deduction of fair value of awards granted prior to covered year that were forfeited during
covered year | | — | | | — | | | | — | | | | — | | | | — | | | | Increase based upon incremental fair value of awards modified during year | | — | | | — | | | | — | | | | — | | | | — | | | | Increase based on dividends or other earnings paid during covered year | | — | | | — | | | | — | | | | — | | | | — | | | | Total Adjustments | | 338,430 | | | 75,500 | | | | (361,314) | | | | 782,203 | | | | 158,364 | | |
|
|
|
|
|
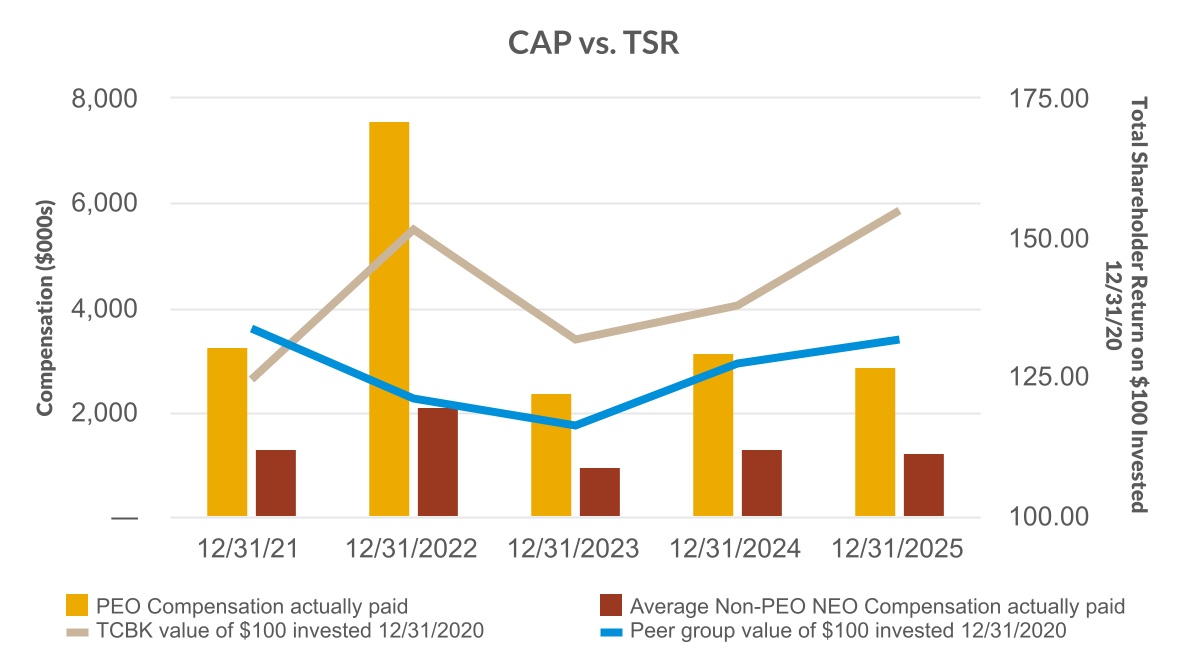
| Compensation Actually Paid vs. Total Shareholder Return |
|
|
|
|
|
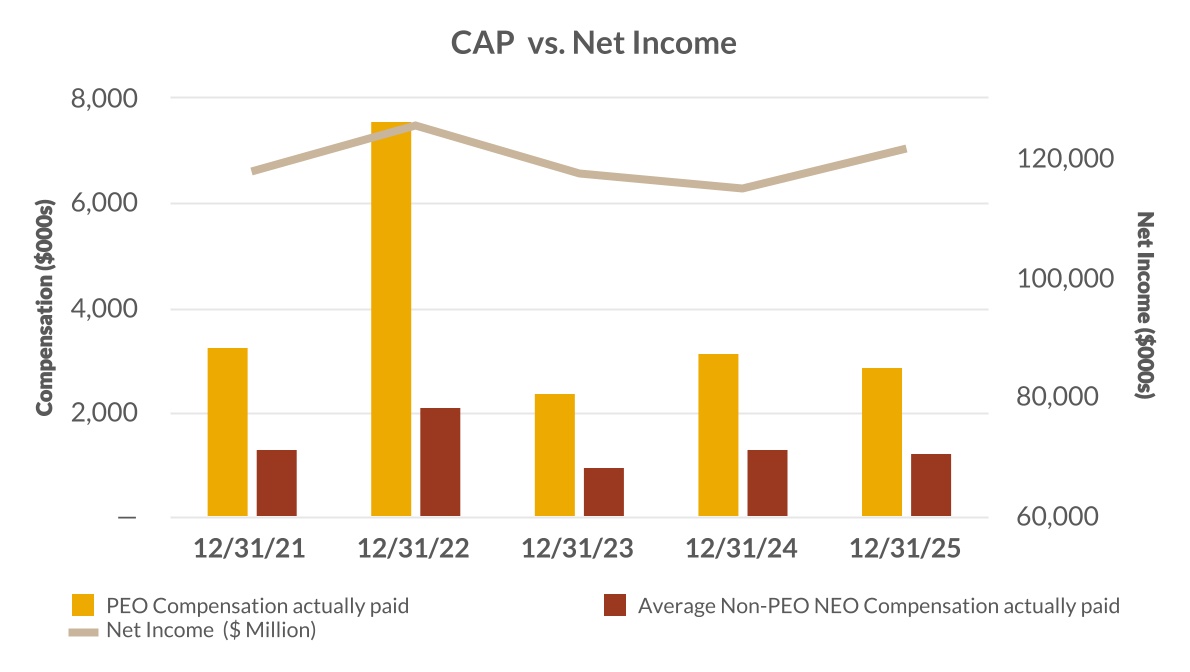
| Compensation Actually Paid vs. Net Income |
|
|
|
|
|
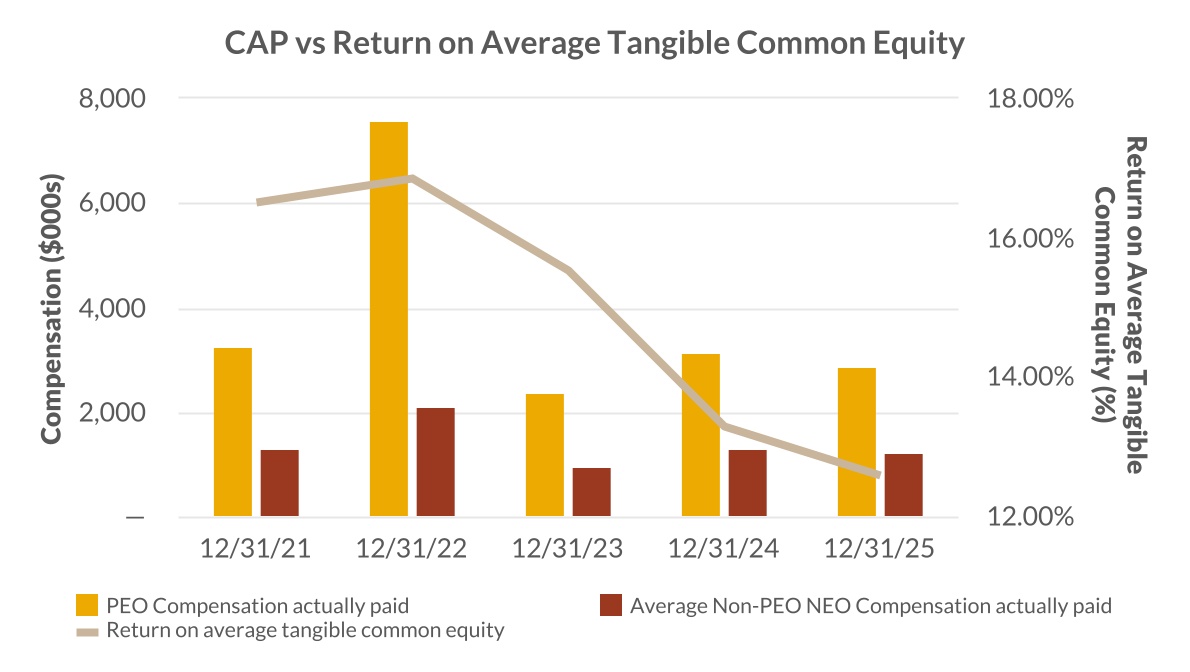
| Compensation Actually Paid vs. Company Selected Measure |
|
|
|
|
|
| Total Shareholder Return Vs Peer Group |
|
|
|
|
|
| Tabular List, Table |
| | | | Most Important Performance Measures | | Net income | | Total shareholder return (TSR) | | Return on average tangible common equity | | Pre-tax pre-provision return on average equity | | Efficiency Ratio | | Nonperforming Assets to Total Assets |
|
|
|
|
|
| Total Shareholder Return Amount |
$ 154.74
|
123.34
|
117.37
|
134.99
|
111.05
|
| Peer Group Total Shareholder Return Amount |
131.59
|
109.09
|
80.70
|
83.86
|
110.39
|
| Net Income (Loss) |
$ 121,558,000
|
$ 114,868,000
|
$ 117,390,000
|
$ 125,419,000
|
$ 117,655,000
|
| Company Selected Measure Amount | percent |
0.1258
|
0.1328
|
0.1552
|
0.1685
|
0.1650
|
| PEO Name |
Richard Smith
|
Richard Smith
|
Richard Smith
|
Richard Smith
|
Richard Smith
|
| Additional 402(v) Disclosure |
Assumes $100 invested in our common shares on December 31, 2020 and reinvestment of all dividends. We believe the following performance measures represent the most important financial performance measures used by us to link compensation actually paid to our non-CEO NEOs for the fiscal year ended December 31, 2025: While we utilize several performance measures to align executive compensation with performance, all of those measures are not presented in the Pay for Performance table. Moreover, as we seek to incentivize long-term performance, the changes in compensation values as reported in the reconciling tables above and identified as “compensation that is actually paid” (as defined by the SEC rules) for any covered year may not specifically align with the company’s performance measures. For descriptions and additional details regarding our most important financial performance and other measures, please see the discussion in our Compensation Discussion and Analysis (CD&A) section beginning on page 30 .
|
|
|
|
|
| Measure:: 1 |
|
|
|
|
|
| Pay vs Performance Disclosure |
|
|
|
|
|
| Name |
Net income
|
|
|
|
|
| Measure:: 2 |
|
|
|
|
|
| Pay vs Performance Disclosure |
|
|
|
|
|
| Name |
Total shareholder return (TSR)
|
|
|
|
|
| Measure:: 3 |
|
|
|
|
|
| Pay vs Performance Disclosure |
|
|
|
|
|
| Name |
Return on average tangible common equity
|
|
|
|
|
| Non-GAAP Measure Description |
Our Company-Selected Measure is Return on Average Tangible Common Equity, which is a non-GAAP measure (net income, adjusted for tax-affected amortization of intangibles, as a percent of average tangible common equity (average shareholders’ equity, less average tangible assets)). See our reconciliation at Appendix A.
|
|
|
|
|
| Measure:: 4 |
|
|
|
|
|
| Pay vs Performance Disclosure |
|
|
|
|
|
| Name |
Pre-tax pre-provision return on average equity
|
|
|
|
|
| Measure:: 5 |
|
|
|
|
|
| Pay vs Performance Disclosure |
|
|
|
|
|
| Name |
Efficiency Ratio
|
|
|
|
|
| Measure:: 6 |
|
|
|
|
|
| Pay vs Performance Disclosure |
|
|
|
|
|
| Name |
Nonperforming Assets to Total Assets
|
|
|
|
|
| PEO |
|
|
|
|
|
| Pay vs Performance Disclosure |
|
|
|
|
|
| Adjustment to Compensation, Amount |
$ 812,603
|
$ 250,364
|
$ (736,312)
|
$ 4,349,663
|
$ 748,487
|
| PEO | Aggregate Change in Present Value of Accumulated Benefit for All Pension Plans Reported in Summary Compensation Table |
|
|
|
|
|
| Pay vs Performance Disclosure |
|
|
|
|
|
| Adjustment to Compensation, Amount |
(69,527)
|
(13,537)
|
(138,132)
|
(14,658)
|
(14,856)
|
| PEO | Pension Adjustments Service Cost |
|
|
|
|
|
| Pay vs Performance Disclosure |
|
|
|
|
|
| Adjustment to Compensation, Amount |
66,950
|
74,635
|
68,694
|
550,415
|
559,097
|
| PEO | Pension Adjustments Prior Service Cost |
|
|
|
|
|
| Pay vs Performance Disclosure |
|
|
|
|
|
| Adjustment to Compensation, Amount |
0
|
0
|
0
|
2,031,799
|
(6,736)
|
| PEO | Year-end Fair Value of Equity Awards Granted in Covered Year that are Outstanding and Unvested |
|
|
|
|
|
| Pay vs Performance Disclosure |
|
|
|
|
|
| Adjustment to Compensation, Amount |
1,031,883
|
974,763
|
1,027,714
|
1,297,649
|
620,036
|
| PEO | Year-over-Year Change in Fair Value of Equity Awards Granted in Prior Years That are Outstanding and Unvested |
|
|
|
|
|
| Pay vs Performance Disclosure |
|
|
|
|
|
| Adjustment to Compensation, Amount |
(412,640)
|
27,018
|
(242,369)
|
1,160,444
|
155,641
|
| PEO | Vesting Date Fair Value of Equity Awards Granted and Vested in Covered Year |
|
|
|
|
|
| Pay vs Performance Disclosure |
|
|
|
|
|
| Adjustment to Compensation, Amount |
0
|
0
|
0
|
0
|
0
|
| PEO | Change in Fair Value as of Vesting Date of Prior Year Equity Awards Vested in Covered Year |
|
|
|
|
|
| Pay vs Performance Disclosure |
|
|
|
|
|
| Adjustment to Compensation, Amount |
954,395
|
(121,941)
|
(590,135)
|
191,827
|
166,761
|
| PEO | Prior Year End Fair Value of Equity Awards Granted in Any Prior Year that Fail to Meet Applicable Vesting Conditions During Covered Year |
|
|
|
|
|
| Pay vs Performance Disclosure |
|
|
|
|
|
| Adjustment to Compensation, Amount |
0
|
0
|
0
|
0
|
0
|
| PEO | Dividends or Other Earnings Paid on Equity Awards not Otherwise Reflected in Total Compensation for Covered Year |
|
|
|
|
|
| Pay vs Performance Disclosure |
|
|
|
|
|
| Adjustment to Compensation, Amount |
0
|
0
|
0
|
0
|
0
|
| PEO | Aggregate Grant Date Fair Value of Equity Award Amounts Reported in Summary Compensation Table, Stock Awards [Member] |
|
|
|
|
|
| Pay vs Performance Disclosure |
|
|
|
|
|
| Adjustment to Compensation, Amount |
(758,458)
|
(690,574)
|
(862,084)
|
(867,813)
|
(731,456)
|
| PEO | Aggregated Grant Date Fair Value of Equity Award Amounts Reported In Summary Compensation Table, Option Awards [Member] |
|
|
|
|
|
| Pay vs Performance Disclosure |
|
|
|
|
|
| Adjustment to Compensation, Amount |
0
|
0
|
0
|
0
|
0
|
| PEO | Increase Based Upon Incremental Fair Value Of Awards Modified During Year [Member] |
|
|
|
|
|
| Pay vs Performance Disclosure |
|
|
|
|
|
| Adjustment to Compensation, Amount |
0
|
0
|
0
|
0
|
0
|
| Non-PEO NEO |
|
|
|
|
|
| Pay vs Performance Disclosure |
|
|
|
|
|
| Adjustment to Compensation, Amount |
338,430
|
75,500
|
(361,314)
|
782,203
|
158,364
|
| Non-PEO NEO | Aggregate Change in Present Value of Accumulated Benefit for All Pension Plans Reported in Summary Compensation Table |
|
|
|
|
|
| Pay vs Performance Disclosure |
|
|
|
|
|
| Adjustment to Compensation, Amount |
(59,625)
|
(12,197)
|
(77,330)
|
(4,410)
|
(4,685)
|
| Non-PEO NEO | Pension Adjustments Service Cost |
|
|
|
|
|
| Pay vs Performance Disclosure |
|
|
|
|
|
| Adjustment to Compensation, Amount |
21,057
|
19,182
|
17,153
|
65,896
|
88,476
|
| Non-PEO NEO | Pension Adjustments Prior Service Cost |
|
|
|
|
|
| Pay vs Performance Disclosure |
|
|
|
|
|
| Adjustment to Compensation, Amount |
0
|
0
|
0
|
27,300
|
(2,132)
|
| Non-PEO NEO | Year-end Fair Value of Equity Awards Granted in Covered Year that are Outstanding and Unvested |
|
|
|
|
|
| Pay vs Performance Disclosure |
|
|
|
|
|
| Adjustment to Compensation, Amount |
299,315
|
361,003
|
380,355
|
499,495
|
249,994
|
| Non-PEO NEO | Year-over-Year Change in Fair Value of Equity Awards Granted in Prior Years That are Outstanding and Unvested |
|
|
|
|
|
| Pay vs Performance Disclosure |
|
|
|
|
|
| Adjustment to Compensation, Amount |
46,606
|
12,282
|
(141,403)
|
446,676
|
57,883
|
| Non-PEO NEO | Vesting Date Fair Value of Equity Awards Granted and Vested in Covered Year |
|
|
|
|
|
| Pay vs Performance Disclosure |
|
|
|
|
|
| Adjustment to Compensation, Amount |
0
|
0
|
0
|
0
|
0
|
| Non-PEO NEO | Change in Fair Value as of Vesting Date of Prior Year Equity Awards Vested in Covered Year |
|
|
|
|
|
| Pay vs Performance Disclosure |
|
|
|
|
|
| Adjustment to Compensation, Amount |
257,300
|
(49,020)
|
(221,022)
|
66,154
|
63,746
|
| Non-PEO NEO | Prior Year End Fair Value of Equity Awards Granted in Any Prior Year that Fail to Meet Applicable Vesting Conditions During Covered Year |
|
|
|
|
|
| Pay vs Performance Disclosure |
|
|
|
|
|
| Adjustment to Compensation, Amount |
0
|
0
|
0
|
0
|
0
|
| Non-PEO NEO | Dividends or Other Earnings Paid on Equity Awards not Otherwise Reflected in Total Compensation for Covered Year |
|
|
|
|
|
| Pay vs Performance Disclosure |
|
|
|
|
|
| Adjustment to Compensation, Amount |
0
|
0
|
0
|
0
|
0
|
| Non-PEO NEO | Aggregate Grant Date Fair Value of Equity Award Amounts Reported in Summary Compensation Table, Stock Awards [Member] |
|
|
|
|
|
| Pay vs Performance Disclosure |
|
|
|
|
|
| Adjustment to Compensation, Amount |
(226,223)
|
(255,750)
|
(319,067)
|
(318,908)
|
(294,918)
|
| Non-PEO NEO | Aggregated Grant Date Fair Value of Equity Award Amounts Reported In Summary Compensation Table, Option Awards [Member] |
|
|
|
|
|
| Pay vs Performance Disclosure |
|
|
|
|
|
| Adjustment to Compensation, Amount |
0
|
0
|
0
|
0
|
0
|
| Non-PEO NEO | Increase Based Upon Incremental Fair Value Of Awards Modified During Year [Member] |
|
|
|
|
|
| Pay vs Performance Disclosure |
|
|
|
|
|
| Adjustment to Compensation, Amount |
$ 0
|
$ 0
|
$ 0
|
$ 0
|
$ 0
|